Microstrip Moisture Sensor Based on Microstrip Patch Antenna
Sweety Jain1, *, Pankaj K. Mishra2, Vandana V. Thakare3, and Jyoti Mishra4
Abstract—A miniaturized U-shape patch sensor (15 mm × 15 mm) was designed at dual resonating frequencies (fr) 5.2 GHz and 6.8 GHz. The proposed design printed on FR4 material with a thickness of 1.676 mm and relative permittivity 4.4. To simulate the performances of the proposed design, the CST Microwave Studio (CST MWS) was used. The reflection coefficient of U-shape patch sensor was measured. Basmati rice was investigated, and bulk density was increased with increase of moisture content, hence varied from 554.3 to 591 kg/m3. It has the longest average rice length (L) 7.2 mm, average width (W) 1.61 mm, andL/W ratio 4.47. The percentage of moisture was varied from 10.71% to 21.87% calculated on a wet weight basis. The lowest mean relative error (MRE) determined between predicted moisture content (PMC) and actual moisture content (AMC) was 0.55% at dual frequencies.
1. INTRODUCTION
Microstrip resonators have been widely used for the measurement of dispersion, phase velocity [1– 4], dielectric constant [5], and discontinuities [6, 7]. The two configurations that are most used are linear and ring resonators. For a linear resonator, the fringing fields on both open ends will cause a foreshortening effect [8–10], along with surface- and space-wave radiation losses [11–13], whereas ring resonator (Figure 1) has two advantages: It is free of open-ended effects, and its curvature effects can be made negligible if its diameter is large enough, with respect to the line width [14].
Rice is the most important cereal food crop of India, occupying one-fourth of the gross cropped area of the country. As a basic food crop, rice is cultivated comfortably in hot and humid climate, but the main concern arises when matter rises related to its storage, transportation and delivery to beneficiaries. As India has both tropical and subtropical climates, if transportation is done from north to south or vice versa either for consumption or for exports, then proper storage becomes a main subject. For the storage of rice, its moisture content needs to maintain that will ensure safety of rice from destroy or insects. Also to fulfil needs of population [India consumes about 100 million metric tonnes (approx.) per year] government maintains its buffer stock. It is possible to maintain food in buffer stock fresh, and moisture content of rice also needs to be maintained. To achieve this, it is aimed to construct microstrip moisture sensors which can detect moisture quickly through which it becomes easy to decide regarding dispatch grain or storage related matters. A lot of procedures have been found to measure moisture content in rice. A traditional drying method has been described to measure moisture. An open-ended coaxial probe has been used to measure the dielectric concentration of starch. These time-consuming processes are complex, and the system development cost is high. Being comparatively simple and cost-effective system, microstrip technology is now widely used in various applications like agriculture, medical, communications, etc. [15, 16]. Dielectric based sensors depend on the dielectric properties, as well as the physical properties of the material. These sensors have
Received 26 September 2018, Accepted 28 November 2018, Scheduled 11 December 2018
* Corresponding author: Sweety Jain ([email protected]).
1 Department of Electronics and Communication, Amity University Gwalior, Maharajpura Gwalior, Madhya Pradesh, India. 2 Department of Applied Physics, Amity University Gwalior, Maharajpura Gwalior, Madhya Pradesh, India. 3 Department of
been used in sensing the moisture content, temperature, bulk density, salinity, fuel adulteration, etc. A microstrip patch antenna has been reported in [15] which can be used in agricultural field with a relatively larger size of 7.9 cm×5.4 cm. The effects of moisture on the dielectric properties of rice have been reported. The microstrip patch antenna has been used in the measurement of dielectric properties of materials. The technique of medical diagnostics using waveguide probes and reflection methods has been rendered in [16]. The rectangular dielectric waveguide (RDWG) technique has been described for the determination of moisture in oil palm fruits [17]. To measure moisture in hevea rubber latex, a U-shaped antenna has been described [18]. A moisture sensor has been rendered based on the microstrip antenna which is operated on dual frequencies [19–26].
In this article, the main focus was to design a patch sensor with compact size (15 mm × 15 mm × 1.676 mm) and to reduce MRE between the PMC and AMC for detected the moisture content of rice through the sensor.
2. SENSOR DESIGN
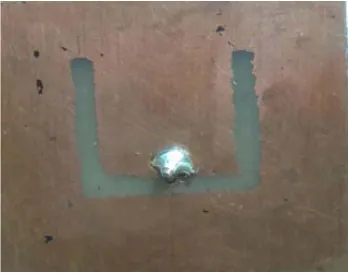
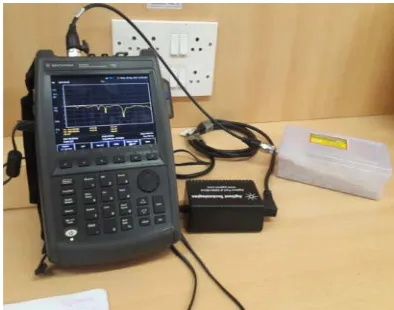
The U-shape patch sensor design and fabricated sensor are shown in Figure 1 and Figure 2. The optimized dimensions of the sensor geometry are listed in Table 1. The area of the substrate was 15×15 mm2. The U-shape radiator was printed on top layer of the substrate. The CST optimized common element sensor fabricated on an FR4 substrate and energized using a 50 ohm SMA connector. An (SMA) 50 Ω connector allowed the sensor to be connected to the port of an Agilent N9925A (VNA) Vector Network Analyzer, while discrete ports are mainly used to simulate lumped element sources inside the calculation domain. These ports are a good approximation for the source in the feeding point of antennas when calculating farfields. In some cases, these ports may also be used to terminate coaxial cables or microstrip lines. The parameters of the sensor are: PL = 8 mm, PW = 10 mm, QL = 8 mm, QW = 10 mm, L = 15 mm, W = 15 mm, RX = 10 mm. The U-shape patch sensor was designed to
reduce the overall size of MPA structure for dual frequency. The sensor geometry is derived in 6 steps as shown in Figure 3.
Figure 1. Schematic view of U-shape patch sensor.
Figure 2. Fabricated of U-shape patch sensor.
3. RESULT AND DISCUSSIONS
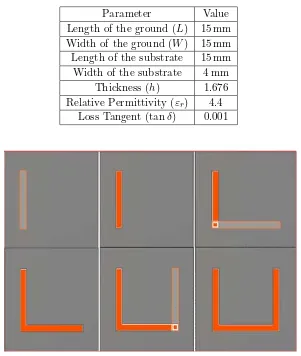
Table 1. CST optimized U-shape patch sensor parameters (mm).
Parameter Value
Length of the ground (L) 15 mm Width of the ground (W) 15 mm Length of the substrate 15 mm Width of the substrate 4 mm
Thickness (h) 1.676 Relative Permittivity (εr) 4.4
Loss Tangent (tanδ) 0.001
Figure 3. Design steps of proposed U-shape patch sensor.
Figure 5. Reflection coefficient measurement of the different MC of rice.
Figure 6. Reflection coefficient of dry and wet rice of U-shape patch sensor.
to 6.7 GHz at 6.8 GHz. It can be said that the resonant frequencies of simulation and measurement criteria are almost same at 5.2 GHz and 6.8 GHz. The VSWRs were found 1.13 at 5.2 GHz and 1.28 at 6.8 GHz maintaining the VSWR (VSWR≤2).
Figure 7. Relationship between the reflection coefficient with frequency for different percentages MC of U-shape patch sensor.
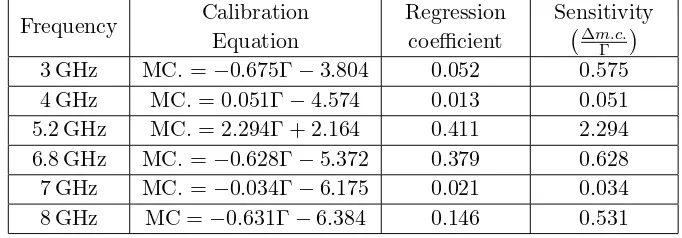
Table 2. Development of calibration equation for determination of MC at 3 GHz to 8 GHz.
Frequency Calibration Equation
Regression coefficient
Sensitivity Δm.c.
Γ
3 GHz MC.=−0.675Γ−3.804 0.052 0.575 4 GHz MC.= 0.051Γ−4.574 0.013 0.051 5.2 GHz MC.= 2.294Γ + 2.164 0.411 2.294 6.8 GHz MC.=−0.628Γ−5.372 0.379 0.628 7 GHz MC.=−0.034Γ−6.175 0.021 0.034 8 GHz MC =−0.631Γ−6.384 0.146 0.531
Where Γ = Reflection coefficient.
and −16.86 dB, respectively, while for wet rice, reflection coefficients were −12.07 dB at 5.2 GHz and
−10.88 dB at 6.8 GHz. Hence, it can be said that reflection coefficient decreased or had the least value for dry rice, but when rice was wet its value was increased, shown in Figure 6. The significance of Figures 6 and 7 is that if there is any little moisture present, then reflection coefficient varies significantly. Hence, there will be low probability of error (as at 5.2 GHz for dry it was −28 dB, but reflection coefficient value becomes high even at 10.71% moisture content).
also taken into account. The regression coefficient and sensitivity were obtained as 0.052 and 0.575 at 3 GHz, 0.013 and 0.051 at 4 GHz, 0.411 and 2.294 at 5.2 GHz, 0.379 and 0.628 at 6.8 GHz, 0.021 and 0.034 at 7 GHz, 0.146 and 0.531 at 8 GHz, respectively. The highest regression coefficient and sensitivity were 0.411 and 2.294 at 5.2 GHz, and 0.379 and 0.628 at 6.8 GHz. Hence, PMC can be determined at dual frequencies (5.2 GHz and 6.8 GHz). The five samples considered to determine the PMC with the help of VNA are shown in Figure 7. The relationship between reflection coefficient and frequency was established to measure different samples for MC of rice (in percentages), then the reflection coefficients are−12.94 dB,−9.76 dB,−8.77 dB,−5.64 dB,−3.93 dB at 5.2 GHz and−10.34 dB,−7.95 dB,−5.65 dB,
−3.53 dB, −1.14 dB at 6.8 GHz, when MC was 10.71%, 14%, 16.66%, 19.35%, 21.87%, respectively. When measurement of samples was done in free space, reflection coefficient was formed as −30.52 dB at 5.2 GHz and −20.75 at 6.8 GHz. It is clear that when the MC is increased, the reflection coefficient also increases and vice versa.
The dual frequencies are operated by the U-shape patch sensor, to find the predicted moisture content with the help of average method prediction. This method is easy and improves accuracy at dual, triple or more frequencies. Here, MC1 is used for 5.2 GHz and MC2 used for 6.8 GHz. From Table 2, the two equations are found for 5.2 GHz and 6.8 GHz as given below
MC = MC1+ MC2 2
MC1 = 2.294Γ + 2.164 (for 5.2 GHz) MC2 = −0.628Γ−5.372 (for 6.8 GHz)
An actual MC was determined with the help of standard oven drying technique (ODT). An actual moisture content (AMC) of grains was calculated in percentage using the relevant relationship,
MC(%) = mwet−mdry mwet
wheremwet and mdry are the masses of grains before and after being dried, respectively.
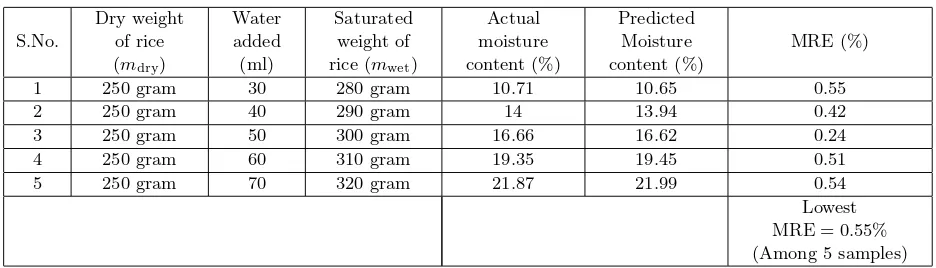
Only five values of moisture content were obtained because generally in government departments the samples of grains taken for checking moisture content vary from 3 to 5. Table 3 shows the calculated values of moisture content and MRE for 5 samples. Generally, grains affect when moisture content presence in grains is more than 8%. So by study and observation, we start by adding 30 ml water.
Table 3. Calculation of MRE.
S.No.
Dry weight of rice (mdry)
Water added (ml)
Saturated weight of rice (mwet)
Actual moisture content (%) Predicted Moisture content (%) MRE (%)
1 250 gram 30 280 gram 10.71 10.65 0.55
2 250 gram 40 290 gram 14 13.94 0.42
3 250 gram 50 300 gram 16.66 16.62 0.24
4 250 gram 60 310 gram 19.35 19.45 0.51
5 250 gram 70 320 gram 21.87 21.99 0.54
Lowest MRE = 0.55% (Among 5 samples)
Each sample was dried in microwave oven dried weight (MODW) at 10◦C for 3–5 minutes. Weight of samples (dry and wet rice) was taken from digital weighing machine, in grams, whose value was used to calculate actual moisture content (AMC).
MC(%) = mwet−mdry mwet
wheremwet andmdryare the mass of grains before dried and after dried, respectively. The lowest mean relative error (MRE) is determined between PMC and AMC by the given formula,
MRE =MCActual−MCP redicted MCActual
Figure 8. Predicted MC against actual MC of U-shape patch sensor.
The lowest mean relative error was 0.0055, and it is clear that the value of MRE 0.55% error was obtained between PMC and AMC. The variation between AMC and PMC, shown in figure 8, was found to be linear, and the formed equation is given below
Y = 0.996X whereY = predicted value of MC. X= actual value of MC.
The comparison of existing moisture sensor with the proposed design is shown in Table 4. The proposed design produces better regression coefficient, moisture content, sensitivity, lower cost, less time consuming, better accuracy and compactness than the considered references. Ref. [26] proposed a microstrip ring sensor at dual frequencies (4.36 MHz and 10.69 MHz) with outer radius 17.96 mm and inner radius 8.92 mm. The sensor was fabricated on RT-Duroid 5880 (expensive). It developed the calibration equation to measure the MC of samples and found the MC range from 10%–28%. The MRE was found 0.85 at operated microwave frequency. In this design, a novel U-shape moisture sensor was fabricated on FR-4 (low cost) with compact size (15×15 mm2) at operated microwave frequencies 5.2 GHz and 6.8 GHz. The MC range varies from 10.71% to 21.87% for detecting the MC of samples, reducing the MRE value compared to previously proposed design and was found 0.55%. It can be said that the proposed design is better than other designs at dual frequencies because of its easy technique, low cost and small size of the sensor.
Table 4. Comparison of proposed work with previously designed sensors.
References Size of sensor Operating
frequency Material
Cost
of sensor R
2 Moisture
Content (%)
MRE (%)
26 Ro×RI
= 17.96 mm×8.92 mm
4.36 MHz & 10.69 MHz
RT-Duroid
5880 Expensive
0.9705
& 0.9383 10%–28% 0.85 Proposed
sensor 15×15 mm
2 5.2 GHz
& 6.8 GHz FR4 Low
0.411
& 0.379 10.71%–21.87% 0.55
Ref. [26] designed the sensor at operated frequency 4.36 GHz and 10.69 GHz, fabricated on RT Duroid 5880 (expensive) with the outer radius and inner radius (Ro×RI = 17.96 mm×8.92 mm). The regression coefficient was obtained as 0.9705 and 0.9383 at frequency (4.36 GHz and 10.69 GHz). The moisture content was found varied from 10% to 28% with MRE 0.85.
It is clear that the proposed design is better than other designs (see Table 4) because of compact size, low cost and reduced MRE 0.55%.
4. CONCLUSION
A U-shape moisture sensor is proposed based on MPA (microstrip patch antenna) for detecting the moisture content of rice. The sensor has a small size of 15×15 mm2. The calibration equations were developed at dual frequencies (5.2 GHz and 6.8 GHz) with regression coefficients and sensitivity 0.411 and 2.294 at 5.2 GHz and 0.379 and 0.628 at 6.8 GHz, respectively. The MC range varies from 10.71% to 21.87% at operated dual frequencies, The MRE was 0.55% between PMC and AMC, which clearly shows that this MRE is much lower than existing sensors’ MRE (Ref. [26]). The experiment measurements show that the reflection coefficients increase with the increment of MC of samples. The proposed microstrip moisture sensor (MMS) with dual frequencies can have applications in various fields such as agriculture, geotech engineering and industries such as textile.
REFERENCES
1. Troughton, P., “High Q-factor resonator in microstrip,”Electron Lett., Vol. 4, 520–522, 1968. 2. Troughton, P., “Measurement techniques in microstrip,”Electron Lett., Vol. 5, 25–26, 1969. 3. Wolff, I. and N. Koppik, “Microstrip ring resonator and dispersion measurement on microstrip
lines,”Electron Lett., Vol. 7, 779–781, 1971.
4. Edwards, C., “Microstrip measurements,” IEEE MTT-S Int. Microwave Symp. Digest, 338–341, 1982.
5. Bernard, P. A. and J. M. Gautray, “Measurement of dielectric constant using a microstrip ring resonator,” IEEE Trans. Microwave Theory Tech., Vol. 39, 592–595, 1991.
6. Stephenson, I. M. and B. Ester, “Resonant techniques for establishing the equivalent circuits of small discontinuities in microstrip,”Electron Lett., Vol. 7, 582–584, 1971.
7. Hoefer, W. J. R. and A. Chattopadhyay, “Evaluation of the equivalent circuit parameters of microstrip discontinuities through perturbation of a resonant ring,”IEEE Trans. Microwave Theory Tech., Vol. 23, 1067–1071, 1975.
8. Farrar, A. and A. T. Adams, “Computation of lumped microstrip capacities by matrix methods — Rectangular sections and end effects,”IEEE Trans. Microwave Theory Tech., Vol. 19, 495–496, 1971.
9. Napoli, L. S. and J. J. Hughes, “Foreshortening of microstrip open circuits on alumina substrates,”
IEEE Trans. Microwave Theory Tech., Vol. 19, 559–561, 1971.
10. James, D. S. and S. H. Tse, “Microstrip end effects,”Electron Lett., Vol. 8, 46–47, 1972.
11. Denlinger, E. J., “Losses of microstrip lines,” IEEE Trans. Microwave Theory Tech., Vol. 28, 513– 522, 1980.
12. Katehi, P. B. and N. Alexopoulos, “Frequency-dependent characteristics of microstrip discontinuities in millimeter-wave integrated circuits,” IEEE Trans. Microwave Theory Tech., Vol. 33, 1029–1035, 1985.
13. Jackson, R. W. and D. M. Pozar, “Full-wave analysis of microstrip openend and gap discontinuities,” IEEE Trans. Microwave Theory Tech., Vol. 33, 1036–1042, 1985.
14. Owens, R. P., “Curvature effect in microstrip ring resonator,” Electron Lett., Vol. 12, 356–357, 1976.
15. Kim, K.-B., J.-H. Kim, S. S. Lee, and S. H. Noh, “Measurement of grain moisture content using microwave attenuation at 10.5 GHz and moisture density,”IEEE Transactions on Instrumentation and Measurement, Vol. 51, No. 1, 72–77, 2002.
17. Abbas, Z., R. Mokhtar, K. Khalid, M. Hashim, and S. A. Aziz, “RDWG technique of determination of moisture content in oil palm fruits,”Eur. Phys. J. Appl. Phys., Vol. 40, No. 2, 207–210, 2007. 18. Khalid, K., “The application of microstrip sensors for determination of moisture content in Hevea
rubber latex,”J. Microwave Power Electromagn Energy, Vol. 23, No. 1, 45–51, 1988.
19. Ghretli, M. M., K. Khalid, I. V. Grozescu, M. H. Sahri, and Z. Abbas, “Dual frequency microwave moisture sensor based on circular microstrip antenna,”IEEE Sen. J., Vol. 7, 1749–1756, 2007. 20. Gadani, D., V. Rana, S. Bhatnagar, A. Prajapati, and A. Vyas, “Effect of salinity on the dielectric
properties of water,”Indian J. Pure. Appl. Phys., Vol. 50, 405–410, 2012.
21. Deffendol, C. and C. Furse, “Microstrip antennas for dielectric property measurement,” Antennas and Propagation Society International Symposium, 1954–1956, IEEE, Orlando, FL, 1999.
22. Jilani, M. T., W. P. Wen, M. A. Zakaniya, L. Y. Cheong, and M. Z. U. Rehman, “An improved design of microwave biosensor for measurement of tissue moisture,”IEEE, 2014.
23. Joshi, K. K., M. Abegaonkar, R. N. Karekar, and R. C. Aiyer, “Microstrip ring resonator as a moisture sensor for wheat grains,” IEEE, 1679–1682, 1997.
24. Solanki, L. S., S. Singh, and N. Garg, “Determination of soil suitability for agriculture farming using microwave analysis,” IEEE, 421–426, 2017.
25. Kim, K. B., J. H. Kim, S. S. Lee, and S. H. Noh, “Measurement of grain moisture content using microwave attenuation at 10.5 GHz and moisture density,” IEEE Trans. Instrum. Meas., Vol. 51, 72–77, 2002, DOI: 10.1109/19.989904.