Impact of MGNREGA-A case Study of Baramulla District.
Ummar Ahad1
1 parray.umar@gmail.com
Govt. College for Women, M.A. Road, Srinagar.
Abstract- MGNREGA is afortune changing scheme providing guaranteed employment to rural people of India. The basic aim of Mahatma Gandhi National Rural Employment Guarantee Act is to ensure and enhance basic livelihood security of rural households in at national level. This scheme assures employment to unskilled rural laborer for 100 days. With proper and just implementation such type of schemes may be an effective weapon to eradicate poverty. It also aims at transforming the rural areas by improving the economic conditions of the inhabitants. Rural economy is the back-bone of Indian economic development. Provision of employment to rural poor will certainly boost the economy. It increases demand for goods and services. In this article an effort has been made to analyze the socio-economic impact of MGNREGA scheme on the life of beneficiaries of Baramulla district. The findings of the study revealed that the programme has brought the change in the lives of the beneficiaries to great extent. Though it is always a debatable issue that whether such changes, by MGNREGA are sustainable or temporary.
Key Words: - Employment Act,
Beneficiaries,Persondays, Gram Panchayat.
INTRODUCTION
Mahatma Gandhi National Rural Employment Guarantee Act (MGNREGA) is the flagship programme of the CentralGovernment that directly influences the lives of the rural poor. The act was enacted on 25th August, 2005 and it came in to force on 2nd February, 2006. MGNREGA is the Scheme which can definitely improve the economic and social condition of beneficiaries if implemented judiciously. For last several decades rural Indiahas been suffering from poverty, lack
of quality health services, insufficient and irrelevant infrastructure and inadequate facilities of education.
MGNREGA marked anarchetype shift from the other employment programmes with its target based approach. Govt. is legally accountable for providing employment of 100 days to those who demand it. This programme not only provides employment but also focuses on inclusive growth, as it conserves natural resources and creates sustainable assets. By safeguarding the environment and reducing rural-urban migration this programme has transformed the face of the rural India. MGNREGA also marked its footprints in Jammu and Kashmir also. TheBaramulla district is no exception. This district is mostly a hilly region and agricultureis practiced on large scale. So most of the villagers have no job when there is no agricultural work. Searching for short period job in villages is very difficult and therefore, many times they earn nothing. Thus, during this period MGNREGA is blessing for them.
OBJECTIVE
study examines the earning level of each house hold and expenditure pattern on food and nonfood items. In this study effort was also made to find out views and feedback of the beneficiaries about the programme.
METHODOLOGY
There are 367gram panchayats and 732 villages in Baramulla district. For the field survey we have purposively selected Baramulla district and all the 26 blocks of the district. From each block two panchayats were selected .The criteria for selection of Gram panchayat was one headquarter Gram Panchayat and the other one was far away from the headquarter. Thus total 50 Gram
panchayats were selected by using purposive sampling method; from each gram panchayat 2 villages were randomly selected for the study. After the selection of the villages the list of jobcard holders of MGNREGA household was obtained from gram panchayat and 2NREGA jobcard holders were randomly selected. Thus the sample size comprising of 200 NREGA beneficiaries was collected. Mainly the research is based on descriptive method. Basic statistical tools have been used to analyze and examine the facts and information collected from the field survey.
Table1 Details of Panchayats and Villages InBaramulla District
Blocks No. of Panchayats No of Villages
Baramulla 18 32
Bijhama 8 17
Boniyar 11 26
Chnadilwanigam 6 16
hardaboora 1 19
Kangroosa 6 20
khiapora 5 21
Khoresherabad 13 23
Kunzer 10 23
Lalpora 9 23
Nadihal 14 27
Narwav 16 30
Noorkhah 9 20
Parenpilan 13 16
Pattan 31 55
Rafiabad 16 36
Rohama 19 33
Sangrama 14 25
Singhpora 16 31
Sopore 9 9
Tangmarg 18 51
Tujarsharif 18 30
Uri 20 31
Wailoo 8 20
Zaingeer 20 29
Total 367 732
Study Area
Baramulla district is one of the 22 districts of J&K. Baramulla town is district and administrative headquarter of this district. The district covered an area of 4190 km2 in 2001 census but it was reduced to 3353km2 at the time of 2011 census, owing to readjustment of district boundaries. The district is situated at 34.190 N longitude and 74.360 E latitude. It comprises of 542 villages. The main town is located on the either banks of river Jehlum, about 55 kms away from summer capital Srinagar. Baramulla has an average elevation of 1593 meters. Baramulla
district is the largest district in the entire valley both with reference to area and population. The district is bounded by Srinagar and Ganderbal districts in the east and by Kupwara in the north and Bandipora in the north-east to pooch in the south and Budgam in the southwest. Baramula district has a distinction of having geographical diversity as it has in its jurisdiction, sub-temperate/Sub-tropical areas apart from vast area falling under temperate zone. It has a severe cold climate in winter and a pleasant weather in summer. Almost all parts of the district receive good snowfall in winter season.
As per 2011 census, Baramulla district has a population of 1,008,039. Of the total population 534,733 (53.05%) were males and 473,306 (46.95) were females. The sex ratio being 885
population growth rate over the decade 2001-2011 was 20.34%. Baramulla has a literacy rate
of 66.93% with male literacy 77.35% and female literacy 55.01%.
Table 2:- Socio-Economic Profile of Baramulla District.
Population Persons 1008039
Males 534733
Females 473306
Literacy Persons 545,149
Males 337,170
Females 207,979
Scheduled caste Persons 1 ,476
Males 1 ,451
Females 25
Scheduled tribes Persons 37705
Males 20237
Females 17468
Worker & Non Workers Persons 304200
Males 249581
Females 54619
Main Workers Persons 187959
Males 169496
Females 18463
Marginal Workers Persons 116241
Males 80085
Females 36156
Non- workers Persons 703839
Males 285152
Females 418687
Cultivators Persons 57495
Males 43142
Females 14352
Agri- Labourers Persons 62246
Males 53316
Females 8930
Workers in Household industry Persons 15084
Males 9095
Other workers Persons 169375
Males 144028
Females 25347
Source: - Census of India, 2011.
Basic Facilities:
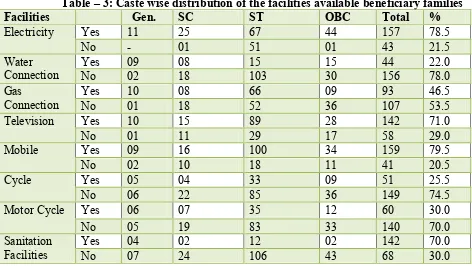
The study of the table-3 describes the basic facilities available in survey area. It includes electricity, drinking water. It also gathers facts about television and toilet facilities available to surveyed households. The use of cycle, motorcycle and mobile is very common in survey area.
If we examine the study reveals that 88.5% have electricity connection at their home. The condition of drinking water connection needs to be improved, only 78% household have reported that they have this facility at their home, only
83% families have gas connection in their kitchen. It is interesting to note that less than 30% tribal families have gas and less than 13% tribal families have drinking water connection. Though the electricity facilities show good signs but as per the tribal people almost44% lack electricity facility. Less than 87% of tribal population is having access to poratable water.Lack of appropriate Sanitation is a major concern for the people of upper reaches of Baramula .The basic toilet and sanitation facilities are available to only 71% of households. Therefore "Swach Bharat Abhiyan" has a role to play in survey area.
Table – 3: Caste wise distribution of the facilities available beneficiary families
Facilities Gen. SC ST OBC Total %
Electricity Yes 11 25 67 44 157 78.5
No - 01 51 01 43 21.5
Water Connection
Yes 09 08 15 15 44 22.0
No 02 18 103 30 156 78.0
Gas
Connection Yes No 10 01 08 18 66 52 09 36 93 107 46.5 53.5
Television Yes 10 15 89 28 142 71.0
No 01 11 29 17 58 29.0
Mobile Yes 09 16 100 34 159 79.5
No 02 10 18 11 41 20.5
Cycle Yes 05 04 33 09 51 25.5
No 06 22 85 36 149 74.5
Motor Cycle Yes 06 07 35 12 60 30.0
No 05 19 83 33 140 70.0
Sanitation Facilities
Yes 04 02 12 02 142 70.0
No 07 24 106 43 68 30.0
The above data reveals that there are still lots of areas where the improvements are to be induced in order to bring the positive changes. The careful analyses depicts that scheduled tribe population is
basis so as to ensure their socio-economic upliftment and consequently safeguarding the
environment also.
Table 4:- Sectoral Breakup under MGNREGA, District Baramulla
Work / Activities Works Completed On Going Works Total
Unit Cu. Mtrs .
Exp. Unit Cu. Mtrs.
Exp. Physical Financi al
1 Water Conservation & Water Harvesting
42 0 26.30 61 0 1.66 103 27.96
2 Drought Proofing 16 0 10.03 12 0 1.15 28 11.18
3 Micro Irrigation Works
304 0 317.3 222 0 137.9 526 455.34
4 Provision of
Irrigation Facility of land owner
603 0 468.3 440 0 89.15 1043 557.48
5 Renovation of
traditional Water Bodies
47 0 37.93 47 0 1.45 94 39.38
6 Land Development 187 0 133.6 121 0 31.09 308 164.70
7 Flood Control & Protection
774 0 576.4 293 0 53.62 1067 630.02
8 Rural Connectivity 1780 0 1256.2 1439 0 156.2 3219 1412.4
7
9 ApnaPanchayatGhar 78 0 0.00 64 0 108.4 142 108.41
10 Play field 6 0 11.31 23 0 8.67 29 19.98
11 Vermi compost 0 0 0.00 1 0 0.00 1 0.00
12 IAY 0 0 0.00 13 0 0.00 13 0.00
13 AWC 0 0 0.00 2 0 0.25 2 0.25
15 Individual House Hold Latrines (SBM)
0 0 165.8 0 0 0.00 0 165.86
16 Recurring / Non Recurring
0 0 365.8 0 0 0.00 0 365.89
17 Any other activity approved by MRD.
49 0 44.97 17 0 1.64 2 46.61
Table 5:- Socio-Economic Background of Beneficiaries: NREGA statistics Baramulla
Employment provided to households 0.50038 lakhs
Persondays (in lakhs)
Total 28.57
Scs 0.06(0.2%)
Sts 0.73(2.54%)
Women 3.48(12.18%)
others 27.79(97.26%)
Total works taken up 10932
Works completed 1066
Works in progress 9866
Impact on Migration:
One of the important objectives of MGNREGA is a significant reduction in migration of unskilled labour force from the rural villages to urban cities through its provision of hundred days of guaranteed wage employment. The survey has also gathered facts about various facts of migration in the selected villages of Baramulla district. Important features regarding migration of the surveyed area are as follows-
Out of 200 households, only 14.5% reported that they migrated for their livelihood.
No migration was observed in 12 Gram Panchayats.
Among the migrated beneficiaries 47% had migrated to Srinagar.
Study shows that 83% of the migrants were male.
79% of migrants have reported that they lived at migrated places not more than six months period, though they prefer to come back frequently to their native villages.
The 82% of migrants are married, 66% are educated and 74% fall under the age group of 25 to 49 years.
S . N o
Name of the Block Appr oved Labo ur Budg et 2016 -17 O. B. as on 01 -04 -16 Release during current year Mis c. rec eip t Total Availa bility Cumulative Expenditure Exp. Out of On Wages unski lledn On sem i-ski lle d and ski lle d wag es On Mate rial Administrat ive Expenses on wag es sal ary Tot al Cen tre Sta te Wa ge s Recu rrin g Non Recu rrin g Sta te Sha re Cen ter Sha re 1 Baramul la 204. 4 0. 35 167 .5 24.
49 0
1.0 8 193.42 9 88.97 0 20. 69 62.9 30 20.6 20 0.12 0 0.0 0 193 .3 24. 49 168 .4 2 Bijiham a 183. 1 0. 11 180 .0 12.
29 0
0.3 42 192.74 5 115.1 20 34. 51 31.1 90 11.4 30 0.42 0 0.0 0 192 .6 12. 29 180 .3
3 Boniyar 172. 1 0. 21 177 .5 16.
9 0
0.0 92 194.70 2 143.9 50 19. 71 19.9 40 11.0 50 0.00 0 0.0 0 194 .6 16. 85 177 .8 4 Chandil Wanigam 81.2 2 0. 90 33. 00 8.0
0 0
0.0 37
41.937 22.73 0 2.5 80 9.66 0 6.83 0 0.00 0 0.0 0 41. 80 7.9 80 33. 82 5 Hardabo ora 128. 7 0. 29 57. 00 14.
42 0
0.0 71
71.786 38.03 0 2.3 68 24.0 14 6.79 0 0.58 4 0.0 0 71. 78 14. 42 57. 36 6 KandiRa
fiabad 63.9
0. 85
60. 00
8.5
0 0 0
69.351 29.30 0 7.7 70 26.7 50 5.48 0 0.00 0 0.0 0 69. 30 8.5 00 60. 80 7 Khaipor
a 77.6
0. 50
43. 50
6.9
0 0
0.1 5
51.058 24.29 0 2.2 40 17.1 70 6.76 5 0.00 0 0.0 0 50. 46 6.8 90 43. 57
8 Kunzer
126. 0 0. 71 65. 00 13.
28 0
0.1 78
79.171 43.80 1 2.5 71 23.6 42 8.60 5 0.52 7 0.0 0 79. 14 13. 28 65. 86
9 Lalpora 115. 7 0. 97 60. 50 12.
24 0 0
73.711 29.83 8 5.7 75 29.8 88 8.13 0 0.00 0 0.0 0 73. 63 12. 24 61. 39 1
0 Nadihal 171. 0 0. 51 100 .0 19.
15 0
0.1 44 119.81 1 57.42 0 9.9 80 38.1 60 14.2 40 0.00 0 0.0 0 119 .8 19. 15 100 .6 1
1 Narwav
199. 6 0. 15 196 .0 22.
06 0
0.3 68 218.58 7 111.2 30 17. 89 76.4 10 13.0 00 0.00 0 0.0 0 218 .5 22. 06 196 .4 1 2 Noorkha h 183. 9 0. 27 204 .0 13.
83 0
0.4 6 218.56 6 118.5 40 38. 32 52.5 00 9.12 2 0.00 0 0.0 0 218 .4 13. 83 204 .6 1 3 Paranpi llian 241.
1 0
216 .0
19.
98 0
0.4 44 236.42 4 131.5 50 54. 30 33.3 80 17.1 94 0.00 0 0.0 0 236 .4 19. 98 216 .4 1
4 Pattan
347. 6 0. 27 205 .0 41.
58 0 0
246.85 5 125.6 80 5.5 90 85.8 16 29.7 50 0.00 0 0.0 0 246 .8 41. 58 205 .2 1 5 Rafiaba d 199. 1 0. 33 95. 00 21.
33 0 0
116.66 3 54.02 0 10. 42 36.3 00 14.7 10 1.06 0 0.0 0 116 .5 21. 33 95. 18 1
6 Rohama
235. 7 0. 05 117 .0 24.
58 0 0
141.63 6 82.56 6 5.8 40 36.4 20 16.6 70 0.00 0 0.0 0 141 .4 24. 55 116 .9 1 7 Sangram a 181. 7 0. 04 122 .5 19.
17 0 0
141.71 3 63.32 5 3.6 80 59.7 10 13.3 60 1.53 0 0.0 0 141 .6 19. 16 122 .4 1 8 Sheraba dKhore 169. 3 0. 07 138 .0 17.
59 0
0.1 27
155.79 90.91 5 3.7 44 49.8 40 9.27 0 1.96 0 0.0 0 155 .7 17. 59 138 .1 1 9 Singhpo ra 319. 1 0. 73 297 .0 21.
83 0 0
319.56 3 185.3 40 18. 67 95.4 80 19.5 60 0.45 0 0.0 0 319 .5 21. 83 297 .6 2
0 Sopore
120. 5 0. 35 51. 50 12.
25 0
0.0 46
2 1 Tangmar g 278. 6 0. 24 161 .0 24.
49 0 0
185.73 2 96.62 0 7.7 40 66.7 70 13.4 02 1.20 0 0.0 0 185 .7 24. 49 161 .2 2 2 TujjerS harief 232. 5 0. 21 107 .5 24.
49 0
0.3 36 132.54 2 69.23 0 8.7 50 41.4 10 12.5
91 0.42
0.0 0 132 .4 24. 49 107 .9 2
3 Uri
326. 0 0. 26 185 .0 30.
74 0
0.3 24 216.32 7 99.94 0 38. 21 61.4 90 16.0 00 0.64 0 0.0 0 216 .2 30. 74 185 .5 2
4 Wagoora 321. 6 0. 06 227 .2 36.
95 0 0
264.26 1 135.8 00 14. 22 93.9 70 19.8 50 0.42 0 0.0 0 264 .2 36. 95 227 .3 2
5 Wailoo
113.
6 0
52. 50
10.
66 0
0.0 72
63.232 33.12 0 2.8 20 19.0 00 8.29 0 0.00 0 0.0 0 63. 23 10. 66 52. 5 2 6 Zaingee r 248. 2 0. 07 141 .0 26.
58 0
0.2 48 167.84 4 107.7 40 9.4 80 29.5 20 19.9 60 1.14 0 0.0 0 167 .8 26. 58 141 .2 2
7 DPO 0.00
0. 03
0.0 0
0
0 0
0.035 0.000 0.0 00 0.00 0 0.00 0 0.00 0 0.0 0 0.0 00 0.0 00 0.0 0 2 8 EXEN
BLA 0.00
0. 53 0.7 0 0 0 0.0 15
1.252 0.000 0.0 00 0.00 0 0.00 0 0.94 3 0.0 0 0.9 43 0.0 00 0.9 43 2
9 ACD 0.00
6. 70 29. 05 0 0 0.7 65 36.519
0.000 0.000 0.000 0.000 62 13.7 22.08 35.84 0.000 35.84
5042.89 15
.8 349 0.0 504 .28 0. 00 5.3 0 4015.3 93 2126. 115 349 .07 1142 .3 340. 741 25.1 76 22. 085 400 5.5 504 .17 350 0.9
The study reveals MGNREGA has been successful in increasing the income by providing wage employment to rural households in Baramulla district. 51% households, who reported yearly income up to 25000, have admitted that MGNREGA jobs have contributed somewhat from 5000 to 10000 in theyearly income of their family. Similarly 8% of the total households reported that yearly income from MGNREGA has been more than 10000 and only 29% respondents have shown yearly contribution from the scheme upto 5000. It is important to note that 97.5% household reported that this programme has definitely remained beneficial to support in adding their yearly income.The picture of yearly income of 200 MGNREGA
beneficiaries is not attractive. 86% beneficiaries have reported that their annual income was up to 25000 and only 11.5% have reported their annual income more than 25000. This depiction shows that among this sample mass is earning bellow 25000. With this yearly income, contribution of MGNREGA income is very good. Out of 200 households, 29% have reported that the contribution of MGNREGA in their total yearly income was up to 5000 whereas 60.5% have up to 5000 to 10000 and only 8% of households reported that the contribution of MGNREGA income was more than 10000 in their annual income.Main source of earning is agriculture and labour work in survey area.
Table 7:- Share of MGNREGA Income in Annual Income :
Income yearly from MGNREGA Upto 25000 More than 25000
0-5k 55 03
5K-10K 102 19
Not responded 05 -
Total 177 23
Source:- Survey Report.
Table 8:- Employment Generation under NREGA Part I for the month of 3/2017
S.No Block Cuml. No. of household issued job
card (till reporting month) Cuml. No. of Household who have demanded wage employment (till
reporting month)
Cuml. No. of
households provided employme nt (till the reporting month)
No. of house-holds working under NREGA during the reportin g month
SCs STs Others Total
1 Baramulla 0 104 3670 3774 1715 1715 1527
2 Bijihama 0 168 2881 3049 1659 1659 1591
3 Boniyar 0 295 2599 2894 1830 1830 1782
4 ChandilWanigam 0 183 1298 1481 464 464 389
5 Hardaboora 0 3 2305 2308 1077 1077 915
6 KandiRafiabad 0 1 1105 1106 471 471 443
7 Khaipora 0 0 1439 1439 549 549 487
8 Kunzer 0 2 2234 2236 1285 1285 1159
9 Lalpora 0 9 2099 2108 930 930 831
10 Nadihal 0 11 3076 3087 1387 1387 1162
11 Narwav 0 88 3462 3550 2072 2072 1798
12 Noorkhah 0 243 2586 2829 1796 1796 1673
13 Paranpillian 0 318 3315 3633 2083 2083 1985
14 Pattan 0 0 6154 6154 2908 2908 2553
15 Rafiabad 0 0 3378 3378 1338 1338 1103
16 Rohama 0 2 4199 4201 1444 1444 1205
17 Sangrama 0 1 3001 3002 1646 1646 1277
18 SherabadKhore 0 2 2945 2947 1389 1389 1208
19 Singhpora 0 1 5595 5596 3208 3208 2803
20 Sopore 0 82 1763 1845 837 837 755
21 Tangmarg 0 5086 5086 1684 1684 1505
22 TujjerSharief 0 5 3775 3780 1926 1926 1727
23 Uri 0 602 4802 5404 2489 2489 2407
25 Wailoo 0 2 1658 1660 1003 1003 589
26 Zaingeer 0 0 3861 3861 2088 2088 1646
Total:- 0 2159 84216 86375 41807 41807 36712
Employment Generation under NREGA Part II 2017 Block Cuml. Person days generated (in lacs)
till the reporting month
Cuml. No. of
households completed 100 days of
employme nt (till the reporting month)
No. of
househol ds which are beneficia
ry of
land reforms / IAY
No. of
Disabled beneficiar ies
individual s
SC ST Others Total Women
Baramulla 0 797 66731 67528 3659 14 4 2
Bijihama 0 3346 57205 60551 8593 10 40 1
Boniyar 0 4034 73804 77838 14423 21 0 0
Wanigam 0 435 16843 17278 3684 3 7 0
Hardabora 0 24 28057 28081 3388 8 2 0
KRafiabad 0 62 15658 15720 5298 1 0 0
Khaipora 0 0 51641 51641 5978 17 2 0
Kunzer 0 116 45664 45780 2280 14 2 2
Lalpora 0 54 33898 33952 3334 30 4 3
Nadihal 0 460 40011 40471 4516 24 3 1
Narwav 0 1235 66377 67612 2401 7 0 1
Noorkhah 0 5380 54591 59971 7291 2 2 0
Paranpilian 0 9790 72570 82360 25539 48 0 1
Pattan 0 0 96471 96471 6713 24 4 2
Rafiabad 0 0 33298 33298 7432 4 4 0
Rohama 0 0 42013 42013 4916 8 0 0
Sangrama 0 0 43380 43380 2420 1 0 1
SherabadKh ore
0 0 21894 21894 3649 25 7 0
Singhpora 0 88 131133 131221 21662 54 7 0
Sopore 0 150 32648 32798 3340 13 1 1
Tangmarg 0 1806 61978 63784 12625 29 81 0
Uri 0 30 89938 89968 18851 39 1 1
Wagoora 0 9699 88153 97852 10512 79 2 5
Wailoo 0 837 21079 21916 2824 12 0 0
Zaingeer 0 0 50960 50960 3832 13 6 1
Total:- 0 38373 1399137 1437510 199212 503 179 22
CONCLUSION
Generally, when income of a family increases, it has a profound impact on the expenditure pattern. It is evident from the data that 79.5% respondents were having mobile sets and 30% were possessing motor-cycles. Similarly 71% households have T.V. sets and 88.5% have electricity connection in their dwelling units. This is a bright side of the story.
But the other side of the picture is not so good. The data reveal that 53.5% households do not have gas connection in their kitchen and 30% of our sample households have no toilet facility in their dwelling units. Thus, a long way has to go to improve the quality of life at village level because the absence of these basic amenities to the households ultimately adversely affected the health front of the families. During the survey it was also found that short duration and temporary migration among MGNREGA families was occurring though at low rates.The female members of these households preferred local migration only. Therefore the assured employment in rural areas could certainly reduce out-migration. MGNREGA can certainly check distress related migration from rural areas. Thus study observed that the wages received by female-worker at migrated place was not different from the minimum MGNREGA wage.
REFERENCES
1. Thomas Bigi and Bhatia Ruby (2012), Impact of NREGA Scheme: A Study on the overall quality of life of its Beneficiaries (A Study undertaken among beneficiaries of 3 districts of Gujarat State).
2. Bhargava K. Anil (2013), The Impact of India's Rural employment Guarantee on Demand for Labour Saving Technology, University of California.
3. Thomas Solinski, NREGA and Labour migration in India : Is village life what the 'rural' poor want ?
4. Shah Mihir, Shanker V. and Ambasta P. (2008). Two years of NREGA : The Road Ahead, Economic Political Weekly, Feb. 23.
5. All-India Report on Evaluation of NREGA A Survey of Twenty Districts, by Institute of Applied Manpower Research, (PEO), Planning Commission.
6. Census of India,2011.