Scholarship@Western
Scholarship@Western
Electronic Thesis and Dissertation Repository
3-29-2017 12:00 AM
That's not fair! Examining individual differences in perceptions of
That's not fair! Examining individual differences in perceptions of
fairness
fairness
Hayden Jerney Randolph Woodley The University of Western Ontario Supervisor
Dr. Natalie Allen
The University of Western Ontario Graduate Program in Psychology
A thesis submitted in partial fulfillment of the requirements for the degree in Doctor of Philosophy
© Hayden Jerney Randolph Woodley 2017
Follow this and additional works at: https://ir.lib.uwo.ca/etd
Part of the Industrial and Organizational Psychology Commons, and the Personality and Social Contexts Commons
Recommended Citation Recommended Citation
Woodley, Hayden Jerney Randolph, "That's not fair! Examining individual differences in perceptions of fairness" (2017). Electronic Thesis and Dissertation Repository. 4470.
https://ir.lib.uwo.ca/etd/4470
This Dissertation/Thesis is brought to you for free and open access by Scholarship@Western. It has been accepted for inclusion in Electronic Thesis and Dissertation Repository by an authorized administrator of
Electronic Thesis and Dissertation Repository
That’s not fair! Examining individual differences in
perceptions of equity
Hayden Jerney Randolph Woodley
Supervisor Dr. Natalie Allen
The University of Western Ontario
Graduate Program in Psychology
A thesis submitted in partial fulfillment of the requirements for the degree in Doctor of Philosophy © Hayden Jerney Randolph Woodley
Follow this and additional works at:http://ir.lib.uwo.ca/etd
Abstract
Within organizations, fairness is an important concept and has received considerable
research attention. Some research, interestingly, suggests that individuals differ in their
perceptions of equity. Building on this research, four empirical studies were conducted to
develop a measure of a new construct (i.e., equity orientation) and examine its predictive
validity. In Study 1 (N = 836) and Study 2 (N = 600), the Equity Orientation Scale (EOS)
was created and its relations with two popular personality models – the HEXACO and the
Dark Tetrad – were examined across self- and peer-ratings. In Study 3 (N = 433) and
Study 4 (N = 490), the EOS was measured in a team setting and predicted individuals’
task and contextual performance. Further, Study 4 examined social loafing as a mediating
mechanism between the EOS and the performance-related behaviours with full and
partial mediations being found. Conclusions and future research directions are discussed.
Keywords: equity theory, equity orientation, teams, HEXACO, Dark Tetrad, task
Acknowledgements
There are so many amazing people who have helped get me to this wonderful
point in my life. First, I would like to express my sincere gratitude to my supervisor,
Professor Natalie Allen. Thank you for always making time to provide me with guidance,
encouragement, perspective and support. I truly believe I could not have had a better
supervisor. To my examination committee members – Professors Goffin, Rothstein,
Finegan, Olivera and Son Hing – thank you for taking the time to carefully review my
dissertation and for all great questions and advice.
To my colleagues and friends in I-O, who have consistently supported and
assisted me throughout our time together, no matter the distance between us – especially
Rima Tarraf, Kevin Doyle and Nick Bremner. I would like to thank all of the Teamwork
Lab members who have helped with collecting the data used in my dissertation and for
listening and providing feedback while I was developing my theory. In addition, I want to
thank Matt McLarnon for all his time and energy helping answer my persistent statistical
questions as both an expert and a friend. I could have not done this without your help and
I greatly appreciate it.
Too my friends and family, I want to thank you for supporting me as I pursued
my goals and aspirations. I especially would like to thank Kevin Wright, Marco Loberto,
Steve Thorpe and Shayla VanGreuningen for providing balance, hope and sanity to my
life. To my mother Shirley, my sisters Alayna and Shastyn, and my brother Devin, thank
you for providing me the steadfast support that has gotten me to this point in my life.
Table of Contents
Abstract ... I
Acknowledgements ... II
Table of Contents ... III
List of Tables ... V
List of Figures ... VII
List of Appendices ... VIII
CHAPTER 1: LITERATURE REVIEW ... 1
Equity Sensitivity ... 2
Measurement Issues ... 3
Theoretical Issues... 6
Equity Orientation ... 7
Input Orientation ... 9
Outcome Orientation ... 11
Equity Orientation Profiles ... 13
CHAPTER 2: MEASURE VALIDATION ... 16
Study 1 ... 16
The Big Five ... 16
Honesty-Humility ... 22
Dark Triad ... 23
Equity Orientation Profiles ... 25
Methods... 27
Results ... 32
Study 1 Discussion ... 47
Study 2 ... 54
The Dark Tetrad ... 55
Equity Orientation Profiles ... 56
Methods... 57
Results ... 58
Study 2 Discussion ... 83
Chapter 2 Discussion ... 87
CHAPTER 3: EQUITY ORIENTATION IN A TEAM ENVIRONMENT ... 96
Team Functioning Frameworks ... 97
Task Performance ... 99
Contextual Performance... 100
Counterproductive Behaviour ... 101
Equity Orientation Profiles ... 103
Methods... 103
Results ... 106
Study 3 Discussion ... 112
Study 4 ... 115
Social Loafing ... 116
Input Orientation ... 117
Outcome Orientation ... 117
Task Performance ... 118
Contextual Performance... 119
Counterproductive Behaviour ... 119
Mediation ... 120
Equity Orientation Profiles ... 121
Methods... 122
Results ... 125
Chapter 3 Discussion ... 143
CHAPTER 4: GENERAL DISCUSSION ... 149
Research Implications ... 149
Personality... 150
Teams ... 151
Organizational justice ... 153
Job interviews ... 154
Leadership ... 155
Romantic relationships... 156
Practical Implications... 156
Employee motivation ... 157
Recruitment and selection ... 157
Leading work teams ... 158
Limitations and Future Directions ... 159
List of Tables
Table 1. The original 32 Equity Orientation Scale items... 29
Table 2. Summary of the exploratory structural equation for modeling for the Equity Orientation Scale. ... 33
Table 3. Factor loadings for the final 12-item Equity Orientation Scale. ... 34
Table 4. Variable means, standard deviations, intercorrelations and Cronbach’s alphas for Study 1. ... 36
Table 5. Summary of multiple regression and relative importance analysis for input and outcome orientation on the Big Five and Honesty-Humility traits in Study 1. ... 38
Table 6. Summary of multiple regression and relative importance analysis for input and outcome orientation on the Dark Triad in Study 1. ... 39
Table 7. Summary of the latent profile analysis model fit indices for equity orientation in Study 1. ... 42
Table 8. Summary of the Wald Chi-Square Test of Mean Equality for the Big Five and Honesty-Humility traits across equity orientation profiles in Study 1. ... 45
Table 9. Summary of the Wald Chi-Square Test of Mean Equality for the Dark Triad traits across equity orientation profiles in Study 1... 46
Table 10. Summary of the confirmatory factor analyses for self- and peer-reported equity orientation for Study 2. ... 59
Table 11. Variable means, standard deviations, intercorrelations and Cronbach’s alphas for self- and peer-ratings of both equity orientation and the HEXACO traits in Study 2. 61
Table 12. Variable means, standard deviations, intercorrelations and Cronbach’s alphas for self- and peer-ratings of both equity orientation and the Dark Tetrad traits. ... 63
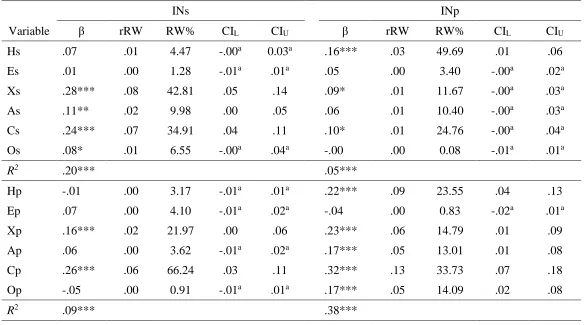
Table 13. Summary of the multiple regression and relative weight analyses for self- and peer-ratings of input orientation and the HEXACO traits in Study 2. ... 65
Table 14. Summary of the multiple regression and relative weight analyses for self- and peer-ratings of outcome orientation and the HEXACO traits in Study 2. ... 66
Table 15. Summary of the multiple regression and relative weight analyses for self- and peer-ratings of input orientation and the Dark Tetrad traits in Study 2. ... 68
Table 16. Summary of the multiple regression and relative weight analyses for self- and peer-ratings of outcome orientation and the Dark Tetrad traits in Study 2. ... 70
Table 17. Summary of the latent profile analysis model-fit indices for self- and peer-reported equity orientation in Study 2. ... 73
Table 18. Summary of the Wald Chi-Square Test of Mean Equality for the HEXACO traits across self-reported equity orientation profiles in Study 2. ... 77
Table 20. Summary of the Wald Chi-Square Test of Mean Equality for the Dark Triad traits across self-reported equity orientation profiles in Study 2. ... 81
Table 21. Summary of the Wald Chi-Square Test of Mean Equality for the Dark Triad traits across peer-reported equity orientation profiles in Study 2. ... 82
Table 22. Summary of the confirmatory factor analyses for Study 3 variables. ... 107
Table 23. Variable means, standard deviations, intercorrelations and Cronbach’s alphas for self-ratings of equity orientation and peer-ratings of performance-related behaviours in Study 3. ... 109
Table 24. Summary of the latent profile analysis model fit indices for equity orientation in Study 3. ... 110
Table 25. Summary of the Wald Chi-Square Test of Mean Equality for the peer-reported performance-related behaviours across self-reported equity orientation profiles in Study 3... 113
Table 26. Summary of the confirmatory factor analyses for Study 4 variables. ... 126
Table 27. Variable means, standard deviations, intercorrelations and Cronbach’s alphas for self-ratings of equity orientation and peer-ratings of social loafing and performance-related behaviours in Study 4. ... 128
Table 28. Summary of the mediated regression analyses for self-reported input
orientation, self-reported social loafing and self-reported performance-related behaviours. ... 131
Table 29. Summary of the mediated regression analyses for self-reported input orientation, peer-reported social loafing and peer-reported performance-related
behaviours. ... 133
Table 30. Summary of the latent profile analysis model fit indices for equity orientation in Study 4. ... 134
List of Figures
Figure 1. Proposed equity orientation profiles. ... 14
Figure 2. Equity orientation profiles in Study 1. ... 44
Figure 3. Self-reported equity orientation profiles in Study 2. ... 74
Figure 4. Peer-reported equity orientation profiles in Study 2. ... 75
Figure 5. Equity orientation profiles in Study 3. ... 111
Figure 6. Mediation model for input orientation on the self- and peer-reported performance-related behaviours through self- and peer-reported social loafing. ... 130
Figure 7. Equity orientation profiles in Study 4. ... 136
List of Appendices
Appendix A ... 196
Appendix B ... 197
Appendix C ... 203
Appendix D ... 204
Appendix E ... 211
Appendix F... 214
Appendix G ... 216
CHAPTER 1: LITERATURE REVIEW
In an attempt to improve our understanding of individuals’ perception of inequity
in social exchanges – more specifically, in organizations – Adams’ (1963; 1965)
proposed equity theory. Equity theory argues that individuals are motivated by a desire to
be treated fairly, or equitably, based on their perceptions of the social exchange of
resources (i.e., inputs for outcomes). When explicating this perception, Adams’ focused
on employees in an organization, arguing that an employee’s ratio of inputs (e.g.,
experience, education and effort) to outcomes (e.g., promotions, compensation and
recognitions) should be commensurate with that of comparison others (e.g., employees
with similar roles or job titles). This perceived equitable ratio has been termed the “norm
of equity” (Carrell & Dittrich, 1978; Hatfield, Walster, Walster & Berscheid, 1978).
Adams’ (1963; 1965) further argued – in line with Festinger’s (1962) cognitive
dissonance theory – that individuals would feel distress if the norm of equity is violated;
for example, when he or she is being under- or over-rewarded. To address the feeling of
dissonance that these inequitable situations create, Adams’ argued that individuals would
alter their behaviour (e.g., increase or decrease either their inputs or outcomes) in order to
adjust the ratio back to the perceived “norm”.
Although some researchers have found some support for equity theory’s norm
(e.g., Austin & Walster, 1975; Ross & McMillen, 1973), other researchers have not,
especially in situations of overpayment (Lane & Messé, 1972; Lawler, 1968). In addition,
an investigation by Huseman, Hatfield and Miles (1985) questioned whether individuals
adhere to the “norm of equity,” finding that some individuals prefer their input to
(1985) demonstrated that under identical conditions, individuals differ in their reactions
to inequity. Building on these findings, Huseman, Hatfield and Miles (1987) introduced a
new construct entitled “equity sensitivity,” which referred to how individuals perceived
equity in the workplace and developed a measure to assess it.
Equity Sensitivity
Introduced by Huseman et al. (1985; 1987), equity sensitivity was originally
proposed as an individual difference variable that measures – along a single continuum –
those who are more input oriented (i.e., benevolent) versus those who are more outcome
oriented (i.e., entitled). Individuals who score high on equity sensitivity are considered
benevolent, whereas those who score low on equity sensitivity are considered to be
entitled. Individuals who fall in the middle of the continuum are considered to be both
input and outcome oriented (i.e., equity sensitive). Benevolent individuals are considered
to be motivated by their desire to put forth effort and are therefore considered to be
‘givers’. Entitled individuals are considered to be motivated by their desire for outcomes
and are therefore considered to be ‘getters’. Equity sensitives, however, are individuals
who are motivated by both a desire to put forth effort and a desire for outcomes.
Huseman et al. (1987) theorized that equity sensitive individuals are more perceptive and
conscious of injustice and unfairness in social exchanges.
Equity sensitivity was presented as an individual difference variable that would
improve our understanding of behaviour in the workplace (Huseman et al., 1987). Thus,
the vast majority of research on the construct has been conducted in a work-related
context. For example, research by Kickul and Lester (2001) found that entitleds reported
were breached in regards to outcomes (e.g., rewards, benefits), whereas benevolents were
unaffected by breached outcomes. In addition, O’Neill and Mone (1998) found that when
self-efficacy is low, benevolents report having higher job satisfaction and lower intent to
leave than entitleds. Other research has found that being Benevolent versus Entitled can
influence organizational justice perceptions (Kickul, Gundry & Posig, 2005; Scott &
Colquitt, 2007) and organizational citizenship behaviours (Blakely, Andrews &
Moorman, 2005; Restubog, Bordia & Tang, 2007).
Interestingly, research on equity sensitivity has focused on differentiating between
benevolents and entitleds, often ignoring the role of equity sensitives (i.e., individuals
who adhere to the norm of equity). This problem is mainly attributed to issues with how
equity sensitivity is measured.
Measurement Issues
Initially, equity sensitivity was measured with the Equity Sensitivity Instrument
(ESI; Huseman et al., 1985). The ESI consists of five forced-distribution items. For each
item (e.g., “It would be more important for me to”) there are two statements: a benevolent
statement (e.g., “give to my organization”) and an entitled statement (e.g., “get from my
organization”). Respondents are asked to distribute 10 points between the two statements,
with their benevolent scores totalled to create a scale score. When examining differences
between the three equity sensitivity categories (i.e., benevolents, equity sensitives and
entitleds), researchers (e.g., King, Miles & Day, 1993; Miles, Hatfield & Huseman, 1989)
have relied upon cut scores, creating categories for benevolents (1/2 SD above the mean),
equity sensitives (between 1/2 SD below and above the mean) and entitleds (1/2 SD
result in acquiescence, poor reliability and a lack of validity (Bartram, 1996; Hicks, 1970;
Johnson, Wood & Blinkhorn, 1988; Ray, 1990; Tenopyr, 1988). In addition, the use of
cut scores to identify each equity sensitivity category is also an issue (see Cohen, 1983;
Dwyer, 1996) that can lead to an increased probability of type-1 error (Maxwell &
Delaney, 1993), lower statistical power (Varga, Rudas, Delaney & Maxwell, 1996) and
problems with sample-specific scoring (Sauley & Bedeian, 2000).
To address the limitations of the ESI, Sauley and Bedeian (2000) developed a new
measure of equity sensitivity that they called the Equity Preference Questionnaire (EPQ).
Thus, following the guidelines set forth by measure development experts (e.g., Hinkin,
1998; Jackson, 1970), Sauley and Bedeian (2000) developed a normative measure that
addressed the content and construct validity issues related to the ESI. First, the authors
started with a clear definition of equity sensitivity. Second, after conducting a pilot study,
Sauley and Bedeian (2000) retained 16 items – eight benevolent items and eight entitled
items – for the EPQ scale. These items asked individuals about their preferred ratio of
inputs to outcomes. For example, a sample benevolent item is, “Even if I received low
wages and poor benefits from my employer, I would still try to do my best at my job.” A
sample entitled item is, “I prefer to do as little as possible at work while getting as much
as I can from my employer.” However, these items are clearly double barrelled, asking
the individual to respond to both inputs (“I prefer to do as little as possible at work”) and
outcomes (“while getting as much as I can from my employer”). Further, Sauley and
Bedeian (2000) found that the EPQ was susceptible to socially desirable responding.
Even further, research investigating the factor structure of the EPQ has questioned the
(Miller, 2009; Taylor, Kluemper & Sauley, 2009; Woodley, Bourdage, Ogunfowora &
Nguyen, 2016).
More recently, researchers have tried to address the multidimensionality issue by
creating two scales that attempt to measure equity sensitivity as a bidimensional
construct. As a result, a fourth equity sensitivity category was introduced (i.e., individuals
who are low on both inputs and outcomes, “equity indifferents”; Davidson & Bing,
2008). The first measure – the Single-Stimulus Equity Sensitivity Instrument (SSESI) –
was introduced by Davidson and Bing (2008) and added a Likert-type agreement scale to
each statement from the ESI, creating what they referred to as separate “benevolent” and
“entitled” items. Individuals who scored high on the benevolent scale, however, could be
categorized into either the benevolent or equity sensitive category, with the same issue
occurring with the entitled scale. In addition, the original items for the ESI required
individuals to make a comparison between the two items. With the SSESI, the
comparison was removed, but the items were not reworded to correct for this. For
example, instead of allotting points between statements “A” and “B” (e.g., “It would be
more important for me to: (A) Get from the organization, (B) Give to the organization”),
individuals were asked “It would be more important for me to get from the organization”
and “It would be more important for me to give to the organization” as two separate
items, thus lacking a clear referent (i.e., more important than what?).
The second bidimensional measure – the Triadic Measure of Equity Sensitivity
(TMES) – was also based on the ESI (Clark, Foote, Clark & Lewis, 2010). The authors
altered the original ESI to include a third, equity sensitive statement in each item (e.g.,
still an ipsative measure that suffers from acquiescence bias, poor reliability and relies on
the same questionable statistical methods (e.g., sample-specific cut scores). Further, both
the SSESI and TMES were adapted from the ESI and therefore are limited by the ESI’s
lack of content validity and poor item development identified in previous research (e.g.,
Sauley & Bedeian, 2000).
Overall, the measurement of equity sensitivity appears limited by multiple
measurement related issues and concerns. These issues and concerns might not be
attributed to poor scale development. Rather, equity sensitivity appears to have some
inherent theoretical limitations preventing the development of effective measures.
Theoretical Issues
One of the theoretical issues that has limited the equity sensitivity construct
relates to its dimensionality. As previously mentioned, equity sensitivity was theorized by
Huseman et al. (1987) to be a unidimensional construct. This, however, has not been
supported with empirical research. As previously noted, much of the measurement
development research has proposed that equity sensitivity is better measured as a
bidimensional construct. In fact, the unidimensional approach even differs from Adams’
(1963’ 1965) original equity theory in which Adams’ argued that inputs and outcomes
were two separate and unique constructs.
In addition, equity sensitivity and its measurement has focused on, and is limited
by, its application only to the workplace. Nevertheless, Adams’ (1963) argued that
perceptions of equity occur in any “social situation in which an exchange takes place.”
(p.422). Because equity sensitivity is theorized as being a state, rather than a personality
relation between the employer and employee. However, taking a trait approach would
allow individual differences in perceptions of equity to be applied across all social
exchange situations.
Finally, equity sensitivity has some issues in regards to the naming of the
categories. In particular, the terms “equity sensitivity” and “equity sensitives” can be
confusing and misleading, as individuals who are high on “equity sensitivity” are not
considered to be “equity sensitive,” rather, they are considered to be “benevolent.” This
can therefore create confusion with the understanding, interpreting and reporting of the
research findings when investigating equity sensitivity, as equity sensitives are often
ignored (e.g., Sauley & Bedeian, 2000).
To address the many measurement and theoretical issues related to equity
sensitivity, I propose a new construct based on Adams’ equity theory: equity orientation.
Equity Orientation
Equity orientation is an individual difference variable based on Adams’ (1963;
1965) equity theory. As previously discussed, equity theory argues that individuals
perceive fairness (i.e., equity) based on what Adams’ referred to as the “norm of equity.”
This “norm” is described as an individual’s preference for his or her ratio of inputs to
outcomes to be equal to the ratios of comparison others with similar roles and
responsibilities. If, for example, an individual’s ratio of inputs to outcomes differs
significantly from those around him or her, Adams’ (1963; 1965) argues the individual
Although Adams’ (1963; 1965) proposed equity theory within the context of the
organization, he argued that equity theory was applicable in any social exchange
situation:
It should be evident, however, that the theoretical notions advanced are relevant to
any social situation in which an exchange takes place, whether the exchange be of
the type taking place between man and wife, between football teammates,
between teacher and student, or even, between Man and his God. (Adams, 1963,
p.422)
In fact, equity theory has been applied to a variety of different social exchanges and
interactions. For example, the “norm of equity” has been investigated in romantic
exchanges (Davidson, 1984; Davidson, Balswick, & Halverson, 1983), buyer-seller
exchanges (Lapidus & Pinkerton, 1995; Román & Ruiz, 2005), teacher-student
exchanges (Bakker et al., 2000) and doctor-patient exchanges (Van Dierendonck,
Schaufeli & Sixma, 1994).
Adams’s (1963; 1965) also argued that individuals’ inputs and outcomes operate
independently (i.e., individuals can manipulate either their inputs or outcomes to achieve
the equitable ratio). As a result, research on equity theory has commonly measured each
individual’s inputs and outcomes as separate dimensions and then calculated the equity
ratios (e.g., Davidson, 1984; Michaels, Edwards & Acock, 1984; Traupmann, Petersen,
Utne & Hatfield, 1981). This is because individuals will differ on their inputs and
outcomes based on their own preferences and desires in order to maintain the equity
norm. Nevertheless, research by Huseman et al. (1985) found that many individuals do
others are more outcome oriented. Combining these arguments suggest that individuals
will differ in their desire to put forth effort (i.e., inputs) and their desire to be rewarded
(i.e., outcomes); however, they do not necessarily do this to maintain the equity norm. As
previously mentioned, research (e.g., Huseman et al., 1985; 1987) has demonstrated that
not all individuals feel distress when facing inequity. Possibly underlying this are
individual differences in how people react to inequity (e.g., Woodley & Allen, 2014;
Woodley et al., 2016). Thus, I propose the construct of equity orientation, which argues
that individuals’ perception of equity is dependent on two factors: individuals desire to
put forth effort (i.e., input orientation) and desire for rewards (i.e., outcome orientation).
In addition, when these two traits are examined together they will create ‘subgroups’ or
‘profiles’ of individuals who have differing perceptions of what is equitable.
In the following sections I will define input orientation and outcome orientation as
variables and discuss the proposed equity orientation profiles, explaining their value to
understanding individual differences in perceptions of equity/fairness.
Input Orientation
According to equity theory, there are a variety of individual characteristics that
can be considered to be inputs. Using the workplace context as an example, an
individual’s previous work experience, education, skills and expertise, and job
knowledge may all be considered ‘inputs’ that the individual brings to the job. These
inputs must have three characteristics: they must be recognized by both parties, relevant
to the job, and considered by the possessor to be a contributing factor in the exchange
(i.e., an input). Therefore, an individual must put effort towards the input for it to be a
exchange is the effort an individual puts forth. I therefore argue that an individual’s input
orientation is his or her desire, or willingness, to put forth effort (e.g., contribute to a task,
help others, and work hard). In accordance with equity theory, individuals will differ in
the amount of effort that they will put forth in a given situation (Adams, 1963; 1965),
resulting individual differences in input orientation.
Initially, input orientation may be mistaken for another construct: intrinsic
motivation. Intrinsic motivation is defined as that which propels an individual to engage
in an activity because it is naturally interesting and enjoyable to the individual (Deci &
Ryan, 1985). As a result, intrinsic motivation is often discussed with respect to a specific
task or specific activity that inherently drives an individual to perform. However, what is
intrinsically motivating varies within and across individuals. For example, a high school
student may be intrinsically motivated to learn chemistry but not mathematics, whereas
his or her friend may be intrinsically motivated to learn mathematics but not chemistry.
Input orientation, on the other hand, focuses on the disposition of the individual across
various tasks and activities. Further, although input oriented individuals have a desire to
put forth effort, it does not mean they necessarily enjoy doing it. Input oriented
individuals might believe that contributing or putting forth effort is the “right” thing for
them to do, even though they do not find personal enjoyment from doing the task or
activity. For example, input oriented individuals might agree to help a friend move into a
new home (i.e., contribute), even though they do not enjoy the labour of moving (i.e., the
activity is not intrinsically motivating). Overall, input orientation differs from intrinsic
activities, whereas intrinsic motivation is what an individual feels about the characteristic
of a specific task or activity and that drives the individual toward relevant action.
Outcome Orientation
Adams’ (1963) defines outcomes as the “rewards received by an individual for
[his or her] services” (p. 423). In the context of an employee-employer relationship,
examples of these rewards are salary, benefits, seniority, power, and job status. However,
in other relationships, such as a buyer-seller relationship, the outcome could be the
quality of the product being consumed. Or, in a romantic relationship, it could be the
financial support one partner provides for the other. Commensurate with Adams’ (1963;
1965) theorizing regarding inputs, outcomes are also required to be both recognized and
relevant to the recipient in the exchange for the outcome to be considered a contributing
factor in the exchange. With that being said, some individuals may not be oriented
towards outcomes, whereas others might have a strong desire for outcomes. I therefore
argue that an individual’s outcome orientation is his or her desire, or willingness, to
receive outcomes (e.g., pay, rewards, and benefits). In addition, Adams’ (1965) argued
that recipients have the ability to manipulate their outcomes, suggesting that individuals
can differ in their outcome orientation.
At this point, it is important to distinguish between outcome orientation and
extrinsic motivation. Extrinsic motivation is defined as doing a task in order to gain/attain
an outcome (Deci & Ryan, 1985). Although this definition may seem similar to outcome
orientation, an important distinction can be made between the two constructs. Extrinsic
motivation is often used in situations where a task or activity is disinteresting (e.g.,
taking out the garbage) require extrinsic motivation to get an individual to complete it.
However, individuals who are extrinsically motivated may complete the task or activity
reluctantly and with resentment (Ryan & Deci, 2000). An individual’s outcome
orientation, on the other hand, is an individual’s disposition across various tasks and
activities. Further, an outcome-oriented individual desires outcomes and will therefore
respond positively to any situation that will provide a desirable outcome. In fact, a task or
activity that provides an outcome may become intrinsically motivating (i.e., interesting or
enjoyable) to an outcome-oriented individual. Overall, outcome orientation differs from
extrinsic motivation in that it is a characteristic of the individual, whereas extrinsic
motivation is a characteristic of a specific task or activity that drives the individual
toward relevant action.
In sum, input and outcome orientation are two novel personality traits that can add
to our understanding of how and individual will behave across various types of social
exchanges. Although a distinction has been made between input and outcome orientation
and intrinsic and extrinsic motivation (i.e., the former being personality traits and the
latter being characteristics of a specific task or activity), it is also worth mentioning a
difference between these construct as they coexist within an individual. Intrinsic
motivation and extrinsic motivation have an interesting relationship, as meta-analytic
research has demonstrated that extrinsic motivation can undermine intrinsic motivation
(Deci, Koestner, & Ryan, 1999). Input and outcome orientation, on the other hand, are
considered to co-exist within an individual. Their co-existence, however, is independent,
with neither input orientation nor outcome orientation undermining or supplanting the
orientation profiles that are theorized to further the understanding of how individuals
differ in how they perceive equity.
Equity Orientation Profiles
It is important to note here that social exchanges are dyadic; that is, inputs and
outcomes are co-existing during the exchange (Blau, 1964; Cropanzano & Mitchell,
2005). As a result, an individual’s perception of what is equitable (i.e., fair) may depend
on his or her desire for either inputs or outcomes. Taken together, it seems reasonable to
suggest that individuals can be categorized into subgroups (or “profiles”) based on
whether they are high or low on either equity orientation trait, high on both, or low on
both traits (see Figure 1). The following sections will expand on this notion that
individuals’ perceptions of what is fair may vary across individuals and that the
patterning of these perceptions will produce four profiles.
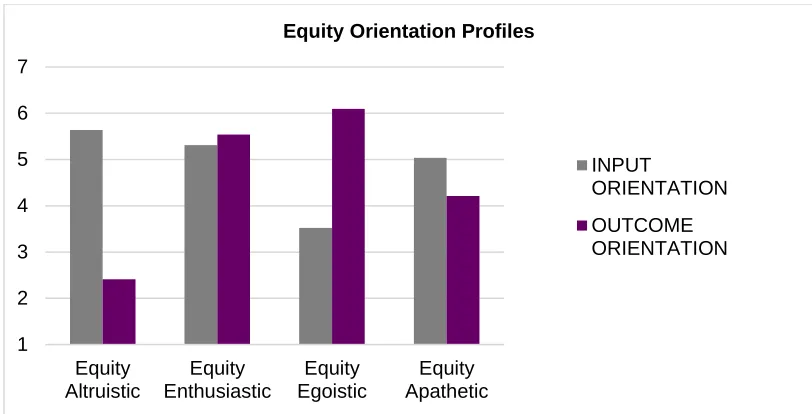
Equity enthusiastic profile. These individuals have both a desire to put forth effort (i.e., high input orientation) and a desire to be rewarded for their efforts (i.e., high
outcome orientation). They, therefore, are driven by a balanced and fair exchange and
will perceive inequity – in either inputs or outcomes – as a violation of the exchange.
Equity apathetic profile. These individuals have no desire to put forth effort (i.e., low input orientation) and care little for rewards (i.e., low outcome orientation).
They are therefore considered to be unmotivated, not caring to work hard or help others,
and also not concerned with gaining any external rewards.
Inp
ut
O
ri
en
tati
on Hi
gh Equity
Altruistic
Equity Enthusiastic
Low
Equity Apathetic
Equity Egoistic
Low High
Outcome Orientation
outcome orientation). They therefore are driven by what they can give in an exchange,
focusing on their contributions rather than the outcomes of the exchange.
Equity egoistic profile. These individuals have no desire to put forth effort (i.e., low input orientation), but have a strong desire for rewards (i.e., high outcome
orientation). They are driven, therefore, by what they can get from an exchange, trying to
maximize what they will receive while minimizing how much effort they will have to put
into the exchange.
The purpose of the investigation herein is to develop a measure of equity
orientation, examine its nomological network, and test the theory surrounding equity
orientation in a social exchange context (i.e., work teams). This is done across two
phases. Phase 1 addressed the need to develop a measure of equity orientation and
examine its nomological network. Further, I examined the existence of the four equity
orientation profiles and developed their nomological networks as well. In two studies, the
findings were replicated across self- and peer-reports using the most prominently
researched models of personality (i.e., the Big Five/HEXACO and Dark Triad/Tetrad).
Building on the findings of Phase 1, Phase 2 applied equity orientation as a predictor in a
social exchange context (i.e., criterion-related validity). More specifically, I examined
how an individual’s equity orientation related to his or her performance-related
behaviours while working in a team. Again, across two studies and both self- and
peer-reports (for the performance-related behaviours), I examine the relations among equity
CHAPTER 2: MEASURE VALIDATION
Following Hinkin’s (1998) guidelines for scale development, the equity
orientation measure was designed using a deductive approach and was therefore based on
the aforementioned theory regarding equity orientation. Further, I sought to examine the
measure’s relations with two of the most popular personality models: the Big
Five/HEXACO and the Dark Triad/Tetrad. These models provide integral information to
base future research on by improving our understanding of the nomological network for
each equity orientation dimension (i.e., input and outcome orientation). Even further, I
utilized both variable-centred and person-centred analytic procedures (to be discussed) to
improve our understanding of the equity orientation dimensions and the proposed equity
orientation profiles. Across two studies, I tested both self- and peer-reports of personality
to provide initial validation to the equity orientation construct.
Study 1
The purpose of Study 1 was to develop a measure of equity orientation. In
addition, I sought to provide initial construct validation by developing equity
orientation’s nomological network. To achieve this, I examined how equity orientation
relates to the Big Five personality traits, Honesty-Humility, and the Dark Triad. As
previously discussed, these personality traits were selected because they are the most
frequently researched personality traits in the literature today.
The Big Five
Personality has been theorized in many different ways. However, the Big Five
personality traits are arguably the most widely researched personality traits. Based on
the Big Five consists of conscientiousness, agreeableness, neuroticism/emotional
stability, openness to experience and extraversion. Considering the prevalence of the Big
Five traits, I investigated the equity orientation dimensions and their relations to the Big
Five personality traits.
Conscientiousness. Conscientiousness is characterized by persistence, striving for achievement and being hardworking (Goldberg, 1990). Research on
conscientiousness has found it to be related to variety of input-related variables. For
example, conscientiousness has been demonstrated to relate to high achieving and
persistence (Komarraju & Karau, 2005), instrinsic motivation (Hart, Stasson, Mahony &
Story, 2007), and performance motivation (Judge & Ilies, 2002). In addition, Fong and
Tosi (2007) found that conscientiousness predicted the amount of effort individuals put
forth on a given activity.
In regards to outcomes, conscientiousness does not appear to have as clear a
relation. For example, research has demonstrated that conscientiousness is unrelated to
income (Boudreau, Boswell, & Judge, 2001), economic desire (Komarraju & Karau,
2005) and job status (Furnham, Eracleous & Chamorro-Premuzic, 2009). Further, Hart et
al. (2007) found conscientiousness to be unrelated to extrinsic motivation.
Some research has also investigated how conscientiousness relates to both inputs
and outcomes within the same study, testing Costa and McCrae’s (1992) argument that
conscientiousness individuals’ achievement orientation is relatively independent of any
desire for external rewards. In support of this, Burnett, Williamson and Bartol (2009)
found conscientiousness related to job satisfaction even when external outcomes were
was positively related to status striving (outcome) through their accomplishment striving
(input).
Based on these findings, it appears that conscientious individuals will have a high
input orientation, whereas they seem to have a “take it or leave it” approach to outcomes.
Therefore the following is hypothesized:
Hypothesis 1: Conscientiousness will be positively related to input orientation.
Agreeableness. Agreeableness is characterized by empathy, cooperation and generosity (Goldberg, 1990). Research on agreeableness and input-related constructs has
generally found the two variables unrelated. For example, both Hart et al. (2007) and
Komarraju, Karau and Schmeck (2009) found agreeableness to be positively related to
intrinsic motivation; however, when included in a regression model with the other Big
Five personality traits, agreeableness did not predict any unique variance. Further,
Komarraju and Karau (2005) found agreeableness to be unrelated to achieving, and both
Barrick and Mount (1991) and Witt, Burke, Barrick and Mount (2002) found
agreeableness to be unrelated to job performance.
On the other hand, agreeableness has been found to negatively relate to a variety
of outcomes. For example, research has found agreeableness to be negatively related to
job status (Furnham et al., 2009), status striving (Barrick et al., 2002), income (Boudreau
et al., 2001) and extrinsic motivation (Hart et al., 2007). Further, both Judge, Livingston
and Hurst (2012) and Ng, Eby, Sorensen and Feldman (2005) found that disagreeable
people value money more highly. Even further, Barry and Friedman (1998) found
agreeableness to be negatively related to distributive bargaining (for compensation)
Based on the previous research, it seems as though agreeableness is unrelated
with input-related behaviour. However, individuals who are high on agreeableness seem
to lack a desire for outcomes. Therefore the following is hypothesized:
Hypothesis 2: Agreeableness will be negatively related to outcome orientation.
Extraversion. Extraversion is characterized by positivity, sociability, and talkativeness (Goldberg, 1990). Researchers have generally found a positive relation
between extraversion and input-related behaviours. For example, extraversion has been
found to positively relate to persistence and influencing others (Komarraju & Karau,
2005), intrinsic motivation (Hart et al., 2007; Sung & Choi, 2009), performance
motivation (Judge & Illies, 2002) and accomplishment striving (Barrick et al., 2002). In
regards to job performance, extraversion has demonstrated to be positively related (Hurtz
& Donovan, 2000), especially in jobs where the ability to socialize is considered an asset
(Barrick & Mount, 1991; Salgado, 1997).
Extraversion has also been found to positively relate to outcomes in the research
literature. For example, extraversion has been found to be positively related to both
economic desire (Komarraju & Karu, 2005) and enterprising (Costa et al., 1984). This
should not be too surprising considering early theorizing of extraversion proposed that
extraverts are motivated by extrinsic rewards (Gray, 1973), which has been supported
with empirical evidence (Hart et al., 2007). In addition, researchers have also found
extraversion to be positively related to income (Boudreau et al., 2001; Judge et al., 1999).
This relation may not be attributed to greed; rather, extraverts are more likely to perform
Based on the previous research, it appears as though extraverts are individuals
who have a desire to put forth effort and contribute. In addition, individuals who are high
on extraversion seem to be motivated by a desire for outcomes. Therefore the following
is hypothesized:
Hypothesis 3a: Extraversion will be positively related to input orientation
Hypothesis 3b: Extraversion will be positively related to outcome orientation
Neuroticism. Neuroticism is characterized by fears, insecurity and other negative emotions (e.g., envy and gullibility; Goldberg, 1990). Neuroticism research has generally
found the trait to be unrelated to input-type behaviours. For example, researchers have
found neuroticism to be unrelated to both persistence and achieving (Komarraju & Karau,
2005). In addition, although Hart et al. (2007) found neuroticism to be negatively related
to intrinsic motivation, it did not predict unique variance when the other Big Five traits
were included in a regression model. Further, Komarraju et al. (2009) found neuroticism
to be unrelated to intrinsic motivation. Even further, van Doorn and Lang (2010) found
that the amount of effort put forth by neurotic individuals varies, especially when taking
into account task demands and dimensions of neuroticism.
Similar effects have been found in regards to neuroticism and outcomes. For
example, although Barrick et al. (2002) found neuroticism to positively relate to status
striving, Boudreau et al. (2001) found neuroticism to be negatively related to income. In
addition, other research has found neuroticism to be unrelated to enterprising (i.e., a
desire for outcomes; Costa, McCrae & Holland, 1984), economic desire (Komarraju &
Based on this research, it appears as though individuals who are high on
neuroticism are neither interested in inputting nor do they have a desire for outcomes.
Therefore no hypotheses are proposed with respect to this trait..
Openness to experience. Openness to experience is characterized by creativity, curiosity and an appreciation for arts (Goldberg, 1990). A review of the openness to
experience literature reveals an interesting relation between openness to experience and
input-related behaviours. In general, openness to experience has been found to relate to
high persistence and achieving (Komarraju & Karau, 2005). In addition, researchers have
also found openness to experience to be positively related to intrinsic motivation
(Komarraju et al., 2009; Sung & Choi, 2009). However, intrinsic motivation does not
always translate into putting forth effort and contributing during a social exchange
(Grant, 2008). That might explain why openness to experience is consistently unrelated to
job performance (Barrick & Mount, 1991; Barrick, Mount & Judge, 2001; Salgado,
1997).
In regards to outcomes, the relation with openness to experience is much clearer.
For example, openness to experience has been demonstrated to be unrelated to
enterprising (Costa et al., 1984), job status (Furnham et al., 2009), status striving (Barrick
et al., 2002) and income (Boudreau et al., 2001; Judge, Higgins, Thoresen & Barrick,
1999). Moreover, although Hart et al. (2007) found a positive bivariate relation between
openness to experience and extrinsic motivation, this effect disappeared when all of the
Big Five traits were included in a regression. However, Sung and Choi (2009) found no
Based on the discussed findings, it is theorized that openness to experience will be
neither related to an individual’s desire to put forth effort, nor their desire for outcomes.
Thus, no hypotheses are proposed.
Despite the widespread use of the Big Five model in the literature, other models –
such as, the HEXACO model (Lee & Ashton, 2004) – have emerged as useful
alternatives. The HEXACO is named for its six personality traits: honesty-humility,
emotionality, extraversion, agreeableness, conscientiousness, and openness to experience
(Lee & Ashton, 2004). Although there is significant overlap between the Big Five and
HEXACO models, the sixth factor in the HEXACO model, Honesty-Humility, has been
demonstrated to contributed to our understanding of perceptions of equity beyond the Big
Five (Woodley et al., 2016).
Honesty-Humility
Honesty-Humility is characterized by sincerity, greed avoidance, and fairness
(Lee & Ashton, 2008). Limited research has been conducted regarding Honesty-Humility
and input-related behaviours. This is not surprising considering that Honesty-Humility
research has mainly focused on demonstrating its incremental validity over the Big Five
traits (e.g., Ashton & Lee, 2008; de Vries, de Vries, de Hoogh & Feij, 2009; McKay &
Tokar, 2012). Nonetheless, some research – mainly in the area of individual performance
– has investigated Honesty-Humility and input-related behaviours. For example, Johnson,
Rowatt and Petrini (2011) found Honesty-Humility to positively predict job performance
in caregivers. Further, both Lee, Ashton and de Vries (2005) and Lee, Ashton and Shin
absenteeism), whereas Hilbig, Glöckner and Zettler (2014) found Honesty-Humility
positively related to prosocial behaviours (e.g., helping behaviour).
Similarly, limited research has investigated Honesty-Humility and outcomes.
However, the existing research has demonstrated that Honesty-Humility might be
negatively related to a desire for outcomes. For example, Hilbig and Zettler (2009) found
that Honesty-Humility was negatively related to selfish decision making in regards to
reward allocations. Further, individuals who are high in Honesty-Humility tend to have a
lower desire for power and money (Lee, Ashton, Wiltshire, Bourdage, Visser & Gallucci,
2013). Even further, and possibly more germane to the current investigation, Lee and
Ashton (2006) found that Honesty-Humility measures an unwillingness to take advantage
of others in social exchanges.
Based on this review of the literature, it seems as though Honesty-Humility is
associated with a desire to put forth effort, especially when the effort will result in
helping others. In addition, Honesty-Humility seems to have a lack of desire for
outcomes. Thus, the following is hypothesized:
Hypothesis 4a: Honesty-Humility will be positively related to input orientation.
Hypothesis 4b: Honesty-Humility will be negatively related to outcome orientation.
Dark Triad
The Dark Triad is made up of three anti-social personality traits:
Machiavellianism, narcissism and psychopathy. Although these traits have different
theoretical origins, researchers (e.g., Fehr, Samsom & Paulhus, 1992; McHoskey, Worzel
& Szyarto, 1998) have argued that the three traits are actually very similar. However,
that these traits are unique and should be treated as such. In line with this statement, I
treat the Dark Triad as three distinct but related personality traits.
Machiavellianism. Based on the writings of Machiavelli, Machiavellianism is a personality trait associated with being manipulative (Christie & Geis, 1970). The trait is
further characterized by the use of deception (Geis & Moon, 1981) and unethical
practices (Winter, Stylianou, & Giacalone, 2004) for personal gains. This suggests that
individuals who are high on Machiavellianism should have less desire to exert effort due
to their “selfish” tendencies. In addition, Machiavellian individuals are considered likely
to manipulate others for personal gains (e.g., external outcomes). Commensurate with
these arguments, Woodley and Allen (2014) found that Machiavellianism is positively
associated with entitlement (i.e., low input, high outcome orientation). Thus, the
following is hypothesized:
Hypothesis 5a: Machiavellianism will be negatively to input orientation.
Hypothesis 5b: Machiavellianism will be positively related to outcome orientation.
Narcissism. Narcissism is a Dark Triad personality trait that is based on a psychological disorder by the same name (Raskin & Hall, 1979). In their summary,
Paulhus and Williams (2002) argued that research evidence has found narcissism to be
characterized by entitlement, superiority, vanity and exhibitionism (Raskin & Terry,
1988). Although the former two characteristics may suggest narcissism would be oriented
towards outcomes, the latter two characteristics suggest narcissistic individuals will
incorrectly perceive themselves as being input oriented (i.e., they will falsely believe that
they are contributors). In support of this, Woodley and Allen (2014) found narcissism to
input and outcome orientation, therefore perceiving themselves as being “equity
sensitive”. Thus, the following is hypothesized:
Hypothesis 6a: Narcissism will be positively related to input orientation.
Hypothesis 6b: Narcissism will be positively related to outcome orientation.
Psychopathy. Psychopathy, like narcissism, is also a personality trait that is based on a psychological disorder by the same name (Hare, 1985). Paulhus and Williams
(2002) argued that individuals who are high in this personality trait tend to be greedy
(Albert, Brigante & Chase, 1959) and egocentric (Cleckley, 1988), with a lack of both
empathy (Gough, 1960) and ambition (Albert, Brigante & Chase, 1959). Greed and
egocentrism are characteristics that should positively relate to an individuals desire for
outcomes. In addition, a lack of empathy and ambition suggest that psychopathy should
negative relate to an individual’s desire to exert effort. In support of this, Woodley and
Allen (2014) found psychopathy positively related to entitlement (i.e., low input, high
outcome orientation). Thus, the following is hypothesized:
Hypothesis 7a: Psychopathy will be negatively related to input orientation.
Hypothesis 7b: Psychopathy will be positively related to outcome orientation.
Equity Orientation Profiles
Historically, an extensive amount of research has focused on the variable-centered
approach to examining how variables interrelate when predicting outcomes. The most
frequently used method is to conduct a moderation analysis, wherein an interaction
variable is created between two or more variables to examine how they interrelate in
regards to the outcome. This is beneficial because it helps describe the relations between
However, this approach is not without limitations (see Meyer, Stanley & Vandenberg,
2013; O’Neill, McLarnon, Hoffart, Woodley & Allen, 2015). Although these moderation
analyses can often be described as testing the differences between subgroups (i.e.,
profiles), the focus is still on the variables and does not provide a method of testing for
differences between subgroups within a sample. In addition, a moderation analysis
requires a large sample size due to its lack of power to detect complex interactions.
On the other hand, a person-centered approach (e.g., cluster analysis or latent
profile analysis) has the ability to address many of the limitations of the variable-centered
approach. A person-centered approach focuses on categorizing individuals in a given
sample into different subgroups. In this case, individuals are treated in a holistic fashion
rather than being inferred from the interplay between variables (Meyer et al., 2013). In
addition, the person-centered approach treats group membership as a variable, making it
possible to test for differences between the identified subgroups. A person-centered
approach is therefore advantageous when a researcher is trying to differentiate between
certain theorized subgroups or profiles of individuals within a sample or population.
As a result, I take a person-centered approach to identify the theorized equity
orientation profiles. I expect to discover all four of the theorized equity orientation
profiles from analyzing our two equity orientation traits: input and outcome orientation.
That is, I expect to find the following subgroups: equity enthusiastics (i.e., high input;
high outcome), equity apathetics (i.e., low input; low outcome), equity altruistics (i.e.,
high input; low outcome) and equity egoistics (i.e., low input; high outcome).
Hypothesis 8: Latent profile analysis will reveal four equity profiles: equity altruistics,
Due to the exploratory nature of using latent profile analysis to identify equity
orientation profiles, no hypotheses regarding the potential profiles and the personality
traits are proposed.
Methods
Measure development. Following the guidelines set out by Hinkin (1998), Jackson (1970), and Spector (1992), I took a deductive approach to developing a measure
of equity orientation. I began with our definition of the construct. Equity orientation,
which is based on Adams’ (1963; 1965) equity theory, measures individual differences in
what individuals perceive to be equitable. As previously discussed, Adams’ argued that
there are two main components to an individual’s perception of equity: inputs and
outcomes. Adams’ argued that individuals will adjust their inputs and their outcomes
such that their ratio of inputs to outcomes is equal to relevant comparison others. Adams’
referred to this ideal ratio as the ‘norm of equity.’ However, as previously mentioned,
Huseman et al. (1985) found that individuals do not always follow Adams’ equity norm,
arguing that individuals had differing equity sensitivity, finding that some individuals are
more input focused while others were more outcome focused. A limitation to this
approach was that the authors focused on individuals having an imbalance between their
inputs and outcomes (i.e., more input focused being “benevolent” and more outcome
focused being “entitled”), treating them as opposite ends of an equity sensitivity
continuum (i.e., unidimensional). This approach forces the ratio between these
theoretically independent constructs, ignoring that individuals could vary on their inputs
(high or low) and outcomes (high or low) independently (Davison & Bing, 2008).
measuring individual differences in perceptions of equity, arguing that individuals differ
on how much they desire to put forth effort (i.e., input orientation) and how much they
desire to receive rewards (i.e., outcome orientation).
Based on the aforementioned definitions of each dimension, I generated 40 items
(20 per dimension) to measure the equity orientation construct. Three independent
judges, who were all subject matter experts, were asked to evaluate the 40 generated
items for wording, quality, and content validity. All three subject matter experts had
previous experience with test development and two of the three have developed and
published their own measures. After receiving feedback from the raters, eight items were
removed due to either poor wording redundancy with others items, or content invalidity.
Thus, 32 items were retained (16 per dimension) to measure equity orientation (See Table
1).
Participants and procedure. Participants were undergraduate students enrolled in a first year psychology course at a large Canadian university. A total of 836
participants were recruited for the investigation with a mean age of 18.5 years (range: 16
to 54). The sample was predominately female (70%) with the most prevalent ethnicities
being Caucasian (57%) and East Asian (18%).
In accordance with the university’s Non-Medical Research Ethics Board (see
Appendix A), all participants provided electronic informed consent prior to participating
in the study. Participants completed a battery of questionnaires for course credit through
an online testing process. Participants were provided instructions for each questionnaire
Table 1. The original 32 Equity Orientation Scale items.
Input Orientation
1. I am someone who puts in a lot of effort
2. I always try to give my all
3. I am constantly trying to minimize how much work I have to do (R)
4. I am always findings ways to contribute
5. I like to do as much as I can
6. Ideally, I’d prefer to sit back while others do the work (R)
7. I am known as someone who always helps
8. I try to help those around me
9. I can be lazy at times (R)
10. I often volunteer to take on more responsibilities
11. I frequently offer my assistance to others
12. I do not like when I have to do more than the bare minimum (R)
13. I give more than others around me
14. Those who know me well would refer to me as a giver
15. I try to do as little as possible (R)
16. I am frequently referred to as a hard worker
Outcome Orientation
1. The compensation I receive for my actions is important to me
2. I want to be rewarded for the work I complete
3. Generally, compensation is not what motivates my behaviour (R)
4. I base my decisions on the outcomes I will receive
5. I find knowing what I will get in return for my efforts motivates me
6. What I get out of situations is of little importance to me (R)
7. My actions are dictated by what I will get for them
8. I tend not to act until I know what is in it for me
9. I am rarely concerned with how I will personally benefit from a situation (R)
10. I put a lot of weight on personal gains and/or benefits when making decisions
11. When someone asks me for something, I think or say “what is in this for me?”
12. I tend not to be motivated by external rewards (R)
14. Outcomes (e.g., bonuses, rewards, or accolades) are a major source of motivation for me
15. I do not worry about receiving rewards or benefits for my efforts (R)
Measures.Equity orientation. Equity orientation was measured using the 32 remaining items from the item generation stage and administered to the participants (see
Appendix B). The 16 input orientation items were administered together, as were the 16
outcome orientation items. A sample input orientation item is, “I am someone who puts
in a lot of effort,” whereas a sample outcome orientation item is, “I want to be rewarded
for the work I complete.” Each item was responded to on a seven-point Likert-type
agreement scale (1 = strongly disagree; 7 = strongly agree).
The Big Five. Items based on Costa and McCrae’s (1992b) NEO PI-R from the
International Personality Item Pool (IPIP; Goldberg et al., 2006) were used to measure
the Big Five personality traits (see Appendix B). A 50-item questionnaire with 10 items
per trait was used. For each trait, there were five positively worded and five negatively
worded items. Participants will respond to these items on a five-point Likert-type
agreement scale (1 = strongly disagree; 5 = strongly agree). The IPIP items have been
demonstrated to have strong internal consistency with Cronbach’s alphas ranging from
.77 to .86 (Goldberg et al., 2006).
Honesty-Humility. To measure Honesty-Humility, 10 items from the 60-item
HEXACO questionnaire (Ashton & Lee, 2009) consisting of both positively and
negatively keyed items were used (see Appendix B). Participants responded to these
items on a five-point Likert-type agreement scale (1 = strongly disagree; 5 = strongly
agree). Previous research with these items has found them to have strong internal
consistency in both student and community samples (Ashton & Lee, 2009).
The Dark Triad. The original Short Dark Triad measure (SDT; Paulhus & Jones,
Appendix B). The measure includes 28 positively and negative keyed items with
nine-to-ten items per trait. Participants responded to each item on a five-point Likert-type
agreement scale (1 = strongly disagree; 5 = strongly agree). Paulhus and Jones (2011)
found strong internal consistency after administering the SDT to a student sample.
Results
Exploratory factor analysis. To investigate the dimensionality of the Equity Orientation Scale, I conducted an exploratory factor analysis using structural equation
modeling (ESEM) in Mplus 7. An advantage of ESEM over either principal components
or principal axis analysis is that it takes into account potential measurement error in the
analysis. In addition, ESEM provides a test of the significance for item loadings, plus
both model fit and modification indices that can be used for evaluating how well the
factor structure fits the data and to reduce the number of items on the scale.
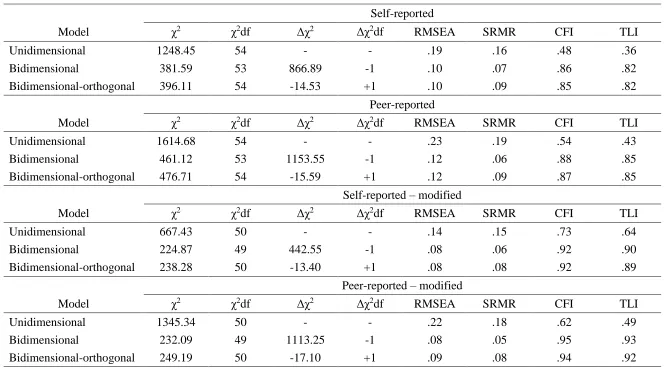
An ESEM model that tested one, two and three factors using an orthogonal
(Geomin) rotation on the original 32 items was conducted. The model fit statistics for
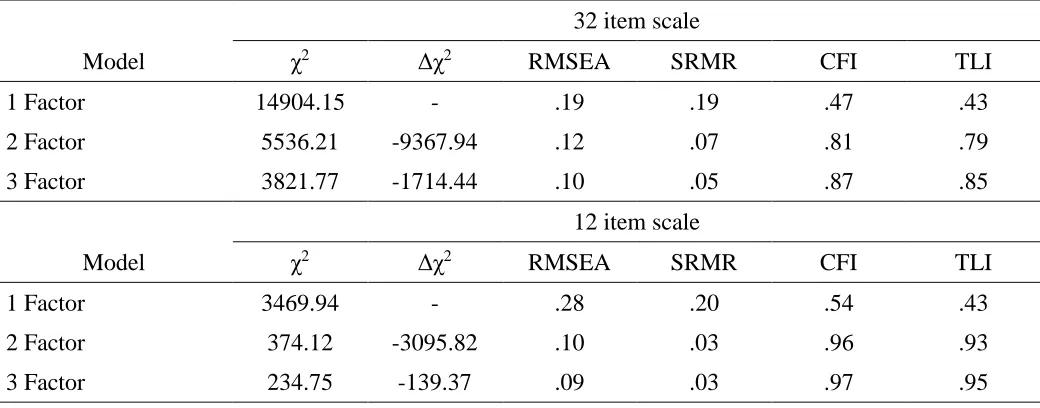
each model are presented in Table 2. After examining the factor loadings, internal
consistencies and modification indices for each item, we removed 20 items resulting in a
12-item Equity Orientation Scale. We reran the one-, two- and three-factor ESEM models
on the 12-item scale and found improved model fit (see Table 2). Although the
three-factor model had the best model fit in both ESEM analyses, it lacked any theoretical
support for the interpretation of the factors. Instead, the two-factor model, which still met
the model fit criteria (Williams, Vandenberg & Edwards, 2009), was consistent with the
proposed equity orientation theory. As a result, we adopted the two-factor model. The
Table 2. Summary of the exploratory structural equation for modeling for the Equity Orientation Scale.
32 item scale
Model χ2 Δχ2 RMSEA SRMR CFI TLI
1 Factor 14904.15 - .19 .19 .47 .43
2 Factor 5536.21 -9367.94 .12 .07 .81 .79
3 Factor 3821.77 -1714.44 .10 .05 .87 .85
12 item scale
Model χ2 Δχ2 RMSEA SRMR CFI TLI
1 Factor 3469.94 - .28 .20 .54 .43
2 Factor 374.12 -3095.82 .10 .03 .96 .93
3 Factor 234.75 -139.37 .09 .03 .97 .95
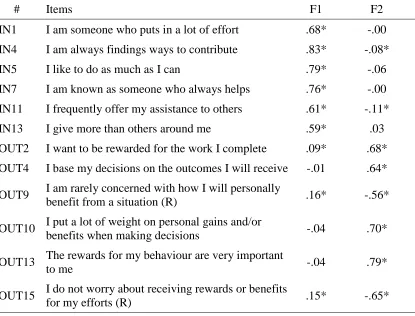
Table 3. Factor loadings for the final 12-item Equity Orientation Scale.
# Items F1 F2
IN1 I am someone who puts in a lot of effort .68* -.00
IN4 I am always findings ways to contribute .83* -.08*
IN5 I like to do as much as I can .79* -.06
IN7 I am known as someone who always helps .76* -.00
IN11 I frequently offer my assistance to others .61* -.11*
IN13 I give more than others around me .59* .03
OUT2 I want to be rewarded for the work I complete .09* .68*
OUT4 I base my decisions on the outcomes I will receive -.01 .64*
OUT9 I am rarely concerned with how I will personally
benefit from a situation (R) .16* -.56*
OUT10 I put a lot of weight on personal gains and/or
benefits when making decisions -.04 .70*
OUT13 The rewards for my behaviour are very important
to me -.04 .79*
OUT15 I do not worry about receiving rewards or benefits
for my efforts (R) .15* -.65*
Note. IN, input orientation; OUT, outcome orientation.
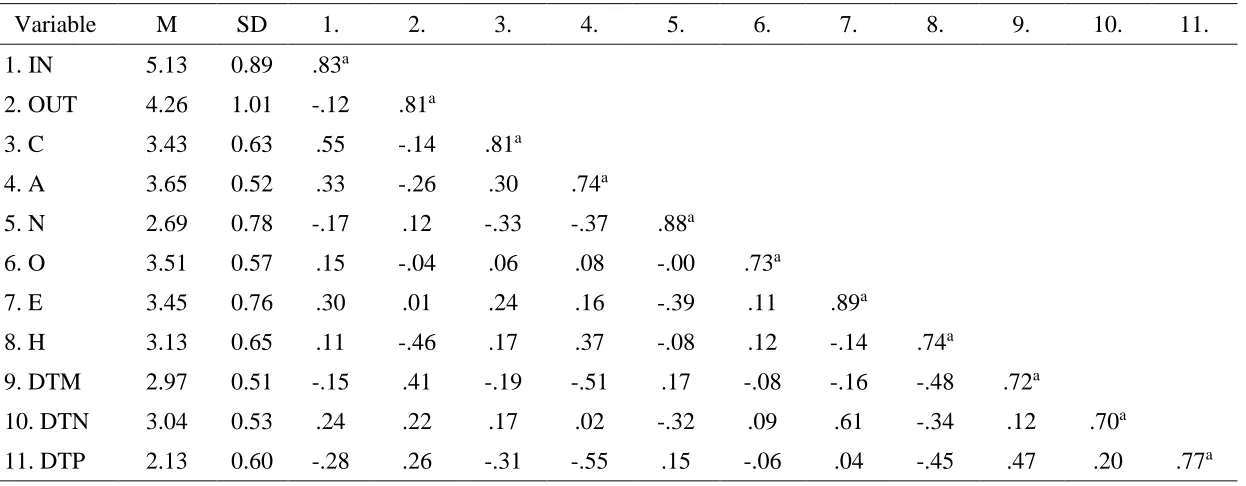
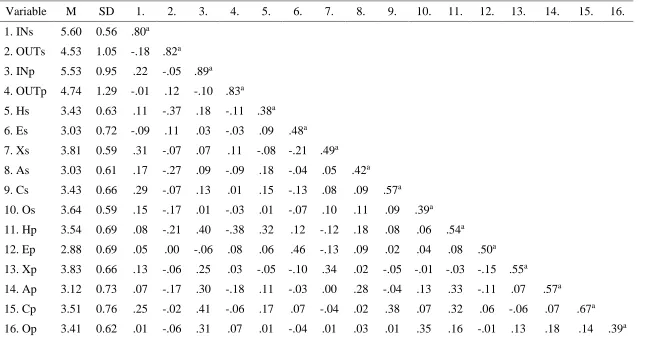
Correlational analyses. The means, standard deviations, intercorrelations, and Cronbach’s alphas for all variables are reported in Table 4. Input orientation and outcome
orientation were negatively related to each other (r = -0.12, p < .01). In regards to the Big
Five and Honesty-Humility, input orientation was positively related to Conscientiousness
(r = 0.55, p < .001), Agreeableness (r = 0.33, p < .001) Openness to experience (r = 0.15,
p < .001), Extraversion (r = 0.30, p < .001) and Honesty-Humility (r = 0.11, p < .01)
providing support for Hypotheses 1, 3a, and 4a. In addition, input orientation was
negatively related to Neuroticism (r = -0.17, p < .001). Outcome orientation was
negatively related to Conscientiousness (r = -0.14, p < .001), Agreeableness (r = -0.26, p
< .001), and Honesty-Humility (r = -0.46, p < .001), providing support for Hypotheses 2
and 4b. In addition, outcome orientation was positively related to Neuroticism (r = 0.12,
p < .05), whereas both Openness to experience (r = -0.04, ns) and Extraversion (r = 0.01,
ns) were unrelated.
In regards to the Dark Triad, input orientation was negatively related to both
Machiavellianism (r = -0.15, p < .01) and psychopathy (r = -0.28, p < .001). In addition,
input orientation was positively related to narcissism (r = 0.24, p < .001), providing
support for Hypotheses 5a, 6a, and 7a. Further, outcome orientation was positively
related to Machiavellianism (r = 0.41, p < .001), narcissism (r = 0.22, p < .001) and
psychopathy(r = 0.26, p < .001), providing support for Hypotheses 5b, 6b, and 7b.
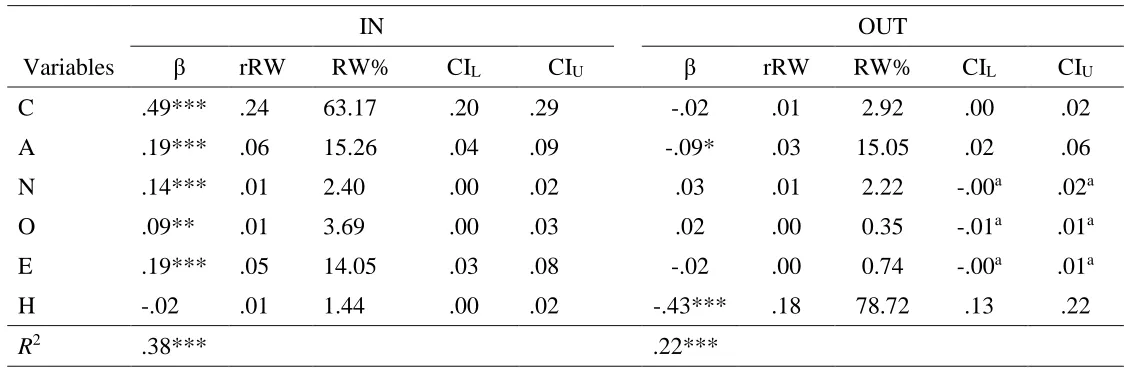
Multiple regression analyses. To further our understanding of the relations between the proposed personality models on input and outcome orientation, multiple
regression analyses were conducted to determine each model’s (i.e., Big Five and