Sentiment Analysis of Twitter Data Using Machine
Learning Approaches
Bandaru Mounika & Dr. M.S.V.S Bhadri Raju
1
M.Tech Student, Department of Computer Science and Technology,
2
Professor, Department of Computer Science and Technology,
SRKR Engineering College, Bhimavaram, West Godavari, Andhra Pradesh, India.
Abstract:
With the advancement of technology, the rapid growth of social media on Web has increased day by day. People use internet to express their views and opinions in the form of reviews, forum discussions, blogs, tweets, comments, and postings in social network sites. Individuals and organizations are increasingly using the content in these media for decision making. Twitter is a platform which is most widely used by people to express their views and sentiment in the form of tweets. Sentiment analysis is the process of finding whether a piece of text is positive, negative or neutral. The main objective of this work is to implement sentiment analysis using machine learning approaches to predict the sentiment and finally analyze the result in terms of precision, recall and f-score
.
Key words
Sentiment analysis, opinion, twitter, social media, machine learning
1. Introduction
Micro blogging sites have developed gradually and became popular tool for communication among web users in recent years. Huge amount of data is generated through computer and mobile devices and most of the data is in textual format. As there are many people who are interested in posting real time messages, opinions and reviews about different topics in day to day life. Twitter has appeared as a major social website. In 2007, twitter has 5000 tweets per day and now it is increased to 500 million tweets per day. This shows the rapid growth of twitter as it
attracted many users to convey their taste, view, opinion of any person, things in the form tweets which limits to 280 characters or less.
Tweets are the major source for individuals, business and government to find public’s sentiment or opinion concerning a topic, product, people etc. An individual consumer depends on rating and reviews before purchase. However the volume of tweets made in twitter is incredibly immense there is a requirement to automate the sentiment analysis to ease the process of determining public opinion without browsing scores for millions of tweets manually[1]. This makes many researchers to perform sentiment analysis in order to predict the positive and negative.
Sentiment analysis is to check the polarity of text. It is collectively referred as opinion mining, as a result it derives the opinion of the people regarding some topic[2]. Sentiment classification is done at document level, sentence level, and aspect level. In document level the entire document is classified as either positive negative or neutral. Neutral typically suggests that no opinion. sentence level reads every sentence and determines whether each sentence is expressed as positive negative or neutral. Aspect level or entity level performs finer-grained analysis. Instead of staring at language construct it directly looks at the opinion itself. Sentiment analysis has various applications[3] in numerous domains like online commerce, political domain, voice of the market, voice of customer government and brand reputation management.
2. Literature Review
researchers. In fact, the work in this field started since the beginning of the century[4]. In its early stage it had been intended for binary classification, that assigns opinions or reviews to bipolar categories like positive or negative.
Minara et.al[5] performed sentiment analysis for product rating by collecting the feedbacks of desired product. The main focus is collecting the data from twitter to overcome the difficulty in getting the feedback manually by people. To find probability unigram approach is used and dual prediction used for getting more accuracy. Support vector machine is used for classification of twitter data [6][4][7] and also used SVM for analyzing the twitter data. SVM requires long training time on large data sets and requires a good kernel function which is not easy.
Shulong Tan et al.[8] have proposed LDA based models to interpret the sentiment variations on twitter i.e.-LDA to distill out the foreground topics and RCB-LDA to find out the reasons why public sentiments have been changed for the target. The advantage is process out the foreground topics effectively and removes the noisy data accurately. It finds the exact reasons behind sentiment variations on twitter data using RCB-LDA model which is very useful for decision making. To determine sentiment, the sentiment analysis tools like SentiStrength and TwitterSentiment are used whose accuracy is less as compared to other sentiment analysis techniques.
Po-Wei-Liang and Bi-Ru-Dai[[15] implemented opinion mining on social media. Opinion miner is designed which integrates machine learning techniques and domain specific data. Naïve Bayes classifier is used to filter out opinion. Naïve Bayes is simple classifier and works well for text categorization[4][6][7][9]. To build the model, manually labelled data is used as training data. Manually labelled data needs more pressure to correct the data, takes more effort and physical space to keep track of data, to find information and keep them secure. It is time consuming and duplication of data entry may occur.
Sunny et.al[10] used lexicon based approach for sentiment analysis of social media. The lexicon based approach uses the dictionary order of positive and negative words. both positive and negative score is calculated for each tweet and the sum of them is overall sentiment score. Score depends on number of positive and negative words present in a tweet. Sentiment classification depends on the size of dictionary[11]. As the size of dictionary increases this will become more erroneous.
3. Need for new approach
sentiment analysis is a method of determining sentiment of a specific statement or sentence. It is a classification technique that derives opinion from the tweets. What others think about us is always an important piece of information during the decision making process. There are many approaches for sentiment analysis. Machine learning approaches use several machine learning algorithms for classification. Lexicon based approach uses dictionary of positive and negative words to identify the sentiment polarity. Hybrid approaches means combination of both machine learning and lexicon based approach. Lexicon based approach focus on number of positive words and negative words rather than the actual meaning. If a tweet has more positive words it shows positive. If a tweet has more negative words it shows negative. In some cases the positive may considered as negative. As the size of dictionary increases new words are separated to positive and negative . The separated words are sorted to dictionary order and must be added to words list and added to it becomes difficult [11]. To overcome this difficulty, machine learning approaches are used.
Machine learning approaches are well suitable for text classification. This approach learn from previous computations to produce reliable decisions and results The high value prediction that can guide better decisions and smart actions in real time without human interaction. Machine learning algorithms like Naïve Bayes, support vector machines, decision trees, random forest and maximum entropy classifiers are used for classification of tweets.
Due to lack of software availability to extract data concerning a person’s sentiment on a particular product or services of organizations and other data, people still face problems regarding the data extraction. With the increase of internet, people are using social media like twitter to show their sentiment about a particular product, people or movie. These sentiments are useful in decision making .
4. Sentiment Analysis Using Machine
Approaches
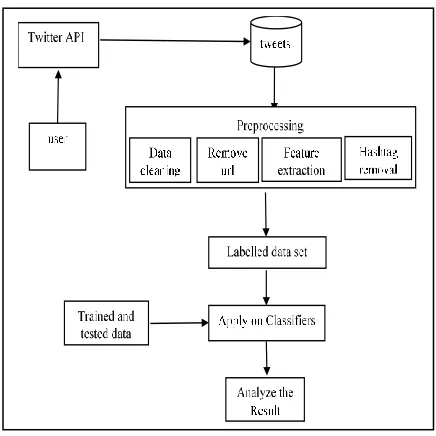
sentiment analysis is automated mining of opinions, attitudes, and emotions from speech or text. Sentiment analysis using machine learning approach uses training set to learn and to train itself. The classifiers are tested by testing data with known inputs and outputs. The steps are shown in figure 1.
Figure 1. Algorithm for sentiment analysis
4.1 Tweet Collection
To collect the data from twitter, connect to twitter API[6][10] and authorize the twitter API by access_token, access_secret, consumer_key and consumer_secret. To do this with R use packages Twitter and Rouath. Once the keys are generated, it’s easy to collect the data for a desired product or person etc.4.2 Preprocessing
The data collected from twitter contains many spelling mistakes, symbols, urls and hashtags. These data leads to poor results. To avoid this, the preprocessing step is necessary to get accurate results. All the collected data is preprocessed in figure 2. The preprocess removes all the urls, stop words, hash tags, special symbols, emoticons etc[6]. It includes syntactical correction of the tweets as required. The steps included must aim for making the data machine readable in order to reduce the difficulty in feature extraction4.2.1 Stop Word Removal Stop words that doesn’t change the meaning of the tweet are removed.
4.2.2 Url Removal User names and urls present in data are not important for the perspective of processing. Hence all the usernames and urls are removed or converted to generic tags.
4.2.3 Stemming It is a process of replacing words with their roots, in order to reduce different types of words
with same or similar meanings. This helps in reduction of dimensionality for feature set.
Figure 2. Architecture of sentiment analysis
4.2.4 Data Cleaning Digits and special characters present in tweets doesn’t show any sentiment. In some cases they were mixed with words. Removal of those words helps in association of two words. Otherwise that words are considered as different.
4.2.5 Feature Extraction After the tweets are cleaned in figure 3, we need to extract relevant features for sentiment analysis. The quality and quantity of features is important for the results generated by a model. This method extracts aspect(adjective) from dataset. Later this aspect is used to show positive and negative polarity in a sentence that helps in classifying the opinion of the people in unigram model[4]. The unigram model extracts the aspects and forms the labelled data.
Now all the cleaned data is featured extracted to form a meaning full data and the finally forms a trained data set which contains positive and negative.
Step1: Collect the data from twitter API
Step2: Preprocess the collected data
Step3: Train the models with training set
Step4: Test the models
Step5: Apply classifiers on preprocessed data
Figure 3. Steps for preprocessing of twitter data
4.3 Classifiers
Classifier is applied on the trained data set to train model and the preprocessed data is applied to find the sentiment. Models were applied on the trained data. Naïve Bayes, SVM, Maximum Entropy, Random Forest, models were applied for prediction of sentiment.Naïve Bayes
Naïve Bayes is simple and most commonly used classifier[6][11]. It uses all the features in feature vector. Naïve Bayes analyzes the feature vector individually as they are equally independent to each other. It is a probabilistic classifier, the conditional probability of Naïve Bayes is defined asP(X|yi) = πmi=1P(xi|yi)
Here ‘X’ is feature vector, it is defined as X={x1,x2…….xm}. Yj is the class label. When a
labelled is to be classified it splits the data into single word features. Naïve Bayes use probabilities , which is computed in training stage to calculate the conditional probability of combined features in order to predict class.
The main advantage of Naïve Bayes classifier is it makes use of all the evidence which is available in order to make text classification
Support Vector Machine
The support vector machine classifier is considered to be non-probabilistic binary linear classifier. Support vector machine is a supervised model[6]. This classifier uses large margins for the classification. It separates the data using a hyper plane. Support vector machine uses the concept of decision planes that defines decision boundaries.g(X)=wTϕ(X)+b
‘X’ is a feature vector, ‘w’ is a weight vector and ‘b’ is bias vector . ϕ()is nonlinear mapping from input space to high dimensional features space. Here ‘w’ and ’b’ both are learned automatically on training set . SVM can be used for the pattern recognition.
Decision tree
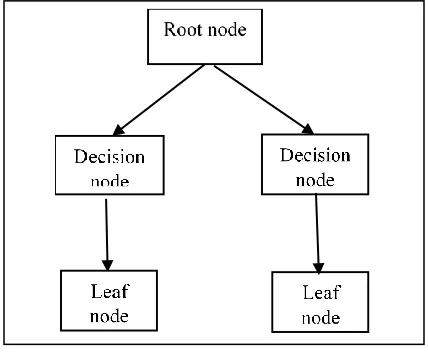
The decision tree classifier is a supervised learning algorithm which can used for both classification and regression tasks[4]. It can be adapted almost to any type of data. It divides the training data into small parts in order to identify patterns so that they can be used for classification. This algorithm is specifically used where there are many hierarchical categorical distinctions can be made[13].Figure 4. structure of decision tree
The structure of a decision tree is seen in Figure 4. It consists of root node, decision node and leaf node. The root node represents the entire data set and decision node performs computation and leaf node produces the classification. It is particularly used when there are many hierarchical categorical distinctions that can be made. In training phase, this algorithm learns what are the decisions that are to be made in order to split the labelled data into its classes. Passing Raw tweet: I am so happy right @Hazelcast been
now I can't even \ntd@@@focus anything else
against
Stop word removal: I am so happy right
@Hazel0cast now I can't even \ntd@@@focus
anything else
Url removal: I am so happy right now I can't even
\ntd@@@focus anything else
Stemming: I am so happy right now I can't even \ ntd@@@focus anything else
Data Cleaning: I am so happy right now I can't ev en focus anything else
the data through tree, a unknown instance is classified. The computation which takes place in each of the decision node usually compares the selected feature with predetermined constant, the decision will be made based on whether the feature is greater or less than the constant by creating two way split in the tree. The data will be eventually passed through these decision nodes until that reaches a leaf node which represent its assigned class.
Maximum Entropy
Maximum entropy provides a machine learning technique for prediction. This is also known as multinomial logistic model. The maximum entropy maximizes the entropy that is defined on the conditional probability distribution. It can even handles the overlap feature and is same as the logistic regression which finds the distribution over classes. It also follows some certain feature constraints[4].PME(c|d,λ)=exp[∑ 𝑖 𝜆𝑖𝑓𝑖(𝑐, 𝑑)]/
∑ 𝑒𝑥𝑝𝑐 [∑ 𝑖 𝜆𝑖𝑓𝑖(𝑐, 𝑑)]
‘C’ is the class, ‘d’ is the sentence, λ is the weight vector whereas, the weight vector calculates the importance of a feature. More weight denotes that a particular is strong enough in class.
Random Forests
Random forests are an ensemble learning method for classification that performs with the help of building a large number of selection trees at training time and outputting the class that is process for the training output through individual trees. It produces multi-altitude selection trees at input phase and output is generated inside within the form of multiple decision trees. The correlation among trees is reduced by randomly deciding on trees and as a result the prediction strength will increase and results to boom in performance. [12] predictions are made by aggregating the predictions of various ensemble information units.Finally, cross validation is done among the models to check the accuracy for each model and the result is analyzed using parameters Precision, Recall and F-score
5. Parametric Evaluation
The proposed system replaces the lexicon based approach with machine learning approaches. The analysis is done in Naïve Bayes and accuracy is compared with other approaches such as SVM Random Forest , Decision Trees, and Maximum Entropy.
True positive and true negatives are the observations that are correctly predicted.
❖ True Positives (Tp) – Case was Positive and Predicted Positive
❖ True Negatives (Tn) – Case was Negative and Predicted Negative
❖ False Positives (Fp) - Case was Negative but Predicted Positive
❖ False Negatives (Fn) - Case was Positive but Predicted Negative
The result is produced in terms of Precision, Recall, F-score, and Accuracy.
Precision
Precision is how consistent the results are when measurements are repeated. Simply precise is repeating(or repeatable). In other words Precision is the ratio of correctly predicted positive observations to the total predicted positive observations[11][4].P=Tp/(Tp+Fp)
High precision means you provide only what you have to (maintain advantage) and keep its costs down by reviewing only what you should.
Recall(Sensitivity)
Recall is the ratio of correctly predicted positive observations to the all observations in actual class[11]. Recall is measured by the number of correct predictions over the total number of true positives and false negatives. Recall in this context is also referred to as the true positive rate or sensitivity, and precision is also referred to as positive predict value (PPV)R= Tp/(Tp+Fn)
High recall ensures you have what you need to produce(compliance) and, as important, what you need to win.
F-Score
F-Score is the weighted average of Precision and Recall. Therefore, F-Score takes both false positives and false negatives into consideration. "F-score is not as simple to understand as accuracy, but it is lot more useful than accuracy, particularly if you have got a uneven class distribution. Accuracy works best in cases like if the false positives and the false negatives have similar cost.F=2PR/P+R
F-score reaches its best value 1 and worst at 0.
correctly predicted observations to the total number of observations. If we have high accuracy then that model is best.
A model has high accuracy means it is close to real value. If low accuracy means then it is far or nearby to real value.
Accuracy = (Tp+Tn)/(Tp+Fp+Fn+Tn) Accuracy and precision are two important factors to consider when taking data measurements. Both accuracy and precision reflect how close a measurement is to an actual value, but accuracy reflects how close to measurements is to a known or accepted value. While precision reflects how reproducible measurements are, given if they are far from the accepted value.
Cross-validation
cross-validation avoids overlapping of test sets. It consists of two steps•First step: data is split into K subsets of equal size
•Second step: Each subset in turn is used for testing and the remainder for training.
This is called k-fold cross validation. The cross-validation can be done in one fold or more like 10 fold. More fold means that extensive experiments have shown that this is best choice to get an accurate estimate.
6. Implementation
Machine learning approaches like Naïve Bayes, Support Vector Machine, Random Forest, Decision Tree and Maximum Entropy are used. Initially the models were trained with training set of 2000 tweets. After training the preprocessed data is applied on the model. Out of 3000 tweets 260 tweets were removed 2680 are true negatives and160 were true positives. The overall accuracy is 94.6.
Naïve Bayes
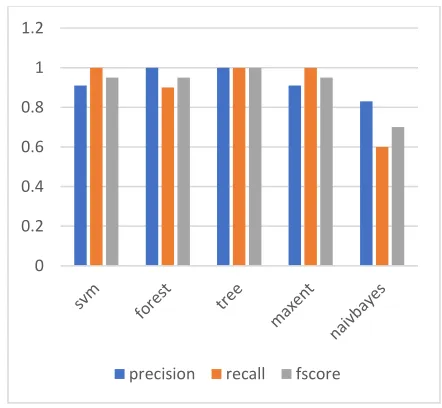
From the table 1 Naïve Bayes precision is 0.83 and recall is 0.6. Precision is high and recall is low. Most of its predicted labels are correct.SVM
From the table:1 SVM precision is 0.91 and the recall is 1.0. The precision is low and recall is high. Most of its predicted labels are incorrect.Random Forest
In this, the precision is 1.0 and recall is 0.9. Here precision is high and recall is low. Most of its predicted labels are correct.Decision Trees
The Decision Tree precision is 1 and recall is 1. Both precision and accuracy are high which results in all labels are correct.Maximum Entropy
The precision for Maximum Entropy is 0.91 and recall is 1. The precision is low and recall is high. Most of its predicted labels are incorrectF-Score
The F-score for Naïve Bayes is 0.7 represent least value.The SVM, Random Forest, and Maximum Entropy has F-score 0.95 represent average value.
Table 1. Precision, Recall and F-score values Name of
model
Precision Recall F-Score
Naïve Bayes 0.83 0.6 0.7
SVM 0.91 1.0 0.95
Random Forest
1.0 0.9 0.95
Decision Tree
1 1 1
Maximum Entropy
0.91 1.0 0.95
Decision tree is having best f-score when compared to all models shown in figure 5
.
Figure 5. Graph for parameters 0
0.2 0.4 0.6 0.8 1 1.2
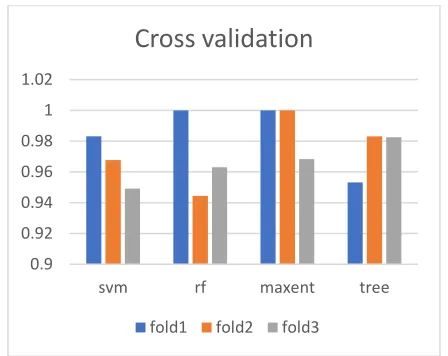
The cross validation for the applied models are shown in the figure 6. The SVM and Random forest results vary in every fold. The result for Maximum Entropy and Decision Tree is same for 2 folds and vary for 1 fold. Same results for every fold represents best efficiency of algorithm. From the figure 6 the Maximum entropy and Decision tree have best efficiency.
Figure 6. cross validation graph
7. Conclusion
The present work focuses on sentiment analysis using machine learning approaches. The model needs training by using a dataset from collected data. The approaches can be applied to unknown data after training. The approaches like Naïve Bayes, Support Vector Machines, Decision Tree, Random Forest and Maximum Entropy are implemented. The Naïve Bayes algorithm is mainly focus and the result is compared with other models in terms of precision, recall and F-Score. Among all these, decision tree scores the highest value.
References
[1] Anuja P Jain and Padma Dandannavar “Applications of Machine Techniques to Sentiment Analysis”, In 2nd
International Conference on Applied and Theoretical Compputing and Communication Technology (iCATccT) 978-1-5090-2399-8/16 IEEE-2016.
[2] Bholane Savita Dattu, and Deipali V.Gore "A Survey on Sentiment Analysis on Twitter Data Using Different Techniques", In (IJCSIT) International Journal of Computer
Science and Information Technologies, Vol.6(6), 2015, 5358-53562.
[3] Mr. Saifee Vohra and Jay Teraiya “Applications and Challenges for Sentiment Analysis: A Survey”, In (IJERT) international Journal of Engineering Research & Technology ISSN: 2278-0181, Vol. 2 Issue2, February 2013.
[4] Geetika Gautam, Divakar yadav " Sentiment Analysis of Twitter Data Using Machine Learning Approaches and Semantic Analysis ", In IEEE Contemporary Computing (IC3), 2014 Seventh International Conference on 7-9 Aug. 2014 .
[5]Minara Panto, Mejo Antony, Muhssina K M, Nivya Johny, Vinay James, Aswathy Wilson " PRODUCT RATING USING SENTIMENT ANALYSIS ", In
International Conference on Electrical, Electronics, and Optimization Techniques(ICEEOT)-2016.
[6] Dr.Bhumika Gupta, Monika Negi,Kanika Vishwakarna, Goldi Rawat, Priyanka Badhani " Study of Twitter Sentiment Analysis using Machine Learning Algorithms on Python ", International Journal of Computer Applications(0975-8887),Volume 165-No.9, May 2017.
[7]Neethu M S and Rajashree R “sentiment analysis in twitter using machine learning techniques” IEEE - 31661,
4th ICCCNT 2013.
[8] Shulong Tan, Yang Li, Huan Sun, Ziyu Guan, Xifeng Yan, “Interpreting the Public Sentiment Variations on Twitter”, IEEE Transactions on Knowledge and Data Engineering, VOL. 26, NO.5, MAY 2014.
[9] Seyed-Ali Bahrainian and Andreas Dengel, “Sentiment Analysis and Summarization of Twitter Data",
Computational Science and Engineering (CSE), 2013 IEEE 16th International Conference on.3-5 Dec. 2013.
[10]Sunny Kumar, Paramjeet Singh, Shaveta Rani " Sentimental Analysis of Social Media Using R ", 2016 5th International Conference on Reliability, Infocom Technologies and Optimization (ICRITO) (Trends and Future Directions), Sep. 7-9, 2016, AIIT, Amity University Uttar Pradesh, Noida, India.
[11] Anurag P.Jain, Mr. Vijay D.Katkar " Sentiments Analysis Of Twitter Data Using Data Mining ", 2015 International Conference Information Processing(ICIP) Vishwakarma Institute of Technology,Dec 16-19,2015.
[12] Kushall Pal Singh and Sanjay Agrawal “Sentiment Classification using Machine Learning: A Survey”, In
International Journal on Recent and Innovation Trends in Computing and Communication ISSN: 2321-8169 (IJRITCC) Volume: 5 Issue: 5 May 2017
[13] Pratishtha Parashar, Sanjiv Sharma " A Literature Review on Architecture, Classification Technique and Challenges of Sentiment Analysis ", In International 0.9
0.92 0.94 0.96 0.98 1 1.02
svm rf maxent tree
Cross validation
Journal of Engineering Research & Technology (IJERT),
vol.5 Issue 05,May-2016.
[14] Priyanka Patil, Pratibha Yalagi " Sentiment Analysis Levels and Techniques: A Survey " , In International Journal of Innovations in Engineering and Technology(IJIET) ,Volume 6 Issue 4 April 2016.