A Study on the progressive of SBI mutual fund scheme
Mahindra H.R, Lecturer, department of commerce, Alva's degree college, Moodabidri. Email: [email protected]
Ashoka K.G, Assistant Professor, Department of Commerce, [email protected]
Introduction:
Although a large number of studies have
been carried out on the growth and
financial performance of mutual funds in
India (Boston Analytics, 2010), (PWC,
2013), not much light has been shed on the
causes for the low penetration of mutual
funds outside the top fifteen cities. There is
research looking at the causes for the
variation of mutual funds industry across
developed countries. However, such work
typically does not differentiate between the
various regions of the nations included
(Khorana et al., 2005). While such studies
may help policymakers in determining the
ideal inter-regional macroeconomic
conditions to develop a healthy mutual
fund industry, they rarely explain the
differences in mutual fund penetration
within a country.
Mutual fund is an instrument for pooling the assets by issuing units to the financial
specialists and putting reserves in
securities as per targets as unveiled in offer report. Interests in securities are spread over a wide cross-segment of enterprises and parts and in this manner the hazard is decreased. Enhancement decreases the
hazard since all stocks may not move in a similar heading in a similar extent in the meantime. Common store issues units to the speculators as per quantum of cash contributed by them. Financial specialists of common assets are known as unit holders.
The benefits or misfortunes are shared by the financial specialists in extent to their ventures. The shared subsidizes regularly turn out with various plans with various
speculation destinations which are
propelled occasionally. A shared store is required to be enlisted with Securities and Exchange Board of India (SEBI) which manages securities advertises before it can gather reserves from people in general.
Usual funds are considered as one of the best available investment options as compare to others alternatives. They are very cost efficient and also easy to invest in. The biggest advantage of mutual funds is they provide diversification, by reducing risk & maximizing returns.
SBI Blue chip:
outperform its benchmark. These traits have results in regular money flow into this fund, which has also grown the assets it manages significantly in recent years.
Background of the study:
The SBI Blue chip was the scheme which provides the conservative growth and the study has been conducted to know the performance of the SBI Blue chip over the period of time.
Literature review
Tversky.A and Kahneman
D(1974)[1] identify that “the decision
making process is not a strictly rational
one, where all relevant information is
collected and objectively evaluated, rather,
the decision maker takes mental ‘short cut’ in the process.”
Plummer(1974)[2] focused on
“building life style profiles in relation to
the stage of products and financial services
like commercial bank credit cards. A study
conducted by Verma A and Hanspal 1999
revealed that the whole creative process of
an advertisement was influenced by the
lifestyle the advertiser eventually chose to
reach. Studies dealing with the lifestyle
characteristics of individual investors are
not many in number.”
Cohn R A et.al (1975) [3] made an
attempt to explain “the attributes and
attitudes of individual investors and also
conducted a study to examine the
individual investor’s risk aversion and portfolio composition.”
Lewellen(1977) [4]found that “age,
gender, income and education affects
investors preferences and attitudes towards
investment decision.”
Objectives
1. To study the fund allocation in SBI Blue chip Scheme.
2. To study the bench mark of the schemes
3. To study the holdings of the mutual fund
4. To study sector of investment Methodology
This study was conducted based on the secondary data based on the past performance of the company and it is analysed by using percentages.
Analysis
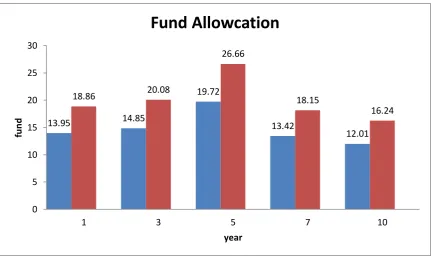
Table 1: showing the fund allocation of SBI Blue chip Scheme
Year Fund (in lakhs ) Percentage
1 13.95 18.86
3 14.85 20.08
7 13.42 18.15
10 12.01 16.24
Total 73.95 100
Chart 1: Showing the fund allocation of SBI Blue chip Scheme
Source: secondary data
Interpretation: The fund in this scheme vary from year to year here is no constant increment in the fund but the fund invested
will be in the beginning year 18.86% and it was increased till 5year then it was started decreasing.
Table 2: Showing the bench mark fixed by the SBI
Year Bench mark (in Lakhs) Percentage
1 15.27 27.62
3 8.47 15.32
5 13.64 24.67
7 8.62 15.59
10 9.28 16.78
Total 55.28 100
13.95 14.85
19.72
13.42
12.01
18.86 20.08
26.66
18.15
16.24
0 5 10 15 20 25 30
1 3 5 7 10
fu
n
d
year
Chart 2: Showing the bench mark fixed by the SBI
Source: secondary data
Interpretation: The blue chip companies are volatile in nature therefore the expectation from the market also average. In this scheme the bench mark fixed will
be vary from year to year in the first year it was 15.27 lakhs and it was decreased in
the 10th year.
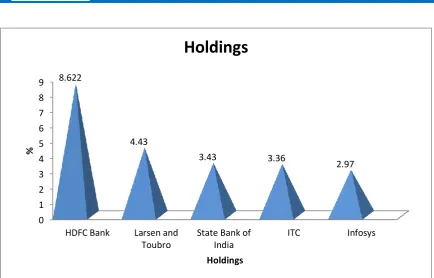
Table 3: showing the holding of the scheme
Holdings %
HDFC Bank 8.62
Larsen & Toubro 4.43
State Bank of India 3.43
ITC 3.36
Infosys 2.97
Chart 3: showing the holding of the scheme 0
10 20 30
1 3
5 7
10
b
en
ch
m
ark
fi
xe
d
year
Source: secondary data
Interpretation: The Company hold the fund in the different companies but to avoid the market fluctuation the majority of the
holdings was made in the banking sector. Out of total investment 8.622 was made in the HDFC Bank.
Table 4: showing the sector of holdings
Sectors %
Financial 32.07
Automobile 10.35
Construction 7.71
Energy 751
Healthcare 6.84
Chart 4: showing the sector of holdings 0
1 2 3 4 5 6 7 8 9
HDFC Bank Larsen and Toubro
State Bank of India
ITC Infosys
8.622
4.43
3.43 3.36
2.97
%
Holdings
Source: secondary data
Interpretation: To average the return of the investor the fund manager allocated the fund in the five major sectors in that finance sector is one of the major sector because 32.07% was made in that particular sector when compare to other sector it is one of the strongly yielding sectors.
Findings of the study
1. This study reveals that the fund allocated from the year to the year is decreasing
2. The bench marks were fixed based on the market condition.
3. The majority of the fund where allocated in the finance sector.
4. The HDFC Bank holds the highest percentage.
Suggestion
1. It is better the company has to take the steps to increase the bench marks of return by
using suitable measures.
2. The fund holing are more in the banking sectors but this sectors gives less return
when compare to the other sectors and it is better that company should have an alternative measure .
3. Most funds are in the finance sectors if any market games takes place the entire
investment will be affected therefore company can plan for moderate allocation.
Conclusion:
0 5 10 15 20 25 30 35
Financial Automobile Construction Energy Healthcare 32.07
10.35 7.71 7.57
%, 6.84
%
Sectors
The conservative growth is very important for the investor to get better return in the future days in this way the blue chip scheme provides the conservative growth for the investor by investing funds in the various companies. In this scheme investment are made in same sector to the riskier sector to get the moderate return to the investors. Therefore it is important for the company to create awareness among the investor about the scheme and it should be upgraded from year to year.
Bibliography
1. Tversky A and Kahneman. D, “Judgment under Uncertainty: Heuristics and
biases”, science (185), pp 1124-1131. 1974.
2. Plummer Joseph T, “The Concept and Application of Life Style Segmentation”,
Journal of marketing, pp37-38. 1974.
3. Cohn.R.A, W.G.Lewellen, R.C.Lease and G.G. Schlarbaum , “Individual Investors
Risk Aversion And Investment Portfolio Composition”, Journal of Finance,
XXX(2), pp 605-620, 1975.
4. Lewellen. W.G., Lease R C and Schlarbaum G G “Pattern of Investment Strategy
and Behaviour among Individual Investors”, Journal of Business, Vol.50, pp
296-333. 1977.
A Study on Performance of Franklin India Balanced scheme mutual fund
Dr.C.Mugunthan & Mr. Sharath Prabhu
Research Supervisor, Department of Commerce, Periyar University ,Dharmapuri
Research Scholar, Department of Commerce, Periyar University , Dharmapuri
[email protected] & [email protected]
Introduction
A mutual fund is a professionally-managed investment scheme, usually run by an asset management company that brings together a group of people and invests their money in stocks, bonds and other securities. It is a general belief that Mutual Fund is a retail product which is so designed for those who do not directly invest in share market because of its unpredictable and volatile nature, but fascinated by the growth and returns given by the same market. After the announcement of 1991’s liberalisation policy the growth of Indian economy is miraculous and per capita income has also increased. During last two decades growth of upper middle and middle class in India is also fabulous and this is the group who due to increase in income has enormous and changing needs, is targeted by all most all mutual fund companies but it is seen that this mutual fund companies are not succeed enough to turn savings individual investors in their products.
Franklin India Balanced scheme mutual fund
The balance fund gives the growth and income for the investment such investment scheme gives the benefit of both return and growth. To beat the market the investors takes a very low risk for
diversification. The most of diversification is based on debt equity mix. The fund is well diversified with 50 stocks.
Literature review
Woerheide (1982) conducted a study on “investor response to suggested criteria for
size of fund, effectiveness of marketing programe and past return of funds have great impact.
Among these the effectiveness of marketing program has strong impact.”
De Bondt and Thaler (1985) while investigating “the possible psychological basis
for investor behavior, argue that mean reversion in stock prices is an evidence of investor
over reaction where investors over emphasize recent firm performance in forming future
expectations.”
Bailard et al., (1986) model classifies investors according to two personality traits;
level of confidence and the method of action. Level of confidence is reflected in how much
an investor may worry about a certain course of action or decision. Investors may range from
confident to anxious. Method of action is reflected in how methodical investors are, as well
as how analytical and intuitive they are. This can range from careful to impetuous. Within
these ranges, the model defines four personalities:
1. Individualist: Careful, confident and often takes a do-it-yourself approach
2. Adventurer: Volatile, entrepreneurial and strong-willed
3. Celebrity: Follower of the latest investment fad
4. Guardian: High risk averse and wealth preserver
Ferris and Chance (1987) examined “the fund selection ability of mutual fund
investor and found that the investors’ decisions are based on short-term future performance
and they use fund –specific information in their selection decision.”
Lee and Rahman (1989) examined market timing and selectivity performance of
selected mutual funds. The data for the study consisted of monthly returns for 87 months
during January 1977 to March 1984 for 93 mutual funds. They concluded that “at the
individual level, there was some evidence of superior forecasting ability on the part of fund
manager.” This result had an important implication in those funds with no forecasting skills
might consider a totally passive management strategy and just provide a diversification
service to their shareholders.
1. To study the fund allocation in Franklin India Balance Scheme. 2. To study the bench mark of the schemes
3. To study the holdings of the mutual fund 4. To study sector of investment
Analysis
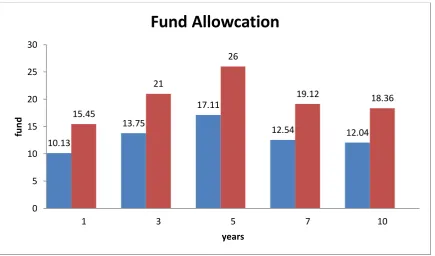
Table 1: Showing the fund allocation over the years
Years Fund Percentage
1 10.13 15.45
3 13.75 21
5 17.11 26
7 12.54 19.12
10 12.04 18.36
Total 65.57 100
Chart 2: Showing the fund allocation over the years
Interpretation: The company fund was not constant from year to year it was 18.61 in the first year and it was dropped in the 3 and 5 year and then onwards started increasing.
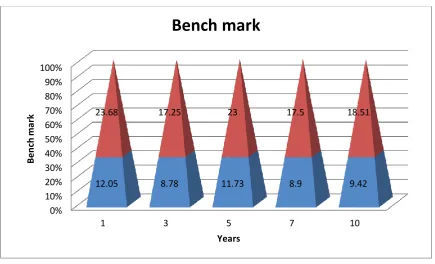
Table 2: Showing the bench mark of the mutual fund scheme
Year Bench mark Percentage
1 12.05 23.68
3 8.78 17.25
10.13
13.75
17.11
12.54 12.04
15.45
21
26
19.12 18.36
0 5 10 15 20 25 30
1 3 5 7 10
fu
n
d
years
5 11.73 23
7 8.90 17.5
10 9.42 18.51
Total 50.88 100
Chart 2: Showing the bench mark of the mutual fund scheme
Interpretation: The bench mark will vary according to the investment made in the mutual fund schemes. The fund has different bench marks and in the 1 year it was 12.05 lakhs and it was decreased in the 3 year.
Table 3: Showing the fund holdings of mutual fund scheme.
Holdings Percentage
HDFC Bank 5.28
Larsen and Toubro 3.84
Reliance Industries 3.56
ITC 3.06
ICICI Bank 2.07
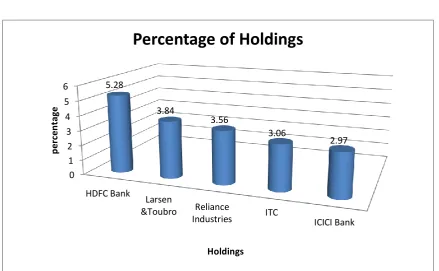
Chart 3: Showing the fund holdings of mutual fund scheme.
0% 10% 20% 30% 40% 50% 60% 70% 80% 90% 100%
1 3 5 7 10
12.05 8.78 11.73 8.9 9.42
23.68 17.25 23 17.5 18.51
B
en
ch
m
ark
Years
Interpretation: The Company holds the fund in five different companies it varies from Banking sectors to IT. The companies are diversifying for the purpose of balancing the funds of the investors there for the holdings are more in the banking sector and less in the other sector.
Table 4: Showing the sector of the investment
Sectors Percentage of investments
Finance 21.02
Energy 8.12
Automobile 5.53
FMCG 5.49
Construction 4.86
Chart 4: Showing the sector of the investment
0 1 2 3 4 5 6
HDFC Bank
Larsen
&Toubro Reliance
Industries ITC ICICI Bank 5.28
3.84
3.56
3.06
2.97
p
erc
en
ta
ge
Holdings
Interpretation: There are five sectors were selected to diversify the investment. There are more investments are made in the financial sector that is 21.02 and less in the construction sectors that is 4.86%.
Findings
1 .The mutual fund scheme investment is not constant it vary from year to year. 2. The bench mark fixed by the company also vary from the year to the year 3. The more holding in the banking sector and less in the other sector.
4. Financial sector has the more percentage of investment than other sectors.
Suggestion
1. The company should see the investment in particular sector should increase year by years 2. The bench mark also should increase therefore the company can make scheme attractive. 3. The company also holding more in bank and less in the other sector to increase the return to
the investor it should see the alternative method.
4. The spectral rotation should be used to maximise the return.
0 5 10 15 20 25
Finance
Enery
Automobile
FMCG
Construction 21.02
8.12
5.53
5.49
4.86
P
erc
en
ta
ge
o
f
In
ve
st
m
en
ts
Sector
Conclusion
The investment in mutual fund gives average return to the investors in this type of investment
not only high net worth individual but also low and middle income people invest to get the
future benefits. The Franklin India Balanced scheme mutual fund gives the benefits of both
income and capital appreciation to the investor and the fund manner of the investor
diversifies in such a manner the return will maximizes when compare to other investment like
bank deposits and money market.
Bibliography
1. Woerheide, W. "Investor response to suggested criteria for the selection of mutual
funds", Journal of Financial and Quantitative Analysis: pp 129-137. 1982.
2. De Bondt, W.F.M. and Thaler, R, “Does the stock market over react?” Journal of
Finance, 40, 793-805. 1985
3. Bailard et al., “Behavior among Individual”, Financial Analysts Journal, (1986).
4. Ferris S P and Chance D M, “The Effect of 12b-1 Fee on Mutual Fund Expense
Ratio: A Note”, The Journal of Finance, Vol. 42, pp 1077-1082. 1987
Lee, Cheng-Few and Sahfiqur Rahman , “Market Timing, Selectivity and Mutual
Fund Performance: An Empirical Investigation”, Journal of Business, No. 21, pp. 261-278.
A study on performance Mutual fund of Aditya Birla Sun Life Frontline Equity.
Dr.C.Mugunthan & Mr. Sharath Prabhu
Research Supervisor, Department of Commerce, Periyar University ,Dharmapuri
Research Scholar, Department of Commerce, Periyar University , Dharmapuri
[email protected] & [email protected]
Introduction
Mutual fund is an instrument for pooling the assets by issuing units to the financial specialists and putting reserves in securities as per targets as unveiled in offer report. Interests in securities are spread over a wide cross-segment of enterprises and parts and in this manner the hazard is decreased. Enhancement decreases the hazard since all stocks may not move in a similar heading in a similar extent in the meantime. Common store issues units to the speculators as per quantum of cash contributed by them. Financial specialists of common assets are known as unit holders.
The benefits or misfortunes are shared by the financial specialists in extent to their ventures. The shared subsidizes regularly turn out with various plans with various speculation destinations which are propelled occasionally. A shared store is required to be enlisted with Securities and Exchange Board of India (SEBI) which manages securities advertises before it can gather reserves from people in general.
Usual funds are considered as one of the best available investment options as compare to others alternatives. They are very cost efficient and also easy to invest in. The biggest advantage of mutual funds they provide diversification, by reducing risk & maximizing returns.
The policy is flexibility to invest and buy and hold strategies and a buy and hold strategy well for the investors who stay invest in this fund for the long run. A well diversified fund with holdings of about 70 stocks, along with a stable management team backed by performance makes it a good choice to invest in.
Review of literature
Friend, et al., (1962) made a broad and methodical investigation of 152 common assets found that shared reserve plans earned a normal yearly return of 12.4 percent, while their composite benchmark earned an arrival of 12.6 percent. Their alpha was negative with 20 premise focuses. General outcomes did not propose boundless wastefulness in the business. Examination of store comes back with turnover and cost classifications did not uncover a
solid relationship.
Williamson (1972) thought about positions of 180 supports between 1961-65 and 1966-70. There was no relationship between's the rankings of the two periods. The speculation capacities of a large portion of the reserve chiefs were indistinguishable. He highlighted the developing unmistakable quality of instability in the estimation of venture hazard.
Klemosky (1973) examined speculation execution of 40 assets in light of quarterly returns amid the period 1966-71. He recognized that, predispositions in Sharpe, Treynor, and Jensen's measures, could be expelled by utilizing mean supreme deviation and semi-standard deviation as hazard surrogates contrasted with the composite measures got from the CAPM (Capital Asset Pricing Modal).
Objectives
1. To study the fund invested by the company.
2. To study the benchmark fixed for the fund invested. 3. To study the sector investment made by the company. 4. To study the holdings of the company.
Methodology
This study has been conducted based on the secondary data collected from various reports of the companies.
Analysis
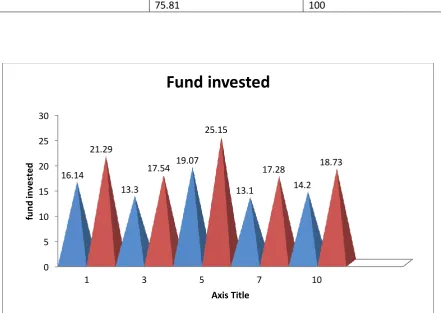
Year Fund invested (Rs in Lakh) Percentage
1 16.14 21.29
3 13.30 17.54
5 19.07 25.15
7 13.10 17.28
10 14.20 18.73
75.81 100
Interpretation: The investment made by the Aditya Birla Sun Life Frontline Equity varies from one year to ten years. Initial years it is more and during 3year and 7 years it was declined and then it was increased.
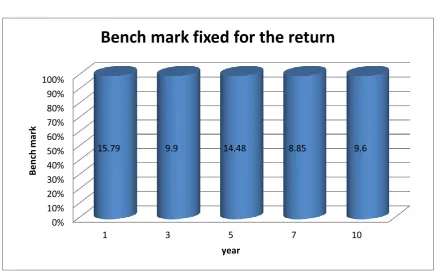
Table 2: Showing the Bench Mark fixed for the return
Year Bench mark(%)
1 15.79
3 9.90
5 14.48
7 8.85
10 9.60
Chart 2: Showing the Bench Mark fixed for the return
0 5 10 15 20 25 30
1 3 5 7 10
16.14
13.3
19.07
13.1 14.2
21.29
17.54
25.15
17.28 18.73
fu
n
d
in
ve
st
e
d
Axis Title
Interpretation: The Company has the expectation from the diversification which company has made. It was varying from the year to year and the fund invested. The expected return is more from year to years.
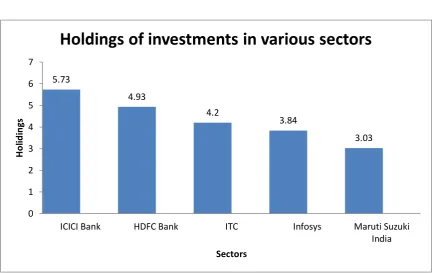
Table 3: Showing the holdings of the company in various sectors.
Company % of Holdings of the various sectors
ICICI Bank 5.73
HDFC Bank 4.93
ITC 4.20
Infosys 3.84
Maruti Suzuki India 3.03
Charts 3: Showing the 5 sector of investment
0% 10% 20% 30% 40% 50% 60% 70% 80% 90% 100%
1 3 5 7 10
15.79 9.9 14.48 8.85 9.6
B
en
ch
m
ark
year
Introduction: The fund has five sectors and the company hold more of its investment in Banking, IT and Automobile. Out this three banking sectors shows the more investment among five sectors. Table 4: Showing the 5 sector investment
Sector % of Investment
Finance 34.99
Automobile 10.61
FMGC 10.13
Energy 9.05
Technology 7.44
Chart 4: Showing the 5 sector investment
5.73
4.93
4.2
3.84
3.03
0 1 2 3 4 5 6 7
ICICI Bank HDFC Bank ITC Infosys Maruti Suzuki
India
H
o
lid
in
gs
Sectors
Interpretation: The company invest its fund in 5 different sectors and out of the different sectors automobile and FMGS are invested more when compare to other sectors.
Findings
1. The company invested in the various sector from one to 10 years therefore there is no constant investment.
2. The bench mark fixed by the company was not constant.
3. The company invest fund in five sectors and it was found that there was no equal investment.
4. The fund has allocated there fund in FMGC and Automobile sectors. Suggestion
1. The company has to maintain constant investment in various sectors. 2. The bench mark should be increased by year to year.
3. Diversification should be made in different sectors. 4. The scrotal rotation should happen in the sector. Conclusion
0 5 10 15 20 25 30 35
finance automobile FMGC Energy Technology
34.99
10.61 10.13 9.05 7.44
%
o
f
in
ve
st
m
en
t
Sectoral investment
1. Kirkire, S. (2013). It is about time in the market and not timing the market. (L. P. Barbora, Interviewer) HT Mint, August 09.
2. Massa, M., Goetzmann, W. N., & Rouwenhorst, G. K. (1999). Behavioral
Factors in Mutual Fund Flows. Yale ICF Working Paper No. 00‐14 , 42.
3. www.sebi.gov.in
4. Annual Report, 2011-12, SEBI
5. “Indian Mutual Fund Industry-Towards 2015”, CII, 6th Mutual Fund Summit,
2012