Choosing the target difference (“effect size”) for a randomised
controlled trial - DELTA
2guidance
Guidance for researchers and funder representatives
Version 5.0: 20-8-2018
[FINAL PREPRINT VERSION]
AUTHORS
Jonathan A Cook,1 [email protected] Associate Professor
Centre for Statistics in Medicine
Nuffield Department of Orthopaedics, Rheumatology and Musculoskeletal Sciences University of Oxford
Botnar Research Centre Nuffield Orthopaedic Centre Windmill Rd
Oxford, OX3 7LD
Steven A Julious, [email protected] Professor
Medical Statistics Group, ScHARR The University of Sheffield
1 Regent Court, 30 Regent Street
SHEFFIELD S1 4DA
William Sones [email protected] Statistician
Centre for Statistics in Medicine
Nuffield Department of Orthopaedics, Rheumatology and Musculoskeletal Sciences University of Oxford
Botnar Research Centre Nuffield Orthopaedic Centre Windmill Rd
Oxford, OX3 7LD
Lisa V Hampson, [email protected] Associate Director
Statistical Methodology & Consulting, Novartis, Basel, Switzerland
&
Department of Mathematics and Statistics Lancaster University
Lancaster UK, LA1 4YF
Catherine Hewitt, [email protected] Professor
Department of Health Sciences, Seebohm Rowntree Building University of York, Heslington, York, YO10 5DD, UK
Jesse A Berlin, [email protected]
Vice President and Global Head of Epidemiology Johnson & Johnson
1125 Trenton-Harbourton Road Titusville, New Jersey 08933 United States
Deborah Ashby, [email protected] Co-Director, Imperial Clinical Trials Unit
Deputy Head, School of Public Health Imperial College London
Stadium House, 68 Wood Lane London, W12 7RH
Richard Emsley, [email protected] Professor
Department of Biostatistics and Health Informatics Institute of Psychiatry, Psychology and Neuroscience King’s College London
2 Dean A Fergusson, [email protected]
Senior Scientist & Director, Clinical Epidemiology Program,
Ottawa Hospital Research Institute, Ottawa, ON, Canada
Stephen J Walters, [email protected] Professor
Medical Statistics Group, ScHARR The University of Sheffield Regent Court, 30 Regent Street Sheffield, S1 4DA
Edward CF Wilson, [email protected] Senior Research Associate in Health Economics
Cambridge Centre for Health Services Research & Cambridge Clinical Trials Unit University of Cambridge
Institute of Public Health Forvie Site, Robinson Way Cambridge, CB2 0SR
Graeme Maclennan, [email protected] Director & Professor
The Centre for Healthcare Randomised Trials (CHaRT) Health Sciences Building
University of Aberdeen
Foresterhill, Aberdeen, AB25 2ZD
Nigel Stallard [email protected] Professor
Warwick Medical School - Statistics and Epidemiology University of Warwick
Coventry, CV4 7AL
Joanne C Rothwell, [email protected] PhD student
Medical Statistics Group, ScHARR The University of Sheffield
Regent Court, 30 Regent Street, Sheffield, S1 4DA
Martin Bland, [email protected] Professor
Department of Health Sciences, Seebohm Rowntree Building University of York,
Heslington, York, YO10 5DD, UK
Louise Brown [email protected] Senior Statistician
MRC Clinical Trials Unit at UCL
3 Craig R Ramsay, [email protected]
Director & Professor
Health Services Research Unit University of Aberdeen Health Sciences Building Foresterhill
Aberdeen, AB25 2ZD
Andrew Cook, [email protected]
Consultant in Public Health Medicine and Fellow in Health Technology Assessment Wessex Institute, University of Southampton
Alpha House, Enterprise Road, Southampton, SO16 7NS
David Armstrong, [email protected] Kings College London Professor
School of Population Health & Environmental SciencesFaculty of Life Sciences and Medicine Addison House, Guy’s Campus, London, SE1 1UL
Doug Altman, [email protected] Professor
Centre for Statistics in Medicine
Nuffield Department of Orthopaedics, Rheumatology and Musculoskeletal Sciences University of Oxford
Botnar Research Centre Nuffield Orthopaedic Centre Windmill Rd, Oxford, OX3 7LD
Luke David Vale, [email protected] Professor
Health Economics Group Institute of Health & Society Newcastle University
Newcastle upon Tyne, UK, NE2 4AX
1 Corresponding author
Keywords
Target difference, clinically important difference, sample size, guidance, randomised trial, effect size, realistic difference
4 Acknowledgments
This project was funded by the Medical Research Council-National Institute for Health Research Methodology Research Programme in the UK in response to a commissioned call to lead a workshop on this topic in order to produce guidance. The members of the original DELTA (Difference ELicitation in TriAls)2 group were:
Associate Professor Jonathan Cook, Professor Doug Altman, Dr Jesse Berlin, Professor Martin Bland, Professor Richard Emsley, Dr Dean Fergusson, Dr Lisa Hampson, Professor Catherine Hewitt, Prof Craig Ramsay, Miss Joanne Rothwell, Dr Robert Smith, Dr William Sones, Professor Luke Vale, Professor Stephen Walters, and Professor Steve Julious.
As part of the process of developing the guidance, a two-day workshop was held in Oxford in September 2016. The workshop participants were:
Professor Doug Altman, Professor David Armstrong, Professor Deborah Ashby, Professor Martin Bland, Dr Andrew Cook, Professor Jonathan Cook, Dr David Crosby, Professor Richard Emsley, Dr Dean Fergusson, Professor Andrew Grieve, Dr Lisa Hampson, Professor Catherine Hewitt, Professor Steve Julious, Professor Graeme MacLennan, Professor Tim Maughan, Professor Jon Nicholl, Dr José Pinheiro, Professor Craig Ramsay, Robert Smith, Miss Joanne Rothwell, Dr William Sones, Professor Nigel Stallard, Professor Luke Vale, Professor Stephen Walters, and Dr Ed Wilson.
The authors would like to acknowledge and thank the participants in the Delphi exercise and the one-off engagement sessions with various groups, including the Society for Clinical Trials, PSI, and Joint Statistical Meeting conference session attendees, along with the other workshop participants who kindly provided helpful input and comments on the scope and content of this document. We would also like to thank in particular Dr Robert Smith in his role as a member of the public who provided a helpful public perspective during the workshop and in the development and revision of the guidance document. Finally, the authors would like to thank Stefano Vezzoli for in-depth comments that helped to refine this document, helpful feedback from the MRC Methodological Research Programme Advisory Group, and representatives of the Medicines and Healthcare Products Regulatory Agency (MHRA) and Health and Social Care, Northern Ireland (HSCNI).
Authors
The authors of this guidance document were:
5
CONTENTS PAGE
Preface 3
Executive summary for researchers and funder representatives 4
Summary for Patient and Public involvement contributors to research projects and funding panels
6
Abbreviations 7
Glossary of key terminology 8
1Introduction 9
2.1 Aim
2.2 Background
2General considerations for specifying the target difference 10
2.1 Introduction 2.2 Perspectives
2.3 The primary outcome
3 Methods for specifying the target difference 15
3.1 General considerations
3.2 Methods for specifying the target difference
4Reporting the sample size and target difference for a RCT 22
5Case studies 25
Appendix 1 Conventional approach to the RCT sample size calculation 38 A1.1 Sample size calculations for a RCT
A1.2 Neyman-Pearson approach
A1.3 Binary outcome sample size calculation for a superiority trial A1.4 Continuous outcome sample size calculation for a superiority trial A1.5 Dealing with missing data for binary and continuous outcomes A1.6 Time-to-event outcome sample size calculation for a superiority trial A1.7 Other topics of interest
Appendix 2 Alternative approaches to sample size calculations for a RCT 46 A2.1 Introduction
A2.2 Precision A2.2 Bayesian
A2.4 Value of information
Appendix 3 Alternative Trial Designs 48
A3.1 Introduction A3.2 Multi-arm
A3.3 Cluster randomised A3.4 Crossover
A3.5 Biomarker A3.6 Adaptive
6 Preface
The aim of this document is to provide guidance for researchers and funder representatives about choosing the target difference ("effect size") for a randomised controlled trial (RCT). As an aid to the reader, the key information is provided in a short two-page executive summary immediately after this preface on the next two pages. Some readers will need to focus on a particular aspect to address a specific query or topic. For researchers new to choosing the target difference for a RCT sample size calculation, reading the whole of the main document is recommended. Individuals with a public and patient involvement role in research and research commissioning will find Sections 2 and 3.1 are most pertinent. For more experienced readers, who may be interested in the subject or to help to peer review an RCT grant application, Sections 3 and 4 might well be sufficient.
7
Executive summary for researchers and funder representatives Specifying the target difference for a randomised controlled trial
The randomised controlled trial (RCT) is widely considered the gold standard study for comparing the effectiveness of health interventions. Central to its design is a calculation of the number of participants needed (the sample size). This provides reassurance that the study will be able to achieve its primary aim. It is typically done by specifying the magnitude of the difference between the intervention effects in the key (primary) outcome for the population of interest that can reliably be detected for a given sample size. This difference is called the study’s “target difference” and should be appropriate for the primary estimand of interest (i.e., the combination of population, outcome, and intervention effects), as determined by the primary aim of the study.
There are two main bases for specifying a target difference: a difference that is considered to be important to one or more stakeholder groups(e.g., patients) and/or one that is realistic (plausible), based on existing evidence and/or expert opinion. Seven broad types of methods can be used to justify the choice of a particular value as the target difference: anchor, distribution, health economic, opinion-seeking, pilot study, review of the evidence base, and standardised effect size (SES). Different statistical and health economic approaches can be taken to justify the sample size, but the general principles are mostly the same. An exception is the relatively new technique of value of information analysis, which seeks to explicitly incorporate the opportunity cost of conducting research. As such, the appropriate sample size is one that maximises the return on investment in the trial, dispensing with the need to define a target difference. The use of alternative approaches is currently limited, with the conventional (Neyman-Pearson) approach the most commonly used. To aid those new to the topic and to encourage better practice regarding the specification of the target difference for an RCT, the following recommendations are made when the conventional approach to the sample size calculation is used:
1. Begin by searching for relevant literature to inform the specification of the target difference. Relevant literature can:
a. relate to a candidate primary outcome and/or the comparison of interest, and; b. inform what is an important and/or realistic difference for that outcome, comparison,
and population (estimand of interest).
2. Candidate primary outcomes should be considered in turn, and the corresponding sample size explored. Where multiple candidate outcomes are considered, the choice of primary outcome and target difference should be based on consideration of the views of relevant stakeholders groups (e.g., patients), as well as the practicality of undertaking such a study and the required sample size. The choice should not be based solely on which yields the minimum sample size. Ideally, the final sample size will be sufficient for all key outcomes, although this is not always practical.
3. The importance of observing a particular magnitude of a difference in an outcome, with the exception of mortality and other serious adverse events, cannot be presumed to be self-evident. Therefore, the target difference for all other outcomes requires additional justification to infer importance to a stakeholder group.
4. The target difference for a definitive (e.g., Phase III) trial should be one considered to be important to at least one key stakeholder group.
5. The target difference does not necessarily have to be the minimum value that would be considered important if a larger difference is considered a realistic possibility or would be necessary to alter practice.
6. Where additional research is needed to inform what would be an important difference, the anchor and opinion-seeking methods are to be favoured. The distribution method should not be used. Specifying the target difference based solely on an SES approach should be considered a last resort, although it may be helpful as a secondary approach.
8
typically too small to inform what would be a realistic difference and primarily address other aspects of trial design and conduct.
8. Use existing studies to inform the value of key “nuisance” parameters that are part of the sample size calculation. For example, a pilot trial can be used to inform the choice of standard deviation (SD) value for a continuous outcome or the control group proportion for a binary outcome, along with other relevant inputs such as the amount of missing outcome data. 9. Sensitivity analyses that consider the impact of uncertainty around key inputs (e.g., the target
difference and the control group proportion for a binary outcome) used in the sample size calculation should be carried out.
10. Specification of the sample size calculation, including the target difference, should be reported according to the guidance for reporting items (see below) when preparing key trial documents (grant applications, protocols, and result manuscripts).
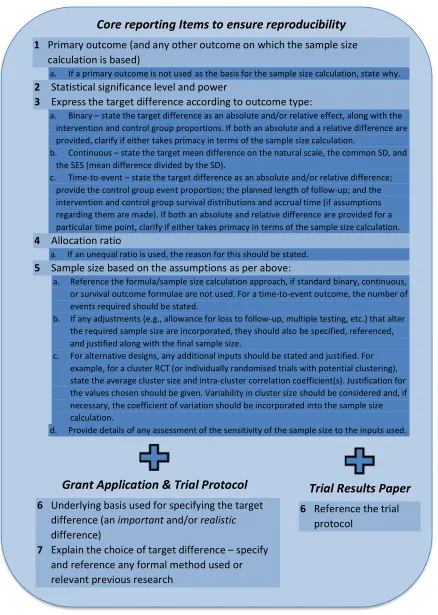
Recommended core reporting items
A set of core items should be reported in all key trial documents (protocols, grant applications, and main results papers) to ensure reproducibility of the sample size calculation. Recommended core reporting items when the conventional sample size approach has been used are as follows:
1. Primary outcome (and any other outcome on which the calculation is based)
a. If a primary outcome is not used as the basis for the sample size calculation, state why. 2. Statistical significance level and power
3. Express the target difference according to outcome type:
a. Binary – state the target difference as an absolute and/or relative effect, along with the intervention and control group proportions. If both an absolute and a relative difference are provided, clarify if either takes primacy in terms of the sample size calculation.
b. Continuous – state the target mean difference on the natural scale, the common SD, and the SES (mean difference divided by the SD).
c. Time-to-event – state the target difference as an absolute and/or relative difference; provide the control group event proportion; the planned length of follow-up; and the intervention and control group survival distributions and the accrual time (if assumptions regarding them are made)). If both an absolute and relative difference are provided for a particular time point, clarify if either takes primacy in terms of the sample size calculation. 4. Allocation ratio
a. If an unequal ratio is used, the reason for this should be stated. 5. Sample size based on the assumptions as per above:
a. Reference the formula/sample size calculation approach, if standard binary, continuous, or survival outcome formulae are not used. For a time-to-event outcome, the number of events required should be stated.
b. If any adjustments (e.g., allowance for loss to follow-up, multiple testing, etc.) that alter the required sample size are incorporated, they should also be specified, referenced, and justified along with the final sample size.
9
Summary for Patient and Public involvement contributors to research projects and funding panels This DELTA2 guidance aims to provide a brief overview of the role of the target difference in a randomised controlled trial, how to choose it, and how to document what was done. The number of people needed in a study is based on a calculation of the number of people needed for the analysis to be informative (“the sample size”). Choosing a “target difference” is part of the typical way to work out how many people need to be included in a study. The target difference is the amount of a difference in the participants’ response to the treatments that we wish to detect. It is probably the most important piece of information used in the sample size calculation. Appropriate selection of the target difference is essential to give us confidence in the conclusions of the study. There are other ways to determine the sample size, but these are not currently commonly used.
To determine what target difference to use, we need to think about what we are going to measure in our study to help us decide whether one treatment works better than another. An “outcome” is how we measure the effect of treatment. For example, if we are evaluating a treatment for hypertension, the outcome could be blood pressure. If more than one outcome is available, then we would consider what would be an important difference for each of them before deciding the overall number of people needed for the trial. We can also think about what would be a realistic value based on similar studies and what we think is possible.
There are a number of different approaches to determine the target difference. The guidance document describes seven broad types. Two of the easiest to use to decide what would be an important difference to detect are the “anchor” and “opinion-seeking” approaches. The “anchor” approach simply uses someone’s view (usually the patient’s) to determine what would be a meaningful difference in an outcome. As is implied with the name, when using the “opinion-seeking” method a researcher asks experts in their field of work what they think the target difference should be. In addition to the “opinion-seeking” approach, a “review of the evidence base” is the easiest to use to understand what would be realistic. For the ”review of the evidence base” approach, a researcher will look at other similar research studies and see what their results have been. There are strengths and weaknesses to each of these approaches.
10 Abbreviations
A&F Audit and feedback ACL Anterior Cruciate Ligament
ACL SNNAP (ACL Surgery Necessity in Non Acute Patients) ART Arterial Revascularisation Trial
CACE Complier Average Causal Effect CRS Chronic Rhinosinusitis
CHART Continuous Hyperfractionated Accelerated Radio Therapy CONSORT Consolidated Standards of Reporting Trials
CV Coefficient of Variation
DELTA Difference Elicitation in TriAls ENGS Expected Net Gain of Sampling ESS Endoscopic Sinus Surgery
ETDRS Early Treatment Diabetic Retinopathy Study EQ-5D-3/5L Euroqol 5 Dimensions-3/5 Level instrument EVSI Expected Value of Sample Information
FILMS Full-thickness macular hole and Internal Limiting Membrane peeling Study HR Hazard Ratio
ICC Intra-Cluster Correlation
INB Incremental Net (monetary) Benefit ITT Intention To Treat
KOOS Knee Injury and Osteoarthritis Outcome Score
MACRO Management for Adults with Chronic RhinOsinusitis MAMS Multi-Arm Multi-Stage
MAPS Men After Prostate Surgery
MCDC/D Minimal clinically detectable change/difference MCID Minimum clinically important difference
Medical expulsive therapy (MET)
MSDD Minimal statistically detectable difference MID Minimally important difference
MRC Medical Research Council
MYPAN MYcophenolate mofetil for childhood PAN NHS National Health Service
NICE National Institute for Health and Care Excellence NIHR National Institute for Health Research
OPTION-DM Optimal Pathway for TreatIng neurOpathic paiN in Diabetes Mellitus OR Odds Ratio
PICO(T) Population Intervention Control Outcome (Timeframe) PPI Patient and Public Involvement
RAPiD Reducing Antibiotic Prescribing in Dentistry RCT Randomised Controlled Trial
RR Risk Ratio
SD Standard Deviation
SEm Standard Error of the measurement SES Standardised Effect Size
SNOT-22 Sinonasal Outcome Test 22 itrmd
SPIRIT Standard Protocol Items: Recommendations for Interventional Trials SUSPEND Spontaneous Urinary Stone Passage Enabled by Drugsd
11 Glossary of key terminology
Estimand is the intended effect to be estimated to address a trial objective. It can be defined in terms of the population of interest, the outcome measure, how intercurrent events (those which preclude observation of the outcome or potentially affect its measurement, e.g., death or participant withdrawal from the study) are dealt with, and how the outcome is expressed (e.g., mean difference).
Important difference is a difference in an outcome that is considered to be important to one or more stakeholder groups (e.g., patients).
Minimum (clinically) important change/difference (MCIC/D) is the smallest value that is judged to be important. The adjective “clinically” is often added to refer to the context of medical care. In shortened form, the acronym MCID is probably most often used in the literature. Minor variants in the term, such as minimal instead of minimum, are commonplace. The use of the word “change” instead of “difference” implies it was premised on a within-person change (e.g., from before to after treatment).
Minimum clinically detectable change/difference (MCDC/D) is the smallest value that is judged to be detectable in the sense that is greater that measurement error for a measure. It is premised on the rationale that a difference smaller than this is not likely to be important. Most commonly, such an approach is used for quality of life measures where the construct of interest cannot be directly measured. As such, this approach only indirectly addresses the issue of importance of a particular difference. The adjective “clinically” is used here to differentiate it from a minimum statistically detectable change/difference (MSDC/D). Accordingly, while the shortened acronym MDC/D is often used in the literature, here MCDC/D is used to differentiate it. There are minor variants in the terminology, such as using minimal instead of minimum and the exact definition.
Minimum statistically detectable change/difference (MSDC/D) is the smallest value that is expected to be statistically detectable at the pre-specified Type I error rate. If the required sample size is achieved, the target difference is one that can reasonably be expected to be statistically detected should it exist. It is not, however, the only value nor the smallest value that could lead to a statistically significant change or difference. The latter is the MSDC/D. The adjective “statistically” is used here to differentiate it from a minimumclinically detectable change/difference. While the shortened acronym MDC/D is often used in the literature, here MSDC/D is used accordingly. Statistical power is the probability that, for the given assumptions, the statistical analysis would correctly detect a given difference and produce a statistically significance result. It is the complement of the Type II error (i.e., the probability of a Type II error not occurring). Achieving 80% or 90% power are commonly accepted levels that the sample size is chosen to meet, although they are arbitrary choices.
Target difference is the value that is used in the sample size calculation of a randomised trial that expresses the difference between the intervention groups that is sought to be detected. There are no theoretical constraints on its value beyond those imposed by the outcome and the planned analysis. For example the proportion of participants with an adverse event can range from 0 to 1.0. A target difference may or may not be one that could be considered important and/or realistic. Type I erroris the probability of falsely rejecting the null hypothesis (typically the null hypothesis is usually that there is no difference between the treatments) and concluding the alternative hypothesis (corresponding, typically that there is a difference between the treatments). The Type I error is typically set to the 0.05 level and applied to a statistical analysis to infer the occurrence or not of a statistically significance finding.
12 1 Introduction
1.1 Aim
The aim of this document is to provide practical guidance on the choice of target difference used in the sample size calculation of a randomised controlled trial (RCT). Guidance is provided with a definitive trial, one that seeks to provide a useful answer, in mind and not those of a more exploratory nature. The term “target difference” is taken throughout to refer to the difference that is used in the sample size calculation (the one that the study formally “targets”). Please see the glossary for definitions and clarification with regards other relevant concepts. In order to address the specification of the target difference, it is appropriate, and to some degree necessary, to touch on related statistical aspects of conducting a sample size calculation. Generally the discussion of other aspects and more technical details is kept to a minimum, with more technical aspects covered in the appendices and referencing of relevant sources provided for further reading.
The main body of this guidance assumes a standard RCT design is used; formally, this can be described as a two-arm parallel-group superiority trial. Most RCTs test for superiority of the interventions, that is, whether or not one of the interventions is superior to the other (See Box 1 for a formal definition of superiority, and of the two most common alternative approaches). Some common alternative trial designs are considered in Appendix 3. Additionally, it is assumed in the main body of the text that the conventional (Neyman-Pearson) approach to the sample size calculation of an RCT is being used. Other approaches (Bayesian, precision and value of information) are briefly considered in Appendix 2 with reference to the specification of the target difference. 1.2 Background
An RCT is widely considered to be the optimal study design to assess the comparative clinical efficacy and effectiveness along with the cost implications of health interventions.[1] RCTs have been widely used to evaluate a range of interventions and have been successfully used in a variety of healthcare settings. An a priori sample size calculation ensures that the study has a reasonable chance to achieve its pre-specified objectives.[2]
A number of statistical approaches exist for calculating the required sample size.[1, 3, 4] However, a recent review of 215 RCTs in leading medical journals identified only the conventional (Neyman-Pearson) approach in use.[5] This approach requires establishment of the statistical significance level (Type I error rate) and power (1 minus the Type II error rate), alongside the target difference (“effect size”). Setting the statistical significance level and power represents a compromise between the possibility of being misled by chance, when there is no true difference between the interventions, and the risk of not identifying a difference, when one of the interventions is truly superior, whilst the target difference is the magnitude of difference to be detected between sample sets. The required sample size is very sensitive to the target difference. Halving it quadruples the sample size for the standard RCT design.[1]
13
2 General considerations for specifying the target difference 2.1 Introduction
RCT design begins with clarifying the research question and then developing the required design to address it. Commonly the PICO(T) framework has been used for this purpose.[13] All of the relevant aspects of trial design (population, intervention, control, outcome, and timeframe) should reflect the research questions of interest. Selection of the primary outcome is considered in Section 2.3, given its key role in trial design and its relationship with the target difference. More recently, the need for greater clarity in trial objectives has been noted, reflecting the existence of multiple intervention (or treatment) effects of potential interest even for the same outcome.[14] These can differ subtly in the population of interest, the role for additional treatment or “rescue” medication, and how the effect is expressed. The concept of estimands has been proposed as a way to bring such distinctions to the fore. An estimand is a more specific formulation of the comparison of interest being addressed. This thinking is reflected in a recent addendum to international regulatory guidelines for clinical trials of pharmaceuticals. Five main strategies are proposed.[15] Of particular note is the treatment policy strategy, which is consistent with what has often been described as an intention-to-treat (ITT)-based analysis.[14, 16, 17] That is, the ITT analysis addresses the difference between a policy of offering treatment with a given therapy compared to the policy of offering treatment with a different therapy, regardless of which treatments are received. Different stakeholders can have somewhat differing perspectives on the comparison of interest and therefore the estimand of primary interest.[14] Corresponding methods of analyses to address estimands that deviate from traditional conventional analyses are an active area of interest[18] (See also, for example, Section A1.7 for brief consideration of causal inference methods for dealing with non-compliance).
The target difference used in the sample size calculation should be one that at least addresses the trial’s primary objective and therefore the intended estimand of primary interest (with the corresponding implications for the handling of the receipt of treatment and population of interest). In some cases, ensuring the sample size is sufficient for more than one estimand may be appropriate, which might imply multiple target differences to address all key objectives. Different estimands may focus on different populations or subpopulations. Estimands will differ in their implications for the magnitude of missing data anticipated (see Section A1.5 for how missing data can be taken into account in the sample size calculation in simple scenarios). Whatever the estimand of interest, the target difference is a key input into the sample size calculation.
2.2 Perspectives
2.2.1 Governmental/charity funder
Funders vary in the degree to which they will specify the research question. The primary concern is that the study provides value for money by addressing a key research question in a robust manner and at reasonable cost to the funder’s stakeholders. This is typically an implicit consideration when the sample size and the target difference are determined. However, a very different approach, value of information (See Appendix 2), allows such wider considerations to be formally incorporated. The sample size calculation and the target difference, if well specified, provide reassurance that the trial will provide an answer to the primary research question, at least in terms of comparing the primary outcome between interventions. The specific criteria that proposals are invited to address, and are assessed against, vary among funders and individual schemes within a funder, as does the degree to which the research question may be a priori specified by the funder.
14
All funders expect an RCT to have a sample size justification.[19] Typically, although not necessarily, this would be via a sample size calculation, most commonly based on the specification of a target difference. The specified target difference would be expected to be one that is of interest to their stakeholders; this is typically patients and health professionals, and sometimes the likely funder of the healthcare, e.g., the National Health Service (NHS) in the UK. For industry-funded trials, the considerations are different, and these are outlined in the next section.
The practical implications of an overly large trial are perhaps mostly financial (the funder has paid more than necessary to get an answer to the research question and thus there is less available for other trials). However, it is also ethically important to avoid more patients than necessary receiving the possibility of a suboptimal treatment, or simply to avoid unnecessary burden on further individuals and to avoid losing the opportunity to devote scarce resource funds to other desirable research. What is and is not sufficient in statistical and more general terms is often very difficult to differentiate except in extreme scenarios. A trial that is too small is at risk of missing an effect. The funder could also later use the target difference in the context of evaluating (formally or informally) whether to close a study due to the probability (or lack thereof) of providing a useful answer in the face of substantially slower progression partway through a trial’s recruitment period.
2.2.2 Industry, payers and regulator
Industry-funded trials are typically (but not always) conducted as part of a regulatory submission for a new drug or medical device, or to widen the indications of an existing drug or device. Generally, an active intervention is compared to a placebo control, as this addresses the regulatory question of whether the intervention “works”. The main exception would be situations in which a new drug is intended to replace an established effective drug, in which case the established drug would be the control. An example is the evaluation of the newer oral anticoagulants, which have been compared to active comparators such as warfarin or low molecular weight heparin in the submissions for approval.
From an industry perspective, the target difference is often one chosen so that it is important to regulators and healthcare commissioners. The key aspects of interest tend to be safety, including tolerability of treatment and consideration of side effects, whether the treatment is stopped due to a lack of effect, and the effect within those who complete treatment. This has corresponding implications for the estimand(s) of interest.[14, 15] Increasingly, payers (health insurance companies and governmental reimbursement agencies) are interested in comparisons with other active therapies, reflecting the need to inform treatment choices in actual clinical practice and considerations of affordability and cost-effectiveness. A new product will be more likely to be reimbursed if there are clinical advantages over existing therapies, either in terms of efficacy or adverse effect profiles, that are provided at an “acceptable” cost. When an intervention is compared to an active control, the treatment effect between them will almost certainly be smaller and the sample size larger than for a placebo-controlled trial, all other things being equal. One common distinguishing feature between a definitive trial (e.g., Phase III) conducted in an industry setting, versus an academic one, is that all of the evidence pertinent to planning such a trial of a new drug agent will often be readily available within the same company. It is also likely that at least some of the individuals involved will have been involved in a related earlier phase trial of the same drug. 2.2.3 Patient, service users, carers, and the public
15
situations, the most appropriate primary outcome may be a patient-reported outcome (e.g., comparing treatments for osteoarthritis where pain and function are the key measures of treatment benefit). It is highly desirable that a patient, service user, and carer perspective feeds into the process for choosing the primary outcome in some way and, where possible, the chosen target difference reflects one that would have a meaningful impact on patient health, according to the research question. Some funders now require at least some PPI in the development of trial proposals, and this perspective forms part of the assessment process.[20] It is also increasingly part of the assessment process for assessing existing evidence.[21]
2.2.4 Research ethics
Fundamental to the standard ethical justification of the conduct of an RCT, which is a scientific experiment on humans, is that it will a) contribute to scientific understanding, and also b) that the participant is aware of what the study entails and whenever possible provides consent to participate.[22, 23] Commonly a third condition, that the participant has the potential to benefit, is also appropriate; this is particularly the case where there may be some risk to the participant. Whatever the specifics of the trial in terms of population, setting, interventions, and assessments, it is important that the sample size for a study is appropriate to achieve its aim. There is a need for justification of some form for the number of participants required. As noted earlier, no more participants than “necessary” should be recruited to avoid unnecessary exposure to a suboptimal treatment and/or the practical burden of participation in a research study. Such a sample size justification may take the form of informal heuristics or, more commonly, a formal sample size calculation.
Clarifying what the study is aiming to achieve and determining an appropriate target difference and sample size is very important as the research can have a big impact, not only on those directly involved as participants but also on future patients. As far as possible, it is also relevant to consider key patient subgroups or subpopulations of individuals in terms of relevance of findings to them. This could be taken into account when undertaking the sample size calculation (See Appendix 1).
2.3 The primary outcome
2.3.1 The role of the primary outcome
16
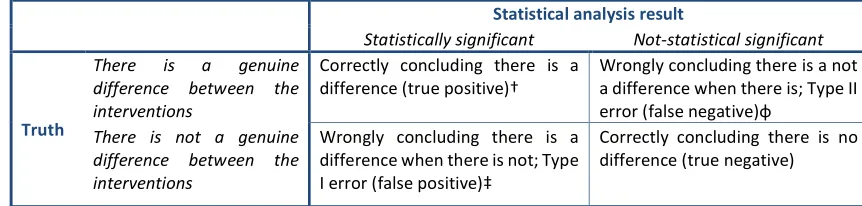
Box 1 Superiority, equivalence, and non-inferiority trials
Superiority trial
In a superiority trial with a continuous primary outcome, the objective is to determine whether there is evidence of a difference in the desired outcome between intervention A and intervention B with mean response µA and µB,
respectively.[1] The null (Ho) and alternative (H1) hypotheses typically under consideration are:
Ho: The means of the two intervention groups are not different, i.e., µA = µB,
H1: The means of the two intervention groups are different, i.e., µA ≠ µB.
For a superiority trial, the null hypothesis can be rejected if µA>µB or if µA<µB based on a statistically significant test
result.[1, 27] This leads to the possibility of making a Type I error when the null hypothesis is true (i.e., there is no difference between the interventions). The statistical test is referred to as a two-tailed test, with each tail allocated an equal amount of the Type I error (α/2, typically set at 2.5%). The null hypothesis can be rejected if the test of µA< µB is statistically significant at the 2.5% level or the test of µA> µB is statistically significant at the 2.5% level. The
sample size is calculated on the basis of applying such a statistical test given the magnitude of a difference that is desired to be detected (the target difference) and the desired Type I error rate and statistical power. Consideration of a difference in only one direction (one-sided test) is also possible.
Equivalence trial
The objective of an equivalence trial is not to demonstrate superiority of one treatment over another, but to show that two interventions have no clinically meaningful difference, i.e., that they are clinically equivalent (or not different).[28] The corresponding hypotheses for an equivalence trial (continuous primary outcome) take the form:
H0: There is a difference between the means of the two groups (i.e., they are not “equivalent”)
𝜇 − 𝜇 ≤ −𝑑 or 𝜇 − 𝜇 ≥ 𝑑 ,
H1: There is a no difference between the means of the two groups (i.e., they are “equivalent”)
−𝑑 < 𝜇 − 𝜇 < 𝑑 ,
where equates to the largest difference that would be acceptable while still being able to conclude that there is no difference between interventions. It is often called the equivalence margin. 𝜇 and 𝜇 are defined as before. To conclude equivalence, both components of the null hypothesis need to be rejected. One approach to performing an equivalence trial is to test both component, which is called the two one-sided test (TOST) procedure.[1, 28] This can be operationally the same as constructing a (1-)100% confidence interval (CI) and concluding equivalence if the CI falls completely within the interval (−𝑑 , 𝑑 ). For example, 𝑑 could be set to 10 (on the scale of interest). After conducting the trial, a 95% CI for the difference between interventions could be (-3, 7). As the CI is wholly contained within (-10, 10), the two interventions can be considered to be equivalent.
Non-inferiority trial
A non-inferiority trial can be considered a special case of an equivalence trial. The objective is to demonstrate that a new treatment is not clinically inferior to an established one. This can be formally stated under null (H0) and
alternative (H1) hypotheses for a non-inferiority trial (continuous primary outcome) that take the form:
Ho: Treatment A is inferior to B in terms of the mean response µB -µA > dNI,
H1: Treatment A is non-inferior to B in terms of the mean response µB -µA ≤ dNI,
where dNI is defined as the difference that is clinically acceptable for us to conclude there is no difference between
interventions, and a higher score on the outcome is a better outcome. Non-inferiority trials reduce to a simple one-sided hypothesis and test, and correspondingly are usually operationalised by constructing a one-one-sided
(1-/2)100% CI. Non-inferiority can be concluded if the lower end of this CI is greater than dNI. No restriction is made
regarding whether the new intervention is the same as or better than the other intervention. A mean difference far from dNI, in the positive direction, is not a negative finding, whereas for an equivalence trial it could rule out
equivalence.
Equivalence and non-inferiority margins
The setting of an equivalence (and non-inferiority) margin, or limit, is a controversial topic. There are regulatory guidelines on the topic though practice has varied.[29, 30] It has been defined more tightly, and arguably appropriately, as the “largest difference that is clinically acceptable, so that a difference bigger than this would matter in practice”.[31] A natural approach would be for 𝑑 to be same as the target difference for a superiority trial comparing the same estimand (see Section 3.2). In the context of replacement pharmaceuticals, this target difference has been suggested to “[be no] greater than the smallest effect size that the active (control) drug would be reliably expected to have when compared with placebo in the setting of the planned trial”.[32] An acceptable margin can therefore be chosen via a retrospective comparison to placebo that shows the new treatment is non-inferior to the standard treatment, and thereby indirectly shows the new treatment is superior to placebo.[33] It may also be desirable to demonstrate no substantive non-inferiority, leading to a narrower margin, similar to the approach above.
17 2.3.2 Choosing the primary outcome
A variety of factors need to be considered when choosing a primary outcome. First, in principle, the primary outcome should, as noted above, be a “key” outcome, such that knowledge of its result would help answer the research question. For example, in an RCT comparing treatment with eye drops to lower ocular pressure with a placebo for patients with high eye pressure (the key treatable risk factor for glaucoma, a progressive eye disease that can lead to blindness), loss of vision is a natural choice for the primary outcome.[34] However, it would clearly be important to consider other outcomes (e.g., side effects of the eye drop drug). Nevertheless, knowing that the eye drops reduced the loss of vision due to glaucoma would be a key piece of knowledge. In some circumstances, the preferable outcome will not be used because of other considerations. In the above glaucoma example, a surrogate might be used (intraocular pressure, i.e., pressure in the eye) because of the time it takes to measure any change in vision noticeable to a patient, and also because this may enable prevention or at least a reduction in the degree of vision loss. Indeed, intraocular pressure is sometimes the primary outcome of RCTs in this area instead of vision or the visual quality of life.
Consideration is also needed of the ability to measure the chosen primary outcome reliably and routinely within the context of the study. Missing data are a threat to the usefulness of an analysis of any study, and RCTs are no different. The optimal mode of measurement may be impractical or even unethical. The most reliable way to measure intraocular pressure is through manometry;[35] however, this requires invasive eye surgery. Subjecting participants to clinically unnecessary surgery for the purpose of an RCT is only ethical with very strong mitigating circumstances, particularly as an alternative, even if less accurate, way of measuring intraocular pressure exists. Furthermore, invasive measurements may dissuade participants from consenting to take part in the RCT.
18
Box 2 Outcome types
The three most common outcome types (binary, continuous, and time-to-event) are briefly described below.
Binary
A binary outcome is one with only two possible values, e.g., cured or not, and dead or alive.In terms of trials, they are usually time-bound, i.e., whether a participant is alive or not at 6 months post-randomisation. Use of the date of the change in status (e.g., time of death) would lead to a survival or time-to-event outcome. Other common trial binary outcomes are the occurrence of an adverse event (e.g., surgical complication or a pharmacological event such as dryness of mouth).
Continuous
Continuous outcomes refer to those that have a numeric scale. True continuous measures (such as blood pressure measurements) have an infinite number of possible values. For example, a value of 125.2334456 mmHg for the systolic blood pressure is theoretically possible, even if is difficult to measure it with such precision. Ordinal outcomes (with a sufficient number of discrete values) are often analysed as if they were continuous due to the difficulties of both calculating the required sample size and also interpreting the result from a more formal, statistically appropriate analysis of an ordinal outcome. This is often done when analysing quality of life measures,[40] where a latent summary scale is produced by applying a scoring algorithm to responses to a set of items, even though there are a fixed number of discrete states (e.g., there are 243 for the EQ-5D-3L with values from -0.594 to 1.0, using the UK population weights). The difficulty of calculating the sample size for an ordinal variable increases quickly as the number of responses increases.[41]
Time-to-event
Time-to-event data are often called “survival” data; a common application is for recording the time to death. However, the same statistical methodology can be used to analyse the time to any event. Examples include disease progression, readmission to hospital, wound healing, and positive ones such as time to full recovery.
Time-to-event data present two special problems in their analysis and hence in sample size estimation: 1. Not all participants have an event; and
2. Participants are observed for varying amounts of time.
If all participants experience an event within the follow-up period, the data could be analysed as a continuous variable. In clinical studies, including RCTs, it is natural for participants to be observed for varying lengths of time. There are two reasons for this:
1. Some participants drop out before the end of follow-up; and 2. Participants are recruited at different times.
Some participants drop out before the end of follow-up, because they decline to take further part in the trial or because they experience some other event, which means that they can no longer be followed up. For example, in a trial where the event of interest is death from a cardiovascular cause, a participant who died in a road traffic accident would become unavailable for further follow-up and would be censored at the time of death.
If participants are followed up from recruitment to the final analysis, some will have been observed for a much longer time than others. In most clinical studies, this is the most frequent reason for varying durations of follow-up. The varying time of follow-up is the main reason why simply analysing the proportion of participants who experience an event, i.e., analyse it as if it were a binary outcome, is not appropriate.
3 Specifying the target difference 3.1 General considerations 3.1.1 Introduction
19
therefore should be one that is appropriate for the planned principal analysis (i.e., the estimand that is to be estimated and the analysis method to be used to achieve this).[15, 17, 42, 43] This is typically (for superiority trials) what is known as an ITT-based analysis, i.e., according to the randomised groups irrespective of subsequent compliance with the treatment allocation. Other analyses that address different estimands[14, 17, 43] of interest could also inform the sample size calculation (see also Appendix 1, Section A1.7 for a related topic). How the target difference can be expressed will depend also on the planned statistical analysis. A target difference for a continuous outcome could be expressed as a difference in means, medians or even as a difference in distribution. Binary outcomes could be expressed as an absolute difference in proportions or as a relative difference (e.g. odds or risk ratio). Irrespective of the outcome type, there are two main bases for specifying the target difference, one that is considered to be:
important to one or more stakeholder groups(e.g., health professionals or patients); or realistic (plausible), based on either existing evidence (e.g., seeking the best available
estimates in the literature), and/or expert opinion.
Recommendations on how to go about specifying the target difference are provided in Box 3. A summary of the seven methods that can be used for specifying the target difference is provided in Section 3.2 below.
A very large literature exists on defining a (clinically) important difference, particularly for quality-of-life outcomes.[44-46] Much of the focus has been on estimating the smallest value that would be considered clinically important by stakeholders (the “minimum clinically important difference – (MCID)”)[44-47]. In a similar manner, discussion of the relevance of estimates from existing studies are also common occurrences. It should be noted that it has been argued that a target difference should always meet both of the above criteria.[48] This would seem particularly apt for a definitive Phase III RCT. There is some confusion in the reporting of sample size calculations for trials in the literature and what the use of a particular approach justifies. For example, using data from previous studies (see Sections 3.2.5 and 3.2.6) cannot by itself inform the importance, or lack thereof, of a particular difference.
The subsequent Sections (3.1.2 and 3.1.3) consider two special topics, individual- and population-level important difference, and reverse engineering of the sample size calculation, respectively.
3.1.2 Individual- versus population-level important differences
In an RCT sample size calculation, the target difference between the treatment groups strictly relates to the difference between the underlying populations. In a similar manner, the health economic consideration refers to how to manage a population of individuals in an efficient manner. However, the difference in an outcome that is important to an individual is not necessarily the same difference that might be viewed as important at the population level. Rose[49] grappled with the meaning and relationships between individual- and population-level differences, and their implications, in the context of disease prevention. He noted that, based on data from the Framingham study, an average 10 mmHg lowering of blood pressure could potentially result in a 30% reduction in attributable mortality. Whilst a 10 mmHg change in an individual might seem small, if a treatment could achieve that average difference, it would be very beneficial. 10 mmHg could therefore be justified as an appropriate and important target difference for a trial in a similar population. An individual may wish a greater impact, particularly if the intervention they are to receive is burdensome or carries some risk.
20
population level values, e.g., the mean difference in Oxford Knee Score (OKS), even though individual values can vary substantially.[53] When considering the importance of and/or how
realistic a specific difference is, the intended trial population must be born in mind. The difference that would be considered important by patients may well vary between populations (e.g., according to the severity of osteoarthritis).[54] For example, the importance of a 5-point increase
Box 3 Recommendation for specifying the target difference in a randomised controlled trial sample size calculation
The following are recommendations for specifying the target difference in an RCT’s sample size calculation when the conventional approach to the sample size calculation is used. Recommendations on the use (or not) of individual methods are made. More detailed advice on the application of the individual methods can be found elsewhere.[7]
Recommendations
1. Begin by searching for relevant literature to inform the specification of the target difference. Relevant literature can:
a. relate to a candidate primary outcome and/or the comparison of interest, and;
b. inform what is an important and/or realistic difference for that outcome, comparison, and population (estimand of interest).
2. Candidate primary outcomes should be considered in turn, and the corresponding sample size explored. Where multiplecandidate outcomes are considered, the choice of primary outcome and target difference should be based on consideration of the views of relevant stakeholders groups (e.g., patients), as well as the practicality of undertaking such a study and the required sample size. The choice should not be based solely on which yields the minimum sample size. Ideally, the final sample size will be sufficient for all key outcomes, although this is not always practical.
3. The importance of observing a particular magnitude of a difference in an outcome, with the exception of mortality and other serious adverse events, cannot be presumed to be self-evident. Therefore, the target difference for all other outcomes requires additional justification to infer importance to a stakeholder group.
4. The target difference for a definitive (e.g., Phase III) trial should be one considered to be important to at least one key stakeholder group.
5. The target difference does not necessarily have to be the minimum value that would be considered important if a larger difference is considered a realistic possibility or would be necessary to alter practice.
6. Where additional research is needed to inform what would be an important difference, the anchor and opinion-seeking methods are to be favoured. The distribution should not be used. Specifying the target difference based solely on an SES approach should be considered a last resort, although it may be helpful as a secondary approach.
7. Where additional research is needed to inform what would be a realistic difference, the opinion-seeking and review of the evidence base methods are recommended. Pilot studies are typically too small to inform what would be a realistic difference and primarily address other aspects of trial design and conduct.
8. Use existing studies to inform the value of key “nuisance” parameters that are part of the sample size calculation. For example, a pilot trial can be used to inform the choice of standard deviation (SD) value for a continuous outcome or the control group proportion for a binary outcome, along with other relevant inputs such as the amount of missing outcome data.
9. Sensitivity analyses that consider the impact of uncertainty around key inputs (e.g., the target difference and the control group proportion for a binary outcome) used in the sample size calculation should be carried out.
21
(improvement) in the OKS for a relatively healthy population with a mean baseline level of 30 points (out of 48) could well differ from that for a population that has severe osteoarthritis with a mean baseline level of 10 points. Similarly, in terms of population risk, e.g. of a stroke, a small reduction at a population level might be considered very important, whereas for a group of high-risk patients, a more substantial reduction may be required.[49]
Work has shown that individuals differ in what magnitude of difference they consider important, at least in part due to their varying baseline levels.[10, 44] This general issue has implications when selecting a target difference, as it should be a difference that reflects the analysis at the group (and intended population) level and the comparison at hand. Care is therefore needed when using values from external studies to infer an important difference.
3.1.3 Reverse engineering
The difference that can be detected for a given sample size is often calculated. It can be apparent that this has been done, e.g., when one sees a spuriously precise target difference that leads to a round sample size without any other justification. For example, a target difference of 16.98 for a trial with pooled SD of 30, statistical power of 80% at two-sided 5% significance level, and two treatment groups of 100 participants has clearly been reverse-engineered.
It is important to distinguish calculating the target difference for a prospective trial from calculating the target difference on the basis of the recruited sample size once the trial has been completed (post hoc power calculation). The former has a useful role in the process of planning and deciding what is feasible; the latter is unhelpful and uninformative.[55]
Case study 6 describes a situation where a fixed (and complete) number of observations were expected without loss due to consent or attrition-driven subsampling, but the corresponding target difference was calculated and deemed to be an important and realistic difference to use.
3.2 Methods for specifying the target difference
The methods for specifying the target difference can be broadly grouped into seven types. These are briefly described below.
3.2.1 Anchor
The quantification of a target difference or effect size for a sample size calculation is not straightforward for an established endpoint or outcome measure.[56] For a new outcome, especially a patient-reported health-related quality-of-life measure, it is even more difficult, as clinical experience with using the new outcome may not been sufficiently long to evaluate what a clinically meaningful or important difference might be. Additionally, for a measure such as a quality-of-life outcome, the scale has no natural meaning and is completely a function of the scoring method (i.e., a 1 point difference does not have any naturally interpretable value).
The outcome of interest can, however, be “anchored” by using someone’s judgement, typically a patient or a health professional, to define what an important difference is.[45-47] This is typically achieved by comparing a patient’s health before and after a recognised treatment, and then linking the change to participants who showed improvement and/or deterioration according to the judgement of changes (e.g., on a 5-point Likert scale from “substantial deterioration” through to “substantial improvement”). Alternatively, a more familiar outcome (for which patients or health professionals more readily agree on what amount of change constitutes an important difference) can be used. In this way, one outcome is anchored to another outcome about which more is known. Contrasts between patients (such as individuals with varying severity of a disease) can also be used to determine a meaningful difference, e.g., via patient-to-patient assessments.[12, 57]
22
relevant and important changes in non-quality-of-life measures of treatment outcome in the condition of interest (although they may not correlate strongly). [58] There are a multitude of minor variations in the approach (e.g., the anchor question and responses, or how the responses are used), although the general principles are the same.[7, 45-47]
3.2.2 Distribution
Distribution approaches are not recommended for use to inform the choice of the target difference given their inherently arbitrary nature in this context. The rationale for this recommendation is set out below.
Two distinct distribution approaches can be grouped under this heading[7, 44]: measurement error and rule of thumb. The measurement error approach determines a value that is larger than the inherent imprecision in the measurement and that is therefore likely to be consistently noticed by patients. This is often based on the standard error of measurement (SEm). The SEm can be defined in various ways, with different multiplicative factors suggested as signifying a non-trivial (important) difference. The most commonly used alternative to the SEm method (although it can be thought of as an extension of this approach) is the reliable change index proposed by Jacobson and Truax[59], which incorporates confidence around the measurement error.
The rule-of-thumb approach defines an important difference based on the distribution of the outcome, such as using a substantial fraction of the possible range without further justification. An example would be viewing a 10 mm change on a 100-mm visual analogue scale measuring symptom severity as a substantial shift in outcome response.
Measurement error and rule-of-thumb approaches are widely used in the area of measurement properties of quality of life, but do not translate straightforwardly to an RCT target difference. For measurement error approaches, this is because the assessment is typically based on test-retest (within-person) data, whereas most trials are of parallel-group (between-person) design. Additionally, measurement error is not sufficient rationale as the sole basis for determining the importance of a particular target difference. More generally, the setting and timing of data collection may also be important to the calculation of measurement error (e.g., results may vary between pre- and post-treatment).[60] Rule-of-thumb approaches are dependent on the outcome having inherent value (e.g., the Glasgow coma scale), where a substantial fraction of a unit change (e.g., one-third or one-half) can be viewed as important. In this situation any reduction is arguably also important, and the issue is more one of research practicality (as per mortality outcome) than detecting a clinically important difference.
3.2.3 Health economic
Approaches to using economic evaluation methodology to inform the design of RCTs have been proposed since the early 1990s.[61, 62] These earlier approaches sought to identify threshold values for key determinants of cost-effectiveness, and are akin to determining an important difference in clinical outcomes, albeit on a cost-effectiveness scale. However, uptake has been very low. A recent review by Hollingworth and colleagues[63] identified only one study that considered cost-effectiveness in the sample size calculation. They also showed that trials powered on clinical end points were less likely to reach definitive conclusions of cost-effectiveness compared to clinical effectiveness.
23
lower limit of the CI calculated from the future trial exceeds 0. An important difference is then any difference in INB that is ≥0, and the size of the trial can be set so as to detect this. However, Glick notes that willingness to pay is not known for certain (e.g., in England and Wales, the National Institute for Health and Care Excellence (NICE)[66] currently specifies a range of between £20,000 and £30,000 per quality adjusted life year gained), and that other things being equal, increasing the decision-maker’s willingness to pay for a unit of health effect reduces the sample size. An alternative economics-based approach, value of information, is summarised in Appendix 2.
3.2.4 Opinion-seeking
The opinion-seeking method determines a value, a range of plausible values, or a prior distribution for the target difference by asking one or more “experts” to state their opinion on what value(s) for a particular difference would be important and/or realistic.[67, 68] Eliciting opinions on the relative importance of the benefits and risks of a medicine may also be used to inform the choice of non-inferiority or equivalence margins for such trials.[69, 70]
The definition of an expert (e.g., clinician, patient, or trialist) must be tailored to the quantity on which an opinion is sought. Various approaches can be used to identify experts (e.g., key opinion leaders, literature search, mailing list, or conference attendance). Other variations include the approach used to elicit opinion (e.g., group and/or individual interviews, questionnaires, email surveys, or workshops)[71-73], the complexity of the data elicited (from a single value[74] to multiple assessments incorporating uncertainty[75] and/or sensitivity to key factors such as baseline level[76]), and the method used to consolidate the results into an overall value, range of values, or distribution.[67]
Many elicitation techniques have been developed in the context of Bayesian statistics to establish a prior distribution quantifying an expert’s uncertainty about the true treatment difference.[67] The expert will be asked a series of questions to elicit a number of summaries of their prior distribution. The number and nature of these summaries will depend on the nature of the treatment difference (i.e., whether this is a difference in means, risk ratio, etc.) and what parametric distribution (if any) will be used to model the expert’s prior. Typically, more summaries are elicited than are strictly necessary to enable model checking. Feedback of the fitted prior is an essential part of the elicitation process to ensure it adequately captures the expert’s beliefs. Examples of prior elicitation include the CHART and MYPAN trials.[75, 77, 78] When the opinions of several experts are elicited, several priors may be used to capture a spectrum of beliefs (e.g., sceptical, neutral, or enthusiastic). Priors may be used to inform the design of a conventional trial, e.g., when setting the sample size or an early stopping rule[77, 79] to ensure the study would convince a prior sceptic. Alternatively, priors may be incorporated into the interpretation of a Bayesian trial to reduce uncertainty, which may be appropriate in cases such as rare diseases when a conventionally powered study is infeasible.[80] Bayesian approaches to sample size calculations are discussed in more detail in Appendix 2.
24 3.2.5 Pilot studies
Pilot studies come in various forms.[82] A useful distinction can be made between pilot studies, per se, and the subset of pilot trials that can be defined as an attempt to pilot the study methodology prior to conducting the main trial. As such, data from a pilot trial are likely to be directly relevant to the main trial. This section therefore focuses on pilot trials, although the considerations are relevant to other pilot studies that have not been designed with a particular trial design in mind. It should be noted that some Phase II trials can be viewed in a similar manner as preparing for a Phase III trial and therefore can inform sample size calculations.
Pilot trials are not well suited to quantifying a treatment effect as they usually have a small sample size, and are not typically large enough to quantify with much certainty what a realistic difference would be.[83] Accordingly, avoiding conducting formal statistical testing and focusing instead on descriptive findings and interval estimation is recommended.[82, 84] In terms of specifying the target difference for the main trial, pilot trials are most useful in providing estimates of the associated “nuisance” parameters (e.g., standard deviation (SD) and control group event proportion. See Section 5.3 for more details).[82, 85] Like any quantity, these parameters will, however, be estimated with uncertainty, which has implications for the sample size of both a pilot trial and a subsequent main trial.[86]
Another use of a pilot trial is to assess the plausibility (at a less exacting level of statistical certainty than would be typically required for a main trial) of a given difference considered to be important through the calculation of a CI.[85] Pilot trial-based CIs can be considered investigative and can be used to help with informing decision making. If an effect of this size is not ruled out by the CI of the estimated effect from the pilot trial, then results could be deemed sufficiently promising to progress to the main trial.[84, 87]
3.2.6 Review of the evidence base
An alternative to conducting a pilot trial is to review existing studies to assess a realistic effect and therefore inform the choice of target difference for the main trial.[7] This can be called a review of the evidence base. Pre-existing studies for a specific research question can be used (e.g., using the pooled estimate of a meta-analysis) to determine the realistic difference.[1] It has been argued strongly and persuasively that this should be routine prior to embarking on a new trial.[88] Extending this general approach, Sutton and colleagues[89, 90] derived a distribution for the effect of a treatment from a meta-analysis, from which they then simulated the effect of a “new” study; the result of this study was added to the existing meta-analysis data, which was then re-analysed. Implicitly this adopts a realistic difference as the basis for the target difference and therefore makes no judgement about the value of the effect should it truly exist. Using the same target difference as a previous trial, while heuristically convenient, does not provide any real justification as it may or may not have been appropriate when used in the last study.