_____________________________________________________________________________________________________ *Corresponding author: E-mail: dr_nabilalama@yahoo.com;
www.sciencedomain.org
Effect of Plasma-leptin on Cardiac Disorders with
Type 2 Diabetes-patients
Nabil Al-Aama
1,2*1
Department of Internal Medicine and Cardiology, King Abdulaziz University Medical School, Saudi Arabia. 2
CCU and Consultant Adult Interventional Cardiology, Saudi Arabia.
Author’s contribution
The sole author designed, analyzed and interpreted and prepared the manuscript.
Article Information
DOI: 10.9734/BJMMR/2017/29482 Editor(s): (1) S. U. Fuhong, ICU Laboratory, Erasme Hospital, Free University Brussels, Brussels, Belgium. Reviewers: (1) Matome M. Sekhotha, University of Limpopo, South Africa. (2)Ahmed Esmael, Mansoura University, Egypt. (3)Ebenezer Adekunle Ajayi, Ekiti State University, Nigeria. (4)Nikolaos Tentolouris, University Of Athens, Greece. (5)Anonymous, ASL RMH, Italy. Complete Peer review History:http://www.sciencedomain.org/review-history/17268
Received 14th September 2016 Accepted 10th December 2016 Published 17th December 2016
ABSTRACT
Background: The net mechanism by which visceral fat concentration is still unclear because of its
interference with autonomic dysfunction which could be simply modified by leptin through the dorosomedical hypothulumus. This work studies the potential correlations between visceral fat concentration, cardiac autonomic dysfunction having diabetic disorder (type 2) and leptin.
Methods: The present work includes 90 cases with cardiovascular risk parameters and diabetic
patients and 90 (age- and gender-matched) non diabetic. Typical measurements for cardiovascular risk factors have been measured in addition to plasma visceral fat area, heart variability, leptin and soluble leptin receptor standards.
Results: Visceral fat area is highly inversely dependant on the parameters of heart rate variability
(p < 0.05 and standard deviations of NN (normal RR) intervals during the 24-hour period r = -
0.239, p =0.003. Similarly, the plasma standard of leptin is also important (p < 0.05) showing
reverse dependence with the parameters of heart rate variability standard deviations of NN (normal RR) intervals during the 24-hour period r = -0.238, p = 0.017. In case of non diabetic patients,
there are almost zero dependence between leptin and any of heart rate variability parameters.
Conclusions: Patients having visceral obesity and type 2-diabetes are strongly affected with
hyper-leptinemia which may lead to cardiac autonomic dysfunction.
Keywords: Visceral fat; leptin; heart rate; cardiac dysfunction; variability.
1. INTRODUCTION
Leptin is a 167 amino acids (16 kDa-peptide), which controls energy-balance though the hypothalamus [1-4]. In fact, the hypothalamus in the brain has a complex system to communicate with fat cells (including leptin) that entre to the body as food. When leptin levels rise, leptin binds to leptin receptors in the hypothalamus, then, it send an electrical pulse to stop entering more fat cells to the body. This occurs by lowering appetite and turning up the body-metabolic rate. Consequently, due to controls energy-balances, leptin levels are low in the blood entering brain; while these levels are high in the blood leaving the brain [2]. Esler et al. [5] have suggested that leptin is prepared in brain tissues and the hypothalamus itself. Moreover, Eikelis et al. [6] have reported that in healthy males, about 40% of initial-leptin has an origin
from the brain. In addition, the plasma leptin (PL) levels shared by the brain revealed a 600% increase in over-mass people compared with healthy ones. Eikelis et al. [6] have reported that the leptin levels in healthy males are 935±32 ng/ml in obese-males against 160±59 ng/ml in healthy-males. The relation between leptin levels and obesity is strong: Several decades ago, obesity has risen globally over to be a major reason of serious disorders [7,8]. The accumulation of spare lipid joined by obesity, share in creation of multiple disorders [9]. One can control diabetes, but when sugar standards are out of control it will highly increase the risk of stroke and heart disease. This is why patients with diabetes should keep in mind the permanent risk for developing cardiovascular disease. Several disorders are created as a direct reason of obesity as shown in the following:
1 High blood pressure which plays a principal risk for cardiovascular disease. Several reports illustrate high relation between insulin resistance and hypertension. If people have on the same time diabetes and hypertension, their risk for cardiovascular disease will increase. 2 Abnormal cholesterol and high triglycerides: People with diabetes have, in general, bad
cholesterol standards with high "bad"-cholesterol (LDL); and they have low quantities of "good" cholesterol, and high triglycerides. The famous set of low-lipid counts generally happens with people with premature coronary heart disease. This is a character of a dyslipidemia (insulin resistance) accompanied with lipid disorder. People with diabetes have, in general, bad cholesterol standards with high "bad"-cholesterol (LDL); and they have low quantities of "good" cholesterol, and high triglycerides. The famous set of low-lipid counts generally happens with people with premature coronary heart disease. This is a character of a dyslipidemia (insulin resistance) accompanied with lipid disorder.
3 Obesity, which is a third principal risk factor for cardiovascular disease and is accompanied with insulin resistance. However, mass-loss decreases the potential risk of cardiovascular disorders, lowers insulin accumulation and raises insulin allergy. High blood pressure in addition with other risk factors will be direct result of insulin resistance and obesity. Abnormal cholesterol and high triglycerides:
4 Physical inactivity is another adjustable principal risk parameter for cardiovascular disease and insulin resistance
PL concentrations are greater in type II diabetic patients and stimulate monocyte chemotactic peptide-1 synthesis via the mitogen-activated protein kinase/extracellular signal-regulated kinase pathway. In fact, the synthesis stimulation of monocyte chemotactic peptide-1 the processes of metabolism, growth, and differentiation must be tightly integrated for correct functions. Cell signaling essentially connects and lubricates these occurrences to ensure that progress runs smoothly. The mechanism is schematically illustrated in the following figure (Fig. 1):
Fig. 1. Activation of monocyte chemotactic peptide-1 synthesis via the mitogen-activated
protein kinase/extracellular signal-regulated kinase pathway
Thus far, there are no reports presented that examine the correlations between levels of PL, adiposity, and heart rate variability in cases having diabetes (type-2).
The present work studies the correlations between different factors of the heart rate variability, inflammation, metabolic syndrome, and fitness in obese individuals on these variables. The following schema (Fig. 2) illustrates the proposed relations between the above mentioned factors.
This work, reports the correlations that exist between the above mentioned disorders in 90 diabetes-cases was examined, as well as in 90 aged- and gender-matched, non-diabetic individuals having cardiovascular disease risks. Leptin is expressed in not only adiposities but
also in milk; i.e. mammary epithelial cells and leptin protein is present in milk. Even, there is little information about the regulation of leptin expression in mammary epithelial. Therefore, we aim to shed light on the role played by leptin on cardiac disorders with type 2 diabetes-patients and to know the relations between levels of PL, adiposity, and heart rate variability in cases having diabetes (type-2).
Fig. 2. Imaginative framework
2. EXPERIMENTALS
The present work concerns studying the clinical factors affect on cardio vascular disorders by clinical-observations (atherosclerosis) on 90 non-diabetes Egyptian-people 90 aged- and gender-matched patients without diabetes as well as 90 Egyptian patients with type 2 diabetes, participated in this work.
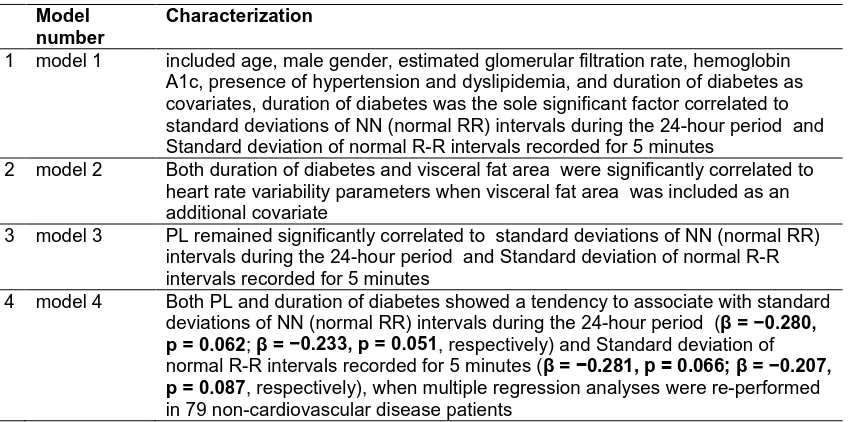
Table 1. Characterization of different modules correlated to VEA, heart rate variability, standard deviations of NN (normal RR) intervals
Model number
Characterization
1 model 1 included age, male gender, estimated glomerular filtration rate, hemoglobin A1c, presence of hypertension and dyslipidemia, and duration of diabetes as covariates, duration of diabetes was the sole significant factor correlated to standard deviations of NN (normal RR) intervals during the 24-hour period and Standard deviation of normal R-R intervals recorded for 5 minutes
2 model 2 Both duration of diabetes and visceral fat area were significantly correlated to heart rate variability parameters when visceral fat area was included as an additional covariate
3 model 3 PL remained significantly correlated to standard deviations of NN (normal RR) intervals during the 24-hour period and Standard deviation of normal R-R intervals recorded for 5 minutes
4 model 4 Both PL and duration of diabetes showed a tendency to associate with standard deviations of NN (normal RR) intervals during the 24-hour period (β = −0.280, p = 0.062; β = −0.233, p = 0.051, respectively) and Standard deviation of
normal R-R intervals recorded for 5 minutes (β = −0.281, p = 0.066; β = −0.207, p = 0.087, respectively), when multiple regression analyses were re-performed
in 79 non-cardiovascular disease patients
Heart rate variability has been determined in order to evaluate the cardiac autonomic function, as previously described [13]. According to the testaments for best health usage of heart rate variability, the two successive R-peak intervals have standard deviation (SD) intervals for each 5-min (Standard deviation of normal R-R intervals recorded for 5 minutes) period have been taken, calculated and estimated. In addition, the data of Standard deviation of normal R-R intervals recorded for 5 minutes have been used to stand for any variations in heart rate for turning with cycling-time more than 5 min, standard deviations of NN (normal RR) intervals during the 24-hour period has been accounted to represent the totality of turning factors which affect the disorder in heart function.
We carried out the clinical data of heart rate variability. The blood-samples were gathered early in the morning taken into account enough fast-period. These samples were sufficiently centrifuged to, finally, have plasma. Using abdominal computed tomography, we obtained a single 10-mm slab from the umbilicus.
3. STATISTICAL METHODS
We estimated the relation between leptin-levels and soluble leptin receptors by using typical- anthropometric techniques. Heart rate variability parameters (standard deviations of NN (normal RR) intervals during the 24-hour period, Standard deviation of normal R-R intervals
recorded for 5 minutes), PL and sOb-R levels were logarithm-transformed (Log) to achieve normal distribution in the analysis. A non-repeated t test (continuous variables with normal distribution) and Chi square test (for categorical variables) were utilized to compare variables between patients with and without diabetes. To estimate the relationship between heart rate variability parameters and different factors such as PL or soluble leptin receptors, and visceral fat area, we performed simple and multiple regression analyses. heart rate variability parameters were set as a dependent variable in the multiple regression analysis, and after adjusting for age, gender, estimated glomerular filtration rate, hemoglobin A1c levels, duration of diabetes (in affected patients), and presence of hypertension and dyslipidemia, the visceral fat area and PL levels were set as independent variables. All statistical analyses were performed using version 18.0 of the software: statistical package for the social sciences. All reported p values are 2-tailed and were considered statistically significant at a level <0.05.
4. RESULTS
4.1 Measurements on Diabetic- and
Nondiabetic Patients
Table 2. Metabolic factors of diabetic and non-diabetic patients in the present study
DM (n = 90) NDM (n = 90)
Log (SDNN) Log (SDANN5) Log (SDNN) Log (SDANN5)
r p r p r p r p
VFA −0.243 0.015 −0.238 0.017 −0.039 0.699 −0.001 0.993 SFA −0.116 0.252 −0.113 0.261 0.053 0.599 0.078 0.438 log (leptin) −0.243 0.015 −0.231 0.021 −0.020 0.842 0.005 0.959 Log (sOb-R) −0.061 0.545 −0.040 0.694 0.106 0.296 0.103 0.307
glomerular filtration rate, fasting plasma glucose, hemoglobin A1C, visceral fat area, and saturated fatty acid values. While PL, soluble leptin receptors levels, and heart rate variability parameters did not have strong variations between the various sets, the possible-rate of dyslipidemia and hypertension seem to be feeble in healthy people than diabetic patients.
4.2 Correlations between Visceral Fat Area, Saturated Fatty Acid, Plasma Leptin, and Soluble Leptin Receptors Levels with Heart Rate Variability Factors
Data in Table 2 give evident correlations between visceral fat accumulation VFA, saturated fatty acid (SFA), plasma leptin and soluble leptin receptor (sOb-R) levels, and heart rate variability (HRV) parameters. Only visceral fat accumulation, but not saturated fatty acid, was strongly and inversely correlated with heart rate variability parameters in patients with diabetes. This is also illustrated in Fig. 3a. But, as it is seen from Table 2, these correlations did not found in healthy-patients (non-diabetic). In addition, PL levels were strongly correlated with visceral fat accumulation (r = 0.417, p < 0.001, r
= 0.262; p = 0.008) and saturated fatty acid (r = 0.732, p < 0.001, r = 0.693; p < 0.001) in both
healthy and diabetic individuals. In healthy and diabetic individuals, some trends are shown that plasma sOb-R level is correlated with visceral fat accumulation (r = −0.181, p = 0.072, r = −0.190;
p = 0.058), but not with saturated fatty acid. For
patients with diabetes, visceral fat area, but not saturated fatty acid, was importantly and inversely related with heart rate variability parameters. In contrast, for non-diabetic patients, these correlations were not found. PL level was inversely related to standard deviations of NN (normal RR) intervals during the 24-hour period and Standard deviation of normal R-R intervals recorded for 5 minutes in diabetic patients. On the contrary, this was not found in healthy group. In either group, plasma soluble leptin receptors level was not significantly correlated to heart rate
variability parameters. On the other hand, PL levels were positively related to visceral fat area (in both healthy and diabetic groups). This is shown in Table 3 with r = 0.401, p < 0.001, r =
0.259; p = 0.008; and saturated fatty acid (r = 0.729, p < 0.001, r = 0.701; p < 0.001). This is
also shown in Fig. 3a, plasma soluble leptin receptors level showed the tendency of being related to visceral fat area (r = −0.201, p = 0.070,
r = −0.189; p = 0.057), but not with saturated fatty acid, in all healthy and diabetic. Relations between PL levels and heart rate variability factors (0.83 ± 0.41 vs. 0.79 ± 0.42, p = 0.610), standard deviations of NN (normal RR) intervals during the 24-hour period (2.00 ± 0.13 vs. 2.04 ±
0.14, p = 0.165), and Standard deviation of
normal R-R intervals recorded for 5 minutes (1.96 ± 0.13 vs. 1.99 ± 0.14, p = 0.183). This did not vary when one compare healthy to diabetic patients: [with (n = 48) and without (n = 52)] neuropathy (in patients with or without diabetic neuropathy PL). In fact, leptin was related to standard deviations of NN (normal RR) intervals during the 24-hour period (r = −0.323, p = 0.02) or Standard deviation of normal R-R intervals recorded for 5 minutes (r = −0.338, p = 0.014), in patients with diabetic neuropathy. On the other hand, Fig. 3b shows that leptin is not related to standard deviations of NN (normal RR) intervals during the 24-hour period (r = −0.137, p = 0.355) or Standard deviation of normal R-R intervals recorded for 5 minutes (r = −0.092, p = 0.534) for healthy people without diabetic neuropathy.
4.3 Independent Adiposity and Clinical Factors with the Level of Plasma Leptin Depend Strongly on Heart Rate Variability Factors
recorded for 5 minutes: Estimated glomerular filtration rate, presence of hypertension and dyslipidemia, the age, male gender, hemoglobin A1c, and duration of diabetes as covariates, duration of diabetes.
Note that Fig. 3b shows that leptin is not related to standard deviations of NN (normal RR) intervals during the 24-hour period (r = −0.137,
p = 0.355) or Standard deviation of normal R-R
intervals recorded for 5 minutes (r = −0.092,
p = 0.534) for healthy people without diabetic
neuropathy. The heart rate variability parameters were highly affected with both duration of diabetes and visceral fat area. In model 3, PL stayed highly related to standard deviations of NN (normal RR) intervals during the 24-hour period and Standard deviation of normal R-R intervals recorded for 5 minutes.
PL (and not visceral fat area) exhibited important relations with standard deviations of NN (normal RR) intervals during the 24-hour period and Standard deviation of normal R-R intervals recorded for 5 minutes, when both visceral fat area and PL were added to the model 1 covariates (model 4) (Table 1). PL (and neither visceral fat area nor body mass index) stayed strongly related to standard deviations of NN (normal RR) intervals during the 24-hour period and Standard deviation of normal R-R intervals recorded for 5 minutes, when body mass index was included as an additional covariate to model 4.
PL stayed strongly related to standard deviations of NN (normal RR) intervals during the 24-hour period (data no shown). This was included as an additional covariate to model 4. Including these compounds, one can consider that the usage of insulin is strongly related to standard deviations of NN (normal RR) intervals during the 24-hour period (β = −0.224, p = 0.034) together with PL
(β = −0.256, p = 0.042) and duration of diabetes
(β = −0.223, p = 0.041). Thus, PL stayed
strongly related to standard deviations of NN (normal RR) intervals during the 24-hour period (β = −0.275, p = 0.033). This was considered
when the presence of the cardiovascular disease actions were taken as an additional covariate to model 4 and tended to be correlated to standard deviation of normal R-R intervals recorded for 5 minutes (β = −0.243, p = 0.061). Duration of
diabetes and PL revealed a favorable behavior to stayed strongly related to standard deviations of NN (normal RR) intervals during the 24-hour period: (β = −0.280, p = 0.062; β = −0.233, p = 0.051, respectively) and Standard deviation of
normal R-R intervals recorded for 5 minutes (β = −0.281, p = 0.066; β = −0.207, p = 0.087,
respectively). When multiple regression values were re-carried out in 90 non-cardiovascular disease patients (model 4), in contrast, in the non-diabetic patients (data not shown), neither visceral fat area nor PL was independently related to heart rate variability parameters. This is summarized in Table 3.
Note that Fig. 3a, plasma soluble leptin receptors level showed the tendency of being related to
visceral fat area (r = −0.201, p = 0.070,
r = −0.189; p = 0.057), but not with saturated fatty acid, in all healthy and diabetic. Relations between PL levels and heart rate variability factors (0.83 ± 0.41 vs. 0.79 ± 0.42, p = 0.610), standard deviations of NN (normal RR) intervals during the 24-hour period (2.00 ± 0.13 vs. 2.04 ±
0.14, p = 0.165), and Standard deviation of
normal R-R intervals recorded for 5 minutes (1.96 ± 0.13 vs. 1.99 ± 0.14, p = 0.183).
5. DISCUSSION
Plasma leptin accompanies, always, several parameters: sex, the fasting insulin level and body adiposity which are, in addition, independently related between each other. Moreover, leptin levels are independent on non-insulin-dependent diabetes mellitus; so, impaired leptin secretion does not affect obesity accompanied with non-insulin-dependent diabetes mellitus. Moreover, the pair body adiposity and plasma levels of insulin are affected by insulin sensitivity and not leptin. Several studies have shown that PL levels are strongly correlated with adiposity and its value is correlated to the metabolic-rate of syndrome components [14-20].
One knows quite well that the levels of body mass index, visceral fat area and saturated fatty acid are higher in diabetic-patients than healthy. This study shoes that PL concentrations do not vary very much between diabetic-patients and healthy people. However, insulin or C-peptide can alter PL level which may lead to insulin resistance and deficiency.
5.1 Cardiac Autonomic System-functions and Leptin Levels
[23-25]. From clinical point of view, PL levels are strongly correlated to adiposity which shows that high values of leptin protein weakened their tendency to restrain feeding and deposition of
fat. Lopez [26] has shown that blood pressure and heart rate are directly modulated because of hyper-leptinemia. This latter is created directly due to obesity.
Fig. 3a. Parameters of heart rate variability: Standard deviations of NN (normal RR) intervals during the 24-hour period as a function of visceral fat area
Fig. 3b. Parameters of heart rate variability: Standard deviations of NN (normal RR) intervals during the 24-hour period as a function of PL levels
0 50 100 150 200 250 300
1.00 1.25 1.50 1.75 2.00 2.25 2.50
Log SDNN (ms)
Visceral Fat Area, cm2 r = - 0.241
p = 0.015
-0.5 0.0 0.5 1.0 1.5 2.0
1.00 1.25 1.50 1.75 2.00 2.25 2.50
Log SDNN (ms)
8
Table 3. Metabolic parameters correlated with visceral fat area, saturated fatty acid, and sOb-R standards in the present study
Variables Log (SDNN) Log (SDANN5)
Model 1 Model 2 Model 3 Model 4 Model 1 Model 2 Model 3 Model 4
Age −0.187 −0.170 −0.215 −0.204 −0.166 −0.149 −0.193 −0.180
Gender
(female = 0, male = 1)
−0.040 0.005 −0.190 −0.146 −0.038 0.006 −0.177 −0.132
Hypertension
(absence= 0, presence= 1)
−0.103 −0.040 −0.023 −0.010 −0.119 −0.059 −0.044 −0.031
Dyslipidemia
(absence= 0, presence= 1)
−0.136 −0.127 −0.110 −0.111 −0.141 −0.133 −0.117 −0.118
eGFR −0.140 −0.118 −0.152 −0.141 −0.106 −0.085 −0.118 −0.106
HbA1c −0.117 −0.071 −0.096 −0.080 −0.096 −0.051 −0.076 −0.059
Duration of DM −0.250† −0.286† −0.264† −0.277† −0.244† −0.278† −0.257† −0.270†
VFA −0.233† −0.096 −0.227† −0.101
log (leptin) −0.333† −0.279† −0.312† −0.254†
Adjusted r2 0.1 0.14 0.179 0.176 0.089 0.126 0.156 0.153
p value 0.018 0.005 0.001 0.001 0.028 0.008 0.002 0.004
†
Denotes p value <0.05
In diabetic subjects, only a limited present-work showed significant association of heart rate variability parameters with adiponectin/leptin ratio, in diabetic subjects.
With type 2 diabetic patients, the ratio between leptin and adiponectin, in diabetic-cases, is highly correlated with heart rate variability factors. Moreover, visceral adiposity has a strong relationship with type 2 diabetic patients, including quantitatively determined visceral adiposity. On the contradictory, no net relations were detected between any of the heart rate variability parameters in non-diabetic patients and leptin [27]. Is there are some relations between PL and heart rate variability observed in healthy people? The nature of relation between PL and heart rate variability was only observed in diabetic patients. Potential mechanisms to answer that question: the answer is due to the high values of C6H12O6. Within the activation of the Janus kinase 2-phosphoinositide 3-kinase pathway in the pro-opiomelanocortin neuron and the inhibition of gamma-amino-butyric acid (GABA) release to pro-opiomelanocortin neuron in the neuropeptide Y/agouti-related peptide neuron, Leptin activates proopiomelano- cortin (POMC) neuron. Variation of glucose results in GABAergic synapses to POMC neurons responded differentially to leptin. However, this is not related to hemoglobin A1c level. This work reports that lowering heart rate variability, in diabetic-patients, was related to the duration of diabetes. In addition, perhaps some differences are found due to neuropathy [28,29]. Several published data [29,30] revealed that there is net correlation between diabetic neuropathy and leptin. However, smoother published works report no correlation between them [16]. These last authors reported that, in diabetic patients, serum leptin level tends to be correlated with sensory conduction velocity. It is safer to state that leptin is accompanied with heart rate variability only in diabetic patients.
Heart rate variability parameters are affected by adiposity, hypertension, and estimated
glomerular filtration rate. Another important parameter that strongly influences the heart rate variability: The body mass index (BMI). High values of BMI in diabetic patients, more than 26 kilograms per meter square results in correlation of leptin with heart rate variability.
Several published works [31-33] have shown that cardiac autonomic function is weakened in patients with cardiovascular disease diseases.
However, the similar behavior between leptin and heart rate variability was obtained even after controlling for existing cardiovascular disease disorders.
5.2 Correlation between Plasma Leptin and Heart Rate Variability Factors with Diabetic Patients
There are different parameters that affect cardiac autonomic dysfunction: Hypertension, dyslipidemia, and duration of diabetes as covariates. From Table 3 model 1, we concluded that only duration of diabetes was the only important parameter correlated with SDNN and SDANN5. Moreover, from Table 3 model 2, one can find that visceral fat accumulation and duration of diabetes are strongly correlated with HRV factors. Model 3 is the same as model 1 except of adding plasma leptin as variable. In model 3, plasma leptin is strongly correlated with
SDNN and SDANN5. Model 4 is the same as model 1 except of adding visceral fat
accumulation and plasma leptin as variable. In model 4, only plasma leptin without visceral fat accumulation is correlated with SDNN and SDANN5 (Table 3). Moreover, adding body mass index as another parameter in model 4, one can conclude that only PL not neither body mass index nor visceral fat accumulation is correlated with SDNN and SDANN5. Moreover, insulin is correlated with SDNN (β = −0.224, p = 0.034) together with plasma leptin (β = −0.256, p = 0.042) and duration of diabetes (β = −0.223, p = 0.041). In case of adding cardiovascular diseases (as variable) to model 4, PL stayed
strongly correlated with SDNN (β = −0.275, p = 0.033), even it correlated with SDANN5 (β = −0.243, p = 0.061).
The data of the present study demonstrate the interaction between insulin and leptin by showing a scheme illustrating this interaction in Fig. 4. The scheme takes into consideration the published work in literature. The ideas of the cross-talk pathways between insulin and leptin at the molecular level {IRS, phosphatidylinositol 3-kinase (PI3K), and MAPK} and the opposite metabolic effects in peripheral tissues play an essential role in the interaction between insulin and leptin.
5.3 Autonomic Function and Soluble Leptin Receptors
present work. Plasma soluble leptin receptors seemed to be inversely related to adiposity; however, it was not highly related to heart rate variability parameters in diabetic patients and healthy people.
Fig. 4. Interaction between insulin and leptin
6. LIMITATIONS
1. Our individuals were homogenously chosen from the one country, which stands against the generalization to other countries and all population.
2. One cannot find a definite and clear definition of the Metabolic Syndrome in our country.
3. The absence of inflammatory markers. 4. Individuals with some other concomitant
disorders such as asthma make difficulties when evaluating fitness.
5. Amelioration in obesity takes relatively long time to activate clinical-changes in heart rate variability measures, Metabolic Syndrome, or inflammatory.
6. Estimating the weight loss of the subjects by simple and direct methods such as body mass index and recipient body mass index is not adequate to calculate the exact values of lost fat.
7. It is important to know that more deep investigations (longitudinal follow-up) for different sets of patients should be carried out to clarify how leptin affect the autonomic dysfunction in patients with and without diabetes.
7. CONCLUSIONS
The present experimental data show that, in patients with diabetes, cardiac autonomic
dysfunction accompanies always hyper-leptinemia, where accumulation of visceral fat is an independent parameter. In particular, in
patients with type 2 diabetes, hyper-leptinemia is a direct reason for cardiac autonomic
dysfunction. Plasma leptin is a reason for pathophysiology of autonomic dysfunction in obesity in humans. Characterizing impaired autonomic nervous system in clinical settings can be carried out with simple electrocardiographic monitoring setups. Cardiovascular disorders and even mortality can happened due to reduction of heart rate variability, in particular for patients with myocardial infarction and in diabetic patients; finally, one can state that leptin is accompanied with heart rate variability only in diabetic patients.
CONSENT
All authors declare that written informed consent was obtained from the patient (or other approved parties) for publication of this paper and accompanying images.
ETHICAL APPROVAL
All authors hereby declare that all experiments have been examined and approved by the appropriate ethics committee and have therefore been performed in accordance with the ethical standards laid down in the 1964 Declaration of Helsinki
COMPETING INTERESTS
Author has declared that no competing interests exist.
REFERENCES
1. Lönnqvist F. The obese (ob) gene and its product leptin-a new route toward obesity treatment in man? QJ Med. 1996;89(3): 327–332.
2. Misra A, Garg A. Leptin, its receptor and obesity. J Investig Med. 1996;44(9):540– 548.
3. Tartaglia LA, Dembski M, Weng X, Deng N, Culpepper J, Devos R, Richards GJ, Camp Field LA, Clark FT, Deeds J, et al. Identification and expression cloning of a leptin receptor, OB-R. Cell. 1995;83;7: 1263–1271
5. Esler M, Vaz M, Collier G, Nester P, Jennings G, Kaye D, Seals D, Lambert G. Leptin in human plasma is derived in part from the brain, and cleared by the kidneys. Lancet. 1998;351(9120):879–880.
6. Eikelis N, Lambert G, Wiesner G, Kaye D, Schlaich M, Morris M, Hastings J, Socratous F, Esler M. Extra-adipocyte leptin release in human obesity and its relation to sympathoadrenal function. Am J Physiol Endocrinol Metab. 2004;286(5): E774–E752.
7. Adam E Locke, et al. Genetic studies of body mass index yield new insights for obesity biology. Nature. 2015;518(7538): 197.
DOI: 10.1038/nature14177
8. Dmitry Shungin, Thomas W Winkler, Damien C Croteau-Chonka, et al. New genetic loci link adipose and insulin biology to body fat distribution. Nature. 2015;518(7538):187.
DOI: 10.1038/nature14132
9. Tae Nyun Kim, Kyung Mook Choi. The implications of sarcopenia and sarcopenic obesity on cardiometabolic disease. Journal of Cellular Biochemistry. 2015;116(7):1171- 1178.
10. Wang Y, Rimm EB, Stampfer MJ, Willett WC, Hu FB. Comparison of abdominal adiposity and overall obesity in predicting risk of type 2 diabetes among men. Am. J. Clin. Nutr. 2005;81(3):555–563.
11. Siegl D, Annecke T, Johnson BL, Schlag C, Martignoni A, Huber N, Conzen P, Caldwell CC, Tschöp J. Obesity-induced hyperleptinemia improves survival and immune response in a murine model of sepsis. Anesthesiology. 2014;121(1):98-114.
DOI: 10.1097/ALN.0000000000000192 12. Kadoya M, Koyama H, Kurajoh M, Kanzaki
A, Kakutani‑Hatayama M, Okazaki H, et al. Sleep, cardiac autonomic function, and carotid atherosclerosis in patients with cardiovascular risks: HSCAA study. Atherosclerosis. 2015;238(2):409–14. 13. Malpas SC, Maling TJ. Heart-rate
variability and cardiac autonomic function in diabetes. Diabetes. 1990;39(10):1177-81.
14. Un Ju Jung, Myung-Sook Choi. Obesity and its metabolic complications: The role of adipokines and the relationship between obesity, inflammation, insulin resistance, dyslipidemia and nonalcoholic fatty liver
disease. Int J Mol Sci. 2014;15(4):6184– 6223.
DOI: 10.3390/ijms15046184
15. Chung SI, Ryu SN, Kang MY, Germinated pigmented rice (Oryza sativa L. cv. Superhongmi) improves glucose and bone metabolisms in ovariectomized rats. Nutrients. 2016;8(10):658.
16. Chen YY, Liu Q, Liu L, Shu XR, Su ZZ, Zhang HF, Nie RQ, Wang JF, Xie SL. Effect of metabolic syndrome on risk stratification for left atrial or left atrial appendage thrombus formation in patients with nonvalvular atrial fibrillation. Chinese Medical Journal. 2016; 129(20):2395-2402.
17. Leow SS, Bolsinger J, Pronczuk A, Hayes KC, Sambanthamurthi R. Hepatic transcriptome implications for palm fruit juice deterrence of type 2 diabetes mellitus in young male Nile rats. Genes & Nutrition. 2016;11(29):PMC5075206.
18. Jaspinder Kaur. A comprehensive review on metabolic syndrome. Cardiol Res Pract. 2014;2014:943162.
19. Somabhai CA, Raghuvanshi R, Nareshkumar G. Genetically engineered Escherichia coli Nissle 1917 synbiotics reduce metabolic effects induced by chronic consumption of dietary fructose. PLoS ONE. 2016;11(10):e0164860. 20. Bautista JE, Martínez-Torres J,
Méneses-Echavez JF, Ruiz K, González-Jiménez E, Schmidt-RioValle J, Lobelo F. LMS tables for waist circumference and waist-height ratio in Colombian adults: analysis of nationwide data 2010. European Journal of Clinical Nutrition. 2016;70(10):1189-1196.
21. Mikolaj Winnicki, Bradley G Phillips, Valentina Accurso, Philippe van de Borne, Abu Shamsuzzaman, Kirti Patil, Krzysztof Narkiewicz, Virend K. Somers, independent association between plasma leptin levels and heart rate in heart transplant recipients. Circulation. 2001;104(4):384-386.
Available:http://dx.doi.org/10.1161/hc2901. 094150
22. Paolisso G, Manzella D, Montano N, Gambardella A, Varricchio M. Plasma leptin concentrations and cardiac autonomic nervous system in healthy subjects with different body weights. J Clin Endocrinol Metab. 2000;85(5):1810-4.
responses to muscle damage after eccentric exercise. J Exerc Rehabil. 2016;12(4):260-5.
24. Fukuhara A, Matsuda M, Nishizawa M, Segawa K, Tanaka M, Kishimoto K, Matsuki Y, Murakami M, Ichisaka T, Murakami H, et al. Visfatin: A protein secreted by visceral fat that mimics the effects of insulin. Science. 2005;307:426– 430.
25. Revollo JR, Körner A, Mills KF, Satoh A, Wang T, Garten A, Dasgupta B, Sasaki Y, Wolberger C, Townsend RR, et al. Nampt/PBEF/Visfatin regulates insulin secretion in β cells as a systemic NAD biosynthetic enzyme. Cell Metab. 2007;6(5):363–375.
26. Miguel López, Hypothalamic leptin resistance: From BBB to BBSome. PLoS Genet. 2016;12(5):e1005980.
DOI: 10.1371/journal.pgen
Available:http://dx.doi.org/10.11371/journal .pgen.1005980
27. Meyer ML, Gotman NM, Soliman EZ, Whitsel EA, Arens R, Cai J, Daviglus ML, Denes P, González HM, Moreiras J, Talavera GA, Heiss G. Cardiovascular Diabetology. 2016;15(1):45.
DOI: 10.1186/s12933-016-0364-y
28. Naito M, Fujikura J, Ebihara K, Miyanaga F, Yokoi H, Kusakabe T, Yamamoto Y, Son C, Mukoyama M, Hosoda K, Nakao K. Therapeutic impact of leptin on diabetes, diabetic complications, and longevity in insulin-deficient diabetic mice. Diabetes. 2011;60(9):2265-2273.
Available:http://dx.doi.org/10.2337/db10-1795
29. Subhadra C Gunawardana, David W Piston. Insulin-independent reversal of type 1 diabetes in nonobese diabetic mice with brown adipose tissue transplant. American Journal of Physiology - Endocrinology and Metabolism. 2015;308(12):E1043-E1055.
DOI: 10.1152/ajpendo.00570.2014 30. Guillermina Maria Luque, Felicitas
Lopez-Vicchi, Ana Maria Ornstein, Belen Brie, Catalina De Winne, Esteban Fiore, Maria Ines Perez Millan, Guillermo Mazzolini, Marcelo Rubinstein, Damasia Becu-Villalobos. Chronic hyperprolactinemia evoked by disruption of lactotrope dopamine D2 receptors impacts on liver and adipocyte genes related to glucose and insulin balance. American Journal of Physiology - Endocrinology and Metabolism; 2016.
DOI: 10.1152/ajpendo.00200.2016 31. Giampetruzzi F, Garruti G Any. Link
between autonomic dysfunction and metabolic syndrome? J Metabolic Synd. 2016;5(1):195.
DOI: 10.4172/2167-0943.1000195 Available:http://dx.doi.org/10.4172/2167-0943.1000195
32. Spallone V, Bellavere F, Scionti L, Maule S, Quadri R, et al. On behalf of the diabetic neuropathy study group of the Italian society of diabetology. Recommendations for the use of cardiovascular tests in diagnosing diabetic autonomic neuropathy. Nutr Metab Cardiovas Dis. 2011;21:69-78. 33. Freeman R. Assessment of cardiovascular
autonomic function. Clin Neurophysiol. 2006;117(4):716-730.
_________________________________________________________________________________ © 2017 Al-Aama; This is an Open Access article distributed under the terms of the Creative Commons Attribution License (http://creativecommons.org/licenses/by/4.0), which permits unrestricted use, distribution, and reproduction in any medium, provided the original work is properly cited.
Peer-review history: