176
Corrosion Rate of Cast Iron under Different
Corrosion Environments
T. C. GillowP
1
P
, D. J. ChukuP
2
Department of Petroleum and Gas Engineering, Faculty of Engineering, Nigeria Maritime University Okerenkoko , P.M.B 1005 Warri, Nigeria.P
1
Department of Petroleum and Gas Engineering, Faculty of Engineering, Federal University Otuoke , P.M.B 126 Yenagoa, Nigeria.P
2
E-mail: 31TUcaroline.idumson@nmu.edu.ngUP
1
P31TP
P
, 31TUprettydora.dc@gmail.comUP
2
P31TPP.
ABSTRACT
It is well known that corrosion is the predominant mechanism for the deterioration of cast iron. Corrosion of cast iron is a serious industrial problem because of the huge financial losses incurred in either partial or complete replacement of corroded parts. The corrosion behavior of cast iron in different corrosion environments was investigated using the weight loss method. The cast iron specimens or coupons were immersed in seven different corrosive environments (fresh water, acid water, sea water, muddy soil, nitrite solution, alkaline water muddy soil and potassium dichromate solution) for 16 weeks and weight loss was evaluated at 2 week intervals. The corrosion rate of the exposed specimens was evaluated.
It was observed that the cast iron specimens corroded when exposed to the different environments. Also, the corrosion rate was a function of the corrosion environments and the order of corrosion of cast iron was alkaline water > acid water > sea water> fresh water>muddy soil>nitrite solution>potassium dichromate solution.
Key Words: Cast iron, corrosion rate, weight loss, corrosion environments, sea water, nitrite solution, alkaline water muddy soil
1.
IntroductionCorrosion since ancient times has affected not only the quality of daily lives of people, but their technical progress. Corrosion is the destruction of a material through an unintentional chemical or electrochemical action with the environment usually starting at the surface. Also, corrosion is a naturally occurring phenomenon that can be defined as the deterioration of a material of
construction or its properties due to a reaction with the environment. It is well known that
177
Cast iron has good casting characteristics including fluidity and the ability to take sharp imprints from moulds. Cast iron has for hundreds of years, been the preferred piping material throughout the world for drain, waste, and vent plumbing applications and water distribution. Unique corrosion resistance characteristics make cast iron soil pipe ideally suited for plumbing applications (Zhang et., 2001).
Cast iron has been used extensively in many industrial applications, such as water industry, for more than 150years. As a result, a large proportion of water transport and distribution pipes were predominantly made of cast iron. They are inexpensive because the primary raw materials that supply the iron and most of the alloy content are blast furnace iron, cast iron scrap, and steel scrap, together with trimming additions to adjust composition. Alloying elements can play a dominant role in the susceptibility of cast irons to corrosion attack (Zaki , 2006). Since high carbon content tend to make cast irons very brittle, other metallic and non-metallic alloying elements are therefore added to control and vary the microstructure and mechanical properties (Sinha, 2003).
Corrosion has a huge economic and environmental impact on virtually all facets of the world’s infrastructure, from highways, bridges and buildings to oil and gas, chemical processing and water and water waste systems. In addition to causing severe damage and threats to public safety, corrosion disrupts operations and requires extensive repair and replacement of failed assets. The annual cost of corrosion worldwide is estimated to exceed $U.S. 1.8 trillion, which translates to 3
to 4% of the Gross Domestic Product (GDP) of industrialized countries (Gὔnter, 2009).
Therefore the aim of this study was to evaluate the corrosion rates of cast iron in the different corrosion environments.
2.
Materials and methods2.1 Collection of sample
Cast iron samples were collected from Engineering workshop, University of Benin, Benin City, Nigeria. Fresh water was bole hole water collected from University of Benin water works. Sea water was collected from Forcados River Burutu, Delta –State, Nigeria.
2.2 Test solution preparation
All the chemicals used were of analytical grade 0.067 mol.d𝑚−3 nitrite and 0.0136 mol.d𝑚−3
178
2.3 Preparation of cast iron samples
Twenty- one (21) cast iron samples /specimens with rectangular geometry were prepared at room temperature. The cast iron samples (coupons) each of size 46.5 x15.5x7mm specimens were polished by scrubbing with bristle brush, rinsed in distilled water, degreased by rinsing with ethanol, acetone-dried, stored in a desiccator and weighed when it has to be used. Figure 1 shows cast iron specimen before and after immersion.
2.4 Specimen test
The studies were carried out by immersion tests as recommended in ASTM standard 931-86. Three (3) prepared cast iron specimens were exposed in seawater, fresh water, acid water, nitrite water, potassium dichromate, alkaline water, muddy soil and acid water each in 1 litre plastic containers for a period of 16 weeks. The pH of the different corrosion environment used in this study were measured and recorded in Table 1. At 2 weeks intervals, the weight loss of the cast iron coupons was measured. The weight loss was calculated in milligram (mg) as the difference between the initial weight and the final after removal of the corrosion coupons and air-dried. The reduction of the thickness as a function of time was calculated. The results were recorded to the nearest 0.0001g on a mettle digital analytical balance (digital analytical balance with sensitivity of ±1mg). Corrosion rate in mil/yr was determined using the equation (Choudary, 2007).
𝑅 = 𝐾𝑤1−𝑤2
𝜕𝐴𝑡 (1)
Where: R= corrosion rate (mil/yr)
K= constant and its value is 534 for (mil/yr)
WR2 R= initial weight of specimen before corrosion in milligrams (mg)
WR2 R= final weight of specimen after corrosion in milligrams (mg)
𝜕 = density of specimen in gm/𝑚𝑚3= 7.86 x 10⁻³𝑔/𝑚𝑚3
179
2.5 Statistical analysis
Table 1: Environments and their pH values
Environment pH
Sea water 7.04
1 𝑥10−5 𝑚𝑜𝑙. 𝑑𝑚−3 acid water 5.02
Fresh water 6.13
0.067𝑚𝑜𝑙. 𝑑𝑚−3 nitrite solution 5.78
Alkaline water muddy soil 8.53
0.0136𝑚𝑜𝑙. 𝑑𝑚−3potassium dichromate 4.26
Muddy soil 4.56
Figure 1: Cast Iron specimens before and after immersion for 1 week in acid water
3.
Results and discussion180
increased weight loss as the exposure time increase as seen in figure 3 which confirms increased corrosion behaviour of cast iron specimens as the exposure time increase. This indicates that the corrosion rate also increased with increase in immersion time. This can be attributed to the fact that the corrosion products on these cast iron specimens were not protective thus allowed continuous attack by the different corrosion environments. The lowest weight loss of 0.02mg was experienced by the specimens immersed in potassium dichromate solution for 2 weeks and the highest weight loss of 1.6mg was observed by specimens immersed in alkaline water and soil for 16 weeks. This is due to the corrosion product that adhered to the surface of cast iron possibly as a result in the difference in environments. After about 2 weeks of exposure to the corrosion environments, the bright grey colour cast iron specimens have changed to yellowish-
brown. The changes in the specimens’ surface seem to have reached its peak by the 16P
th
P
week of exposure with a light-brown deposit (rust) which must have been due to its reaction with dissolved oxygen and moisture (water or solution) in the plastic containers. Figure 4 shows the experimental setup of sample.
Table 2: weight loss (mg) of cast iron in different environment
Exposure time(weeks) Sea water Fresh water Acid water Nitrite water Potassium dichromate Alkaline water muddy soil Muddy soil
0 0 0 0 0 0 0 0
2 0.16 0.1 0.08 0.07 0.02 0.06 0.08
4 0.25 0.27 0.23 0.12 0.05 0.09 0.17
6 0.31 0.32 0.32 0.14 0.07 0.20 0.33
8 0.41 0.42 0.43 0.15 0.1 0.25 0.41
10 0.54 0.57 0.62 0.22 0.14 0.7 0.46
12 0.64 0.67 0.67 0.25 0.17 0.76 0.52
14 0.72 0.72 0.95 0.25 0.17 1.49 0.61
181
Figure 1 represents the variation of corrosion rate of cast iron specimens with immersion time in different environments. The results show that the corrosion rate of cast iron specimens immersed in alkaline water muddy soil gradually increased from 0.06mil/yr to 0.25mil/yr when exposed for 8 weeks. However, there was a drastic increase from 0.25mil/yr to 1.6mil/yr for the next 8 weeks of exposure. Similar pattern was observed for specimens immersed in sea water and acid water as well as other environments. This also confirms that the corrosion rate or behavior of cast iron increased with immersion time as reported by Haleem et al., 1980. This may be because of ions accelerator and inhibitor behavior caused by stability of ferric oxide film formed after corrosion. The relative increase in halide ions is because of corrosive nature of halide ions than other environments (Pierre, 2000).
The corrosivity of a particular concentration of chloride solution can be profoundly affected by the presence or absence of various other chemical species that may accelerate or inhibit corrosion. Chloride concentration may increase where evaporation or deposit occur. The corrosion rate of the specimens is associated with the flow of electrons with the two reactions involving oxidation (in which the specimens ionized) and reduction occurring at the anodic and cathodic sites respectively, on the surface of the specimens. Generally the specimens’ surfaces consist of both anodic and cathodic site, depending on segregation, microstructure, stress etc. (Frankel and Stratmann, 2009).
182
Figure 3: Weight loss of cast iron in different environment
The variation of corrosion rates of the cast iron specimens in the different environments can be attributed to the fact that low pH of the environments; increase the corrosion rate by providing additional hydrogen ions that enhanced the anodic reaction. Also, the presence of hydroxide ions and chloride ions tend to accelerate the oxidation reaction.
However, the exposure of the specimens to potassium dichromate and nitrite solutions inhibit the corrosion rate. This is because these solutions being reducing agents or oxidants tend to lower the corrosion rate through reduction of cathodic reaction or elimination of the dissolved oxygen (Talbort and Talbot, 1998).
183
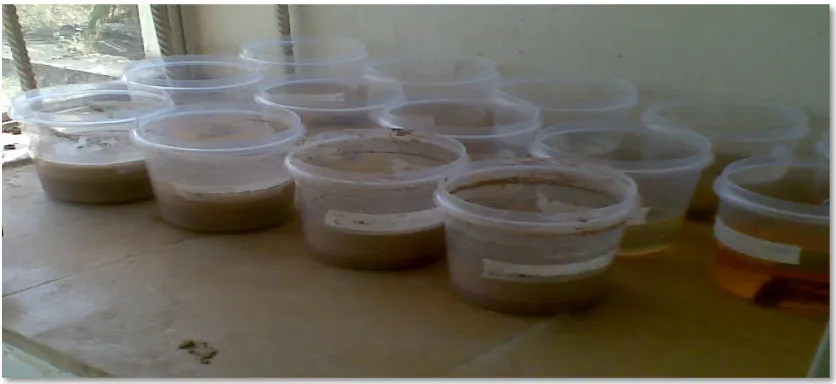
Figure 4: experimental setup of samples
4.
ConclusionsThe following conclusions can be drawn from this study:
Cast iron specimens corroded when exposed to the different corrosion environments.
The water or solution that tends to add hydrogen ions, hydroxide ions and chloride ions
accelerates the corrosion rate while reducing agents solutions (nitrite and potassium dichromate) inhibit the corrosion rate.
The corrosion rate of the cast iron specimens in the different environment under study
increase with increase immersion time.
The overall order of corrosion behavior or rate after 16 weeks of immersion was alkaline
water muddy soil > acid water> sea water >fresh water > muddy soil > nitrite water > potassium dichromate solution.
The corrosion behaviour of cast iron in these environments is traceable to the evolution of
hydrogen gas (due to cathodic reaction) which occurred at low pH and eliminated the possibility of protective layer on this iron in the medium.
References
ASTM. 1998. Water and Environmental Technology, Annual Book of ASTM Standards, 11:01.
Choudary, R.B. (2007): “Material Science and Metallurgy’’. First Reprint: 2007.ISBN:81-7409-176-6
184
Gunter S., (2009). Global Needs for Knowledge Dissemination, Research and Development in Materials Deterioration and Corrosion Control, World Corrosion Organization.
Haleem,E.I., Ald, S.M.Kheor, M.G and Killa, H.M.(1980) “Corrosion Behaviour of Metals in HNOR3 R” .British Corrosion Journal, Vol. 6 No.1, 1980 PP.42.
Milekhine, V., 2003, High Performance Cast Irons, Norwegian University of Science and Technology.
Sinha, A.K., 2003, Physical Metallurgy, McGraw Hill.
Zaki Ahmad, 2006, Principles of Corrosion Engineering and Corrosion Control, Elsevier Science and Technology Books.