_____________________________________________________________________________________________________
*Corresponding author: E-mail: [email protected];
www.sciencedomain.org
Mortality Rate Pre-assessment Based on Trips
Score
Cansu Da
ğ
suyu
1*, Müfide Narlı
1, Ali Kokangül
1and Nejat Narlı
21
Department of Industrial Engineering, Cukurova University, 01130, Adana, Turkey. 2
Department of Pediatrics, Division of Neonatology,Cukurova University, 01130, Adana, Turkey.
Authors’ contributions
This work was carried out in collaboration between all authors. Authors AK and NN conceived the original idea and contributed to designed the study. Author CD managed the analyses of the study. Author MN managed the literature searches. Authors CD and MN wrote the first draft of manuscript. The final manuscript was written by authors AK and NN. All authors read and approved the final manuscript.
Article Information
DOI: 10.9734/BJMMR/2016/27746
Editor(s):
(1) Rui Yu, Environmental Sciences & Engineering, Gillings School of Global Public Health, The University of North Carolina at Chapel Hill, USA.
Reviewers:
(1) Gloria Momoh, University of Ibadan, Nigeria. (2)Fethi Ben Slama, National Institute of Public Health,Tunisia. Complete Peer review History:http://www.sciencedomain.org/review-history/16135
Received 17th June 2016 Accepted 9th August 2016 Published 10th September 2016
ABSTRACT
Treatment and care for newborn babies are provided at medical centres by personnel with the required education and experience using special equipment. Similar to the situation in many other countries, centres with such concentrations are rare; such a situation has required transportation of newborn babies from the centres where they are located to specialised centres. The medical centre that will transport the newborn cannot determine which case is a greater emergency (prioritised) without visiting and inspecting each newborn. In this study, prioritisation of transportation to a Level III newborn medical centre that also fulfils its own transportation needs was studied. In this study, using basic information regarding the newborn (not requiring laboratory tests) without visiting the newborn, the transportation priority of the newborn and the mortality rates were predicted using feed-forward artificial neural networks with high reliability. Prior to transportation, the state of newborn babies is determined using TRIPS scoring. In this way, when more than one transport call is received at the same time, prioritisation will be performed considering mortality rates. Detecting newborn patients’ medical conditions will also help in planning what type of equipment and transportation vehicles are required.
Keywords: TRIPS; neonatal transport; prediction; artificial neural networks.
1. INTRODUCTION
Newborn transport is a key component of neonatal-perinatal care; babies at high risk are frequently transported from one neonatal intensive care unit (NICU) or hospital to another for a variety of reasons [1,2]. During inter-hospital transport, these babies are exposed to an environment outside of the safety of the NICU. Adequate neonatal transport is a key component of care of the sick newborn who requires referral to tertiary care (Level III) centres that provide higher levels of care.
Many hospitals provide facilities for the care of newborns of varying intensity, where the need for transfer is determined by a requirement for support or treatment beyond that available locally. The designations of hospital facilities that take care of newborns are based on the level of complexity of the care provided.
Level I units provide take care for babies who require more care than healthy newborns but are relatively stable.
Level II neonatal units can care for babies who require more advanced support, such as parenteral nutrition and ventilatory support. These units may also look after babies who require short-term intensive care, such as mechanical ventilation. Babies who require longer-term or more elaborate intensive care, for example, extremely preterm infants, are usually transferred to a Level III unit.
Most of the hospitals do not provide Level III care due to economic reasons. In cases where newborns require intensive care, such newborns must be transported from their existing centre to another centre with higher level standards.
Transportation percentage with incubator is between 7.8% to 86.1%, transportation which is accompanied with doctor is between 4.1% to 45.7%, hypothermia percentage of transported infants is 8-43.8%, hypoglycaemia percentage is between 9.7% to 31.3% and hy-poxemia-acidosis percentage is changing between 20% to 80% in our country [3-6].
There are many factors leading to clinical deterioration in newborns submitted to inter-hospitals transport that depend on transport conditions. Conditions associated with transport
can contribute to patient instability: excess noise, vibration, difference in temperature, distance, duration of transport time, and highway conditions. However, the transport team should be prepared to learn to recognise and minimise these conditions [7].
In addition to the transport conditions, the transport crew is another determining factor affecting the health of the newborn. The number of doctors and nurses in the health crew during transportation and its effect on the health of the newborn must be considered. Kumar et al. [8] analysed the importance of the transportation
crew and the road in terms of long- and short-distance transportation. Inner-province
transportation is categorised as Group 1, and outside-province transportation is categorised as Group 2. The babies were grouped according to gestational weeks, and their conditions were analysed following transportation. The babies who were affected negatively during transportation and remained alive during the following 24 hours were compared in terms of their biochemical features.
Both gestational age and birth weight are particularly influenced by the transportation process. Therefore, Mohamed and Aly [9]
considered newborns weighing less than 1500 grams and showed that there are
correlations between transportation among centres and the intensity of intraventricular haemorrhages.
Transporting newborns between centres is likely to affect their medical conditions. By grading challenges and analysing the effects of transportation conditions on newborns, many scoring systems have been created to determine mortality rates.
Sutcuoglu et al. [12] suggested the Transport Related Mortality Score (TREMS) system is predicted mortality based on the values of hypoglycaemia, hypoxia, hypercarbia, hypotension, and hypothermia.
Lee et al. [13] developed The Transport Risk Index of Physiologic Stability (TRIPS) scoring system, which involves collecting data before and after transporting the newborn and assessing physiological conditions during newborn transportation.
Fig. 1 shows that the parameters considered in TRIPS are classified into four groups: temperature, respiratory status, systolic blood pressure and response to noxious stimuli. Each group also has its own points. After all of these points are added, the TRIPS score is obtained. In the TRIPS scoring system, which determines mortality, the mortality rate between 1 and 27% is categorised into six groups: 0.01, 0.03, 0.05, 0.15, 0.18 and 0.27. The parameter values that are considered in determining mortality rates are collected at the patient’s current location by visiting him/her.
Fig. 1. TRIPS scale (Lucas da Silva et al. [14])
In this study, the TRIPS scoring system is considered, and prioritisation of transportation in a Level III newborn medical centre that also provides its own transportation needs was studied. The medical centre is also requested for
transportation by more than one medical centre. The medical centre that will transport the newborn cannot determine which case is a greater emergency (high mortality rate) without visiting and inspecting the newborn. In this study, using basic information regarding the newborn
(not requiring laboratory tests) without visiting the
newborn, the transportation priority of the newborn and the mortality rates after transportation were predicted with high reliability.
2. MATERIALS AND METHODS
2.1 Patient Population
In this retrospective study, the transportation data of a private hospital between the years of 2011 and 2014 were used. The hospital whose data were used is the only hospital that has a newborn vehicle and is a Level III centre with 55 available beds for patients.
From the hospital, data such as gender, gestation week, transportation day,
transportation location (between hospitals within province or between hospitals outside provinces), transportation distance and TRIPS score given to babies by the transportation crew on the location of acceptance after transportation
were gathered. Information of transported infants is held in excel and Patient Information Program which is used in hospital. All data has been taken from those databases and modelled in MATLAB software package and all information has been gained from doctors and nurses who are responsible for new-born unit of the hospital and
preferred to have at least one year of expertise. These gathered data used in this study are approved by the board of the hospital.
Table 1. Input analysis based on gender
Gender N Birth weight mean Gestation week mean
Transportation day Transportation distance
Female 57 2071.23 32.67 10.68 163.60
Male 81 2041.60 32.88 11.95 169.65
confidence bound is %95. This result show that there is no difference between the averages of input parameters of female and male infants. Hence, all data has been considered holistically. Using patient data and an artificial neural network approach, the mortality scores based on the TRIPS score can be predicted.
Table 2. Independent t test
Inputs Sig (2-tailed) Gestation Week 0.815 Birth Weight 0.877 Transportation Day 0.688 Transportation Distance 0.583
2.2 Artificial Neural Networks
In this study, the states of patients (mortality states) to be transported are aimed to be determined without visiting them using the approach of artificial neural networks. Artificial neural networks (ANNs) are used in a wide variety of areas, particularly for prediction and categorisation. Based on a literature review, although the artificial neural networks approach is not utilised to determine patient scores in the medical sector, it is frequently used in studies of disease diagnosis. Artificial neural networks were used in the work of Kurt et al. [15] in their diagnosis of in their coronary artery, Chowdhury et al. [16] in their diagnosis of neonatal diseases Palaniappan and Awang [17] in their study of determining cardiac diseases and Temurtaş et al. [18] in their diagnosis of diabetes, Karamanli et al. [19] in their diagnosis of obstructive sleep apnea; Santos-Garcia et al. [20] in their morbidity after lung resection, Silva et al. [21] in their mortality assessment in intensive care.
In an ANN, the mathematical relationships between the input and the output are taken into consideration. ANN is divided into two parts: a single perceptron and a multilayer perceptron (MLP). In a single perceptron, input and output are considered, and in a multilayer perceptron (MLP), input, output and at least one hidden layer are included. MLP is flexible in prediction [22]. As a result, an MLP with three layers was used in the present study.
Depending on the training type in an ANN, it is either supervised or unsupervised [23]. For this study, a supervised ANN was chosen. Supervised ANNs hold a number of algorithms. In this study, the feed-forward artificial neural networks approach was used, and Levenberg-Marquardt based on least square error method was preferred as the training algorithm. This is an efficient used algorithm in network trainings [24].
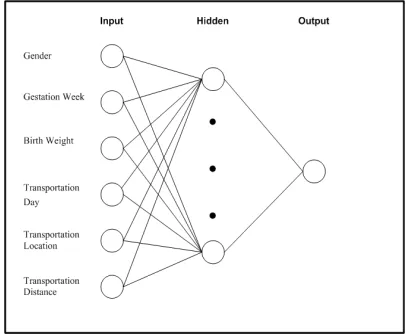
Fig. 2. Artificial neural network structure
The data for 138 transport patients were categorised randomly into three groups: learning, validation and test. The data and neuron numbers in each category were determined considering performance values at the end of the artificial neural networks operations. As a performance indicator, the mean square error (MSE) value was used; the MSE formula is given in Equation (1). Data distribution with the lowest MSE value and the lowest number of neurons in the hidden layer was accepted as the ideal solution.
=
∑ −
(1)
In Fig. 2, the input, hidden and output layers are presented.
3. RESULTS AND DISCUSSION
TRIPS is a common method used to determine mortality rates of newborn transport. A review of the literature on the field indicates a number of studies in which different pregnancy weeks and birth weights are considered. As an example of mortality prediction of preterm babies, Lucas de Silva et al. [14] studied TRIPS performance in the prediction of mortality rates. In particular, in determining the mortality risk of babies with less than 32 weeks of gestation within a seven-day period, they concluded that TRIPS was an important indicator. Arora et al. [25] also analysed the physiological effects of low birth weight during transportation using TRIPS scoring.
Crescenzi et al. [26] evaluated the achievement of a neonatal emergency transport service by using TRIPS in different gestational ages. The gestational age is divided into four groups as 22-26, 27-31, 32-36 and ≥ 37 weeks. In this study, the average values of pre- and post-transport TRIPS scores are examined for each group, and the success of the transport service is emphasised. However, it is confirmed that the study should be examined again by taking into account the values of mortality and morbidity. Alvarado-Socarras et al. [27] aimed to determine the important parameters affecting the mortality rate using data for 191 neonatal patients over a six-month period. As a result of the study, the neonates who weigh less than 1500 grams and have renal failure, congenital defects and higher
TRIPS values have a higher mortality risk. In addition, the transport time and the quality of the ambulance reduce the mortality
risk.
Lucas de Silva et al. [14] concluded that TRIPS is an important factor in determining the mortality rates. Arora et al. [25] also made use of TRIPS. In our study, the TRIPS scoring system for all pregnancy weeks was used, as in the studies of
Mohamed and Aly [9] and Alvarado-Socarras
et al. [27].
In the present study, using data that were not included in the TRIPS scoring (but that could be easily obtained via telephone, internet, etc.), we attempted to determine the mortality rates based on TRIPS scoring and whether or not babies would survive after being transported and treated
in the medical centre. Next, the mortality rate was obtained by ANN.
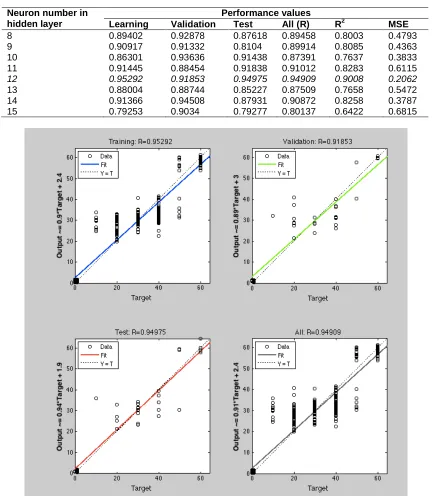
Learning, validation and test data rates were gathered as 0.8, 0.1 and 0.1, respectively, in a study predicting mortality rates of babies based on TRIPS scores and using data concerning 138 newborns such as gender, birth weight, gestation week, transportation day, transportation location and transportation distance. With the aim of determining the most appropriate layer number of the neuron number in the hidden layer, artificial neural networks were used for different neuron numbers, and for each neuron, learning, validation, test and performance scores of all systems (R, R2 and MSE values) were obtained, as presented in Table 3. The best R2 and MSE values were obtained when the number of hidden neurons was 12. As a result, the number of hidden neurons in this study was chosen to be 12. As shown in Table 3, in the training part of the data of the 138 newborns, it was calculated that the performance regression value of the learning data is 0.9529, the performance value of the validation data is 0.9185, the performance value of the test data is 0.9497, and the entire system performance regression value is 0.9490. These regression values are given in Fig. 3. The performance values are larger than 0.90, indicating that the explanatory variables explain 90% of the variability in the output variable.
The results suggest that the input parameters that were considered will yield reliable results concerning mortality rates based on the TRIPS score and the living status of the newborns.
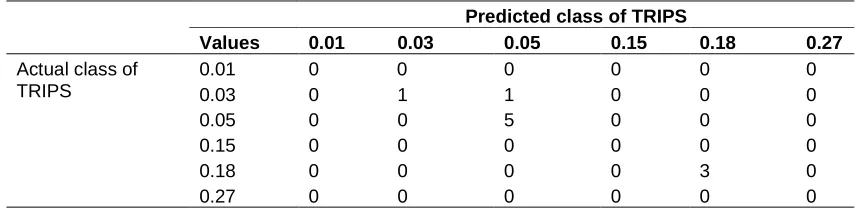
The proposed ANN model for this study was performed on 10 patients. For these patients, the TRIPS scores were calculated, and for the same patients, the TRIPS scores were predicted using the artificial neural network approach. The inputs from these patients involved in the artificial neural networks approach are presented in Table 4. These inputs made it possible to predict the TRIPS score. Additionally, considering the temperature, respiratory status, systolic blood pressure and response to noxious stimuli values of the same patients, TRIPS scoring was conducted, as presented in Table 4. Table 5 presents the confusion matrix for these patients.
the artificial neural network predicted value is 0.05. In TRIPS scoring, 0.03 is located in one lower category below 0.05, and one category deviation may not be significant. The predicted score in fact provides information regarding the state of the baby, suggesting that our artificial
neural network model is successful in predicting
the TRIPS values. With this prediction method, it is possible to determine which transportation
request will require more immediate action in the event of multiple transportation requests.
Table 3. Artificial neural network results on different hidden layers
Neuron number in hidden layer
Performance values
Learning Validation Test All (R) R2 MSE
8 0.89402 0.92878 0.87618 0.89458 0.8003 0.4793
9 0.90917 0.91332 0.8104 0.89914 0.8085 0.4363
10 0.86301 0.93636 0.91438 0.87391 0.7637 0.3833
11 0.91445 0.88454 0.91838 0.91012 0.8283 0.6115
12 0.95292 0.91853 0.94975 0.94909 0.9008 0.2062
13 0.88004 0.88744 0.85227 0.87509 0.7658 0.5472
14 0.91366 0.94508 0.87931 0.90872 0.8258 0.3787
15 0.79253 0.9034 0.79277 0.80137 0.6422 0.6815
7
Table 4. Input, calculated and predicted output values for the new 10 patients
Patient no
Input values Output values
Gender Gestation week (Week)
Birth weight (Gram)
Transportation day
(Day)
Transportation location
Transportation distance (km)
Calculated score of TRIPS
Artificial neural network value-predicted score of TRIPS
1 Male 40 2700 5 Out-of-Province 210 0.05 0.05
2 Female 26 1150 5 Out-of-Province 210 0.18 0.18
3 Male 39 2000 2 Out-of-Province 240 0.05 0.05
4 Female 26 850 1 Out-of-Province 220 0.18 0.18
5 Male 27 800 16 Inner Province 10 0.05 0.05
6 Male 34 1800 9 Out-of-Province 130 0.03 0.03
7 Female 26 970 3 Out-of-Province 210 0.18 0.18
8 Male 26 1030 3 Out-of-Province 130 0.05 0.05
9 Male 37 2750 2 Out-of-Province 200 0.05 0.05
Table 5. Confusion matrix for actual and predicted class of TRIPS
Predicted class of TRIPS
Values 0.01 0.03 0.05 0.15 0.18 0.27 Actual class of
TRIPS
0.01 0 0 0 0 0 0
0.03 0 1 1 0 0 0
0.05 0 0 5 0 0 0
0.15 0 0 0 0 0 0
0.18 0 0 0 0 3 0
0.27 0 0 0 0 0 0
4. CONCLUSION
In the present study, the values of gender, birth weight, gestation week, transportation day, transportation location and transportation
distance were taken as inputs, and the mortality rates based on the TRIPS score
were attempted to be predicted using artificial neural networks. At the end of the predictions, the health conditions and survival possibilities of the newborns could be evaluated without actually visiting the newborns. This evaluation before transportation is of significant importance in the case of multiple requests for transportation. Accordingly, predicting the mortality rates based
on TRIPS score prior to transportation will help determine which newborn is of higher vitality risk and thus requires high-priority transportation.
In addition, due to prediction of the mortality rates before transportation, the person that organises
the transportation scheduling will determine the equipment on the transportation depending
on the predicted mortality rate of the newborn, which will also contribute to efficient use of equipment and better transportation for the patient.
5. RECOMMENDATIONS AND FUTURE DIRECTION
Number of samplings can be increased for future studies. Also model might be enhanced with an addition of equipment and staff distribution.
CONSENT
All authors declare that ‘written informed consent was obtained from the patient (or other approved parties) for publication of this case report and accompanying images.
ETHICAL APPROVAL
All authors hereby declare that all experiments have been examined and approved by the appropriate ethics committee and have therefore been performed in accordance with the ethical standards laid down in the 1964 Declaration of Helsinki.
ACKNOWLEDGEMENTS
We express our gratitude to the hospital management that provided access to their information on the newborn transportation process and Veda ARSLAN, a transportation nurse, for her contribution during the collection of data.
COMPETING INTERESTS
Authors have declared that no competing interests exist.
REFERENCES
1. Leslie AJ, Stephenson TJ. Audit of neonatal intensive care transport. Archives of Disease in Childhood-fetal and Neonatal Edition. 1994;71:61–66.
2. Greene WT. Organization of neonatal transport services in support of a regional referral center. Clinics in Perinatology. 1980;7(1):187-195.
4. Tekin N, Akşit A, Dinleyici EÇ, Yarar C, Mert D. Osmangazi Üniversitesi Tıp Fakültesi Neonatoloji Ünitesi’ne başvuran yenidoğanların transport koşullarının değerlendirilmesi (Evaluation of transport conditions in newborns who referred to Osmangazi University Medical Faculy Division of Neonatology). Perinatal Journal. 2001;9(4):1-5. (In Turkish). 5. Öztürk MA, Büyükkayhan D, Köklü E.
Perinatal ve neonatal dönemde yenidoğanın nakli (The transport on newborns in the perinatal and neonatal period). Erciyes Medical Journal. 2007; 29(3):252-260. (In Turkish).
6. Uslu S, Aldudak B, Özdemir H. Diyarbakır’da hasta yenidoğanın taşınması konusunda yapılan iyileştirme çalışmaları ve bebeklere yansımaları (The effects of improvement efforts on regional neonatal transport conditions in Diyarbakır). Turkish Archives of Pediatrics. 2011;46(3):196-201. (In Turkish).
7. Bouchut JC, Van Lancker E, Chritin V, Gueugniaud PY. Physical stressors during neonatal transport: Helicopter compared with ground ambulance. Air Medical Journal. 2011;30(3):134-139.
8. Kumar PP, Kumar CD, Shaik FAR, Ghanta SB, Venkatalakshmi A. Prolonged neonatal interhospital transport on road: Relevance for developing countries. Indian Journal of Pediatrics. 2010;77(2):151-154.
9. Mohamed MA, Aly H. Transport of premature infants is associated with increased risk for intraventricular haemorrhage. Archives of Disease in Childhood-fetal and Neonatal Edition. 2010;95(6):403-407.
10. Cockburn F, Cooke RWI, Gamsu HR,
Greenough A, Hopkins A, McIntosh N, et al. The CRIB (clinical risk index for
babies) score: A tool for assessing initial neonatal risk and comparing performance of neonatal intensive care units. The Lancet. 1993;342(8865):193-198.
11. Richardson DK, Corcoran JD, Escobar GJ,
Lee SK. SNAP-II and SNAPPE-II: Simplified newborn illness severity and mortality risk scores. The Journal of
Pediatrics. 2001;138:92-100.
12. Sutcuoglu S, Celik T, Alkan S, Ilhan O, Ozer EA. Comparison of neonatal transport scoring systems and transport-related mortality score for predicting
neonatal mortality risk. Pediatric Emergency Care. 2015;31(2):113-116. 13. Lee SK, Zupancic JA, Pendray M,
Thiessen P, Schmidt B, Whyte R, et al. Transport risk index of physiologic stability: A practical system for assessing infant transport care. The Journal of Pediatrics. 2001;139(2):220-226.
14. Lucas da Silva PS, Euzébio de Aguiar V, Reis ME. Assessing outcome in interhospital infant transport: The transport
risk index of physiologic stability score at admission. American Journal of
Perinatology. 2001;29:509–514.
15. Kurt I, Ture M, Kurum AT. Comparing
performances of logistic regression,
classification and regression tree, and neural networks for predicting coronary artery disease. Expert Systems with Applications. 2008;34(1):366-374.
16. Chowdhury DR, Chatterjee M, Samanta
RK. An artificial neural network model for neonatal disease diagnosis. International Journal of Artificial Intelligence and Expert Systems. 2011;2(3):96-106.
17. Palaniappan S, Awang R. Intelligent heart disease prediction system using data mining techniques. In computer systems and applications. IEEE/ACS International Conference on. 2008;108-115.
18. Temurtas H, Yumusak N, Temurtas F. A comparative study on diabetes disease diagnosis using neural networks. Expert Systems with Applications. 2009;36(4): 8610-8615.
19. Karamanli H, Yalcinoz T, Yalcinoz MA,
Yalcinoz T. A prediction model based on artificial neural networks for the diagnosis of obstructive sleep apnea. Sleep and Breathing. 2016;20(2):09-514.
20. Santos-Garcia G, Varela G, Novoa N, Jiménez MF. Prediction of postoperative morbidity after lung resection using an artificial neural network ensemble. Artificial Intelligence in Medicine. 2004;30(1):61-69. 21. Silva Á, Cortez P, Santos MF, Gomes L,
Neves J. Mortality assessment in intensive care units via adverse events using artificial neural networks. Artificial Intelligence in Medicine. 2006;36(3):223-234.
23. Warner B, Misra M. Understanding neural networks as statistical tools. The American Statistician. 1996;50(4):284-293.
24. Hagan MT, Menhaj MB. Training
feedforward networks with the Marquardt algorithm. IEEE Transactions on Neural Networks. 1994;5(6):989-993.
25. Arora P, Bajaj M, Natarajan G, Arora NP, Kalra VK, Zidan M, et al. Impact of interhospital transport on the physiologic status of very low-birth-weight infants. American Journal of Perinatology. 2014; 31:237–244.
26. Crescenzi F, Gente M, Di Lallo D, Franco F, Landolfo F, Di Lella O, et al. Effectiveness of neonatal emergency transport service at different gestational age: An epidemiological study in Lazio Region. Pediatric Research. 2011;70:630-630.
27. Alvarado-Socarras J, Bermon A, Bernal N, Naranjo Estupiñán NF, Idrovo AJ. Intra-hospital mortality among neonates transported by ambulance in Colombia. Pediatrics International. 2014;56(4):571-576.
_________________________________________________________________________________
© 2016 Dağsuyu et al.; This is an Open Access article distributed under the terms of the Creative Commons Attribution License (http://creativecommons.org/licenses/by/4.0), which permits unrestricted use, distribution, and reproduction in any medium, provided the original work is properly cited.
Peer-review history:
![Fig. 1. TRIPS scale (Lucas da Silva et al. [14])](https://thumb-us.123doks.com/thumbv2/123dok_us/1723516.1219758/3.612.95.302.387.628/fig-trips-scale-lucas-silva-al.webp)