Programming Based Study of Shading Effect
in a Photovoltaic Array
Pankaj Verma1, Prasenjit Basak2
M.E Scholar (Power System), Dept. of Electrical and Instrumentation Engineering, Thapar University, Patiala, India.1
Assistant Professor, Dept. of Electrical and Instrumentation Engineering, Thapar University, Patiala, India 2
ABSTRACT: The photovoltaic cells have proved to be the most successful way of harnessing electric power from the solar radiations, the electric power produced by the photovoltaic cell depends upon many factors, shading effect is one of the factor. The output of a photovoltaic module reduces drastically even if one cell is under the shade. The effect of shading on the photovoltaic array is studied by making a user defined model of photovoltaic array in Simulink which is programmed according to the basic governing equations of photovoltaic cell. Various Voltage Current (V-I) and power time (P-t) curves of the solar array under shade are utilized to study the effects of shading graphically. The concept of back diode which aims at improving the response of solar cell under shade is further used by modifying the programming of photovoltaic array, the improved new results are hence obtained. All the work is carried out in Simulink and Script in MATLAB.
KEYWORDS: Photovoltaic (PV), Voltage current (V-I) curve, Power time (P-t) curve.
I.INTRODUCTION
The power production phenomenon in India has undergone a drastic change since recent few years, the interest in the renewable resources of energy is at its peak than ever before in past. One of the major factor for this change is the abundance in which these resources are available in the nature. Although the wind power has proved to be the most successful way of harnessing renewable energy but the most popular source is the solar energy. The power generation from the wind turbines is purely area specific i.e. that particular area must have the sufficient amount of wind currents in an year but on the other hand the solar radiations hits almost entire of the Indian region.
The scientifically proven way of harnessing the solar energy is by utilizing the photovoltaic (PV) cell. The output of this PV cell do not remain constant for 24 hours in a day, it depends upon the insolation level to which cell is exposed, ambient temperature and shading of the cell [1]. The solar insolation and temperature effects on the output of the PV cell is beyond the scope of this paper, the entire work is considered for the shading effect of the PV cell or cells when connected in series to form a module and arrays. There are a large number of control strategies [2-11] available which are used by various authors to improve the output response of the PV array when one or few cells in an array are under the shading effect. For e.g., the control strategy to allow the smooth operation of PV-PP (power plant) under partial shade is given in [11], PV panel model, working under uniform solar insolation and partial shade is explained in [12] and the dynamic model of PV arrays under moving shadow is presented in [13].
II.EQUIVALENT MODEL AND PHYSICS OF SHADING
A simple equivalent circuit model for a photovoltaic cell consists of a real diode in parallel with an ideal current source. The ideal current source delivers current in proportion to the solar flux to which it is exposed (ISC), but a more practical
equivalent circuit includes a parallel leakage resistance RP and a series resistance RS [1] as shown in Fig. 1.
Fig. 1 Equivalent circuit of PV cell [1] The governing equations of the model are
I = I −I e . −1 −V /R (1)
V = 0.0257ln( + 1) (2)
V = V −IR (3)
Where IO is the reserve saturation current and Vd is the diode voltage. Now consider the Fig. 2 in which the n cells are
connected in series and the top most cell is under shade. Now the voltage contribution of that cell will be zero plus the module current flowing through the series and parallel resistance of that cell will reduce the net voltage of the module.
Fig. 2 A module with n cells in which top cell is shaded [1] The output voltage of the module when one cell is shaded is given as
V = V −I(R + R ) (4)
V = V (5) Combining (4) and (5) gives
V = V−I(R + R ) (6)
the drop on the voltage at any given current I, caused by shaded cell, is given by
∆V = V−V = V− 1− V + I(R + R ) (7)
∆V = + I(R + R ) (8)
Since the parallel resistance RP is so much greater than the series resistance RS, so (8) simplifies to
∆V≅ + IR (9)
III.MATLAB SIMULINK MODEL AND PROGRAMMING OF PV ARRAY
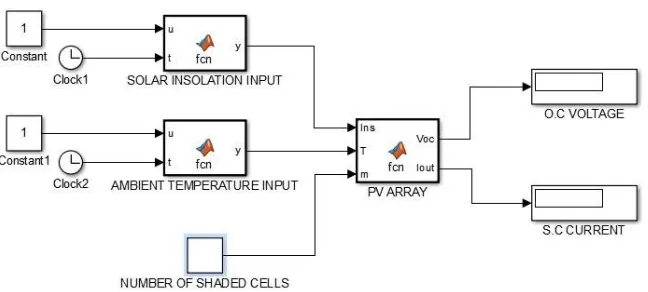
The MATLAB Simulink model of the PV array is shown in Fig. 3. The solar data of Patiala for the month of April is considered for the study which is given as the input to PV array by using another user defined functions. The sample solar data is given in Table 1.
Table 1 Solar insolation and temperature data Time
Division
Hours Solar Insolation
(W/m2)
Temperature (oC) 0-1 9-10 474.1953 34.25 1-2 10-11 647.55 38.75 2-3 11-12 777.09 41 3-4 12-1 819.93 42.6 4-5 1-2 804.40 43.6 5-6 2-3 719.65 44 6-7 3-4 536.36 43 7-8 4-5 321.88 42
In Fig. 3, the lowest block is the third input to the PV array which is a constant defining the number of shaded cells in a module and hence its value can be changed as accordingly
.
The programming code of the PV array block is given below, The short circuit current changes in direct proportion to solar flux, the change in the temperature effect of the PV cell is accommodated by utilizing the fact that open circuit voltage of the PV cell drops by 0.37% for each degree rise and short circuit current increase by 0.05% for each degree rise [1], while the shading effect is programmed using the equations (4-5).
function [Voc,Iout]= fcn(Ins,T,m)
%#codegen
Rs=0.005; % Series resistance
Rp=6.6; % Parallel resistance
Io=((10^-10)); % reverse saturation current
Vd=0.5; % diode junction voltage
n=25; % no of cells in series in a module
ns=17; % no of modules in series in an array
np=13; % no of 200 V module in parallel in an array
% Irradiance effect
Isc1=4; % Short Circuit current at STC
Isc2=(Ins/1000)*Isc1; Isc=Isc2*(1+(0.0005*(T-25))); Id=Io*(exp(38.9*Vd)-1); I=(Isc-Id-(Vd/Rp)); Iout=np*I; Voc1=ns*n*(Vd-(I*Rs));
% Temperature effect
Voc2=Voc1*(1-(0.0037*(T-25))); Voc3=Voc2;
% Shading effects
dV=m*((Voc3/(n+ns))+(I*Rp)) Voc= Voc3-dV;
IV.SHADING OF CELLS
Consider the shading of the cells in each of the 13, 200 Volt modules (17×25×0.4805) which are connected in parallel to make an array as shown in Fig. 4.
Fig. 4 Schematic arrangement of a PV array
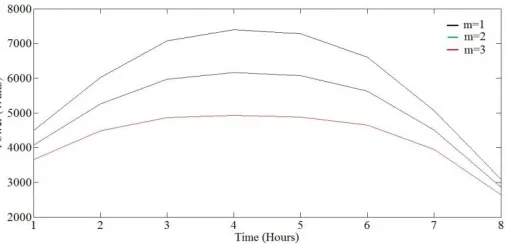
The shading of the cells in the module is reflected in the program by changing the value of constant ‘m’ in the Simulink model. The V-I curves of the PV array when m=1 (One cell shaded), m=2 (two cells shaded), m=3 (three cells shaded) under the sample solar data of Table 1 are shown in Fig. 5. It is assumed that the shading of cells takes place simultaneously in each of the parallel connected module.
Fig. 5 V-I curves of the PV array under shading of cells
The careful observation of the Fig. 5 reveals that the V-I curve shifts downwards as the number of shaded cells in a module increases hence proving the significant drop in the open circuit voltage with the shading of the cells. The power supplying capability of the PV array also gets reduced with the phenomenon of shading which is illustrated in Fig. 6.
V. BYPASS DIODE
The voltage drop problem across the shaded cell can be averted by adding a bypass diode in parallel with the shaded PV cell as show in Fig. 7. When a cell is in the full sun the voltage rise across the cell cut off the bypass diode and no current flows through it. Now when the cell is shaded the voltage share of that cell is nil and the module current instead of passing from the series and parallel resistance of the cell passes through the bypass diode hence turning on the diode, this diverting of the current eliminates the voltage drop caused by series and parallel resistance of the cell during shading.
Fig. 7 Bypass diode in parallel with Shaded cell [1]
VI. IMPROVED RESULTS WITH BYPASS DIODE
The programming of the bypass diode is undertaken by eliminating the voltage drop across the parallel resistance which is shown in programming under the heading of shading effect. The comparisons of V-I curves of PV array with and without bypass diode under sample data for different number of shaded cells is shown in Fig. 8 to Fig. 10.
Fig. 8 V-I curve for PV array with and without bypass diode for m=1
Fig. 9 V-I curve for PV array with and without bypass diode for m=2
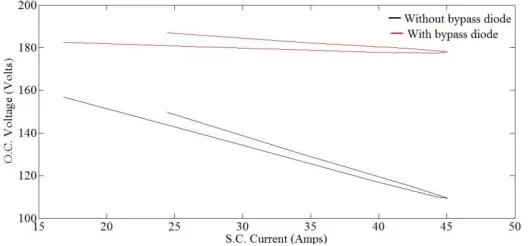
Fig. 9 shows the comparison of the V-I curves of PV array for the case of two shaded cells in a module. The open circuit voltage level of array is lifted from 168-170 Volts to the new level of 192-196 Volts when simulated with the bypass diode across each shaded cell. In the same fashion Fig. 10 shows the new improved results of open circuit voltage when three cells are shaded in a module. The voltage level without bypass diode is 155-159 Volts while the voltage level with bypass diode is 192-196 Volts.
Fig. 10 V-I curve for PV array with and without bypass diode for m=3
The voltage level of the PV array is lifted when the bypass diodes are used in parallel with the shaded cells which is illustrated in Fig. 8 to 10. The power supplying capability of the PV array is also improved when the bypass diodes are used with the solar cells, due to improvement in voltage profile of the array. The comparison of the P-t curves for different cases are given in Fig. 11 to 13.
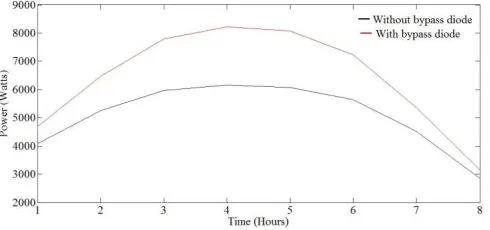
The comparison of P-t curves with and without bypass diode for the case of one shaded cell is shown in Fig. 11. The maximum power supplying capability of PV array has improved from 7000 Watts (without bypass diode) to 8200 Watts when the bypass diode is used in parallel with the shaded cell.
Fig. 12 P-t curve for PV array with and without bypass diode for m=2
Fig. 12 shows a similar comparison of P-t curves as in Fig. 11 but for the case of two shaded cells in a module. The maximum power supplying capability of PV array has now improved from 5800 Watts to 8200 Watts with the modification of bypass diode with each shaded cell. The PV array model is simulated for given sample solar data of Table 1 for all the cases. Fig. 13 is also a similar comparison for three shaded cells with maximum power level lifted from 4500 Watts to 8200 watts.
Fig. 13 P-t curve for PV array with and without bypass diode for m=3
VII. CONCLUSIONS
The shading of the cells in a module causes a significant drop in the output voltage level of the PV module/array. The drop in the voltage and in power availability from the PV array is illustrated by using V-I and P-t curves obtained by programming the PV array in user defined MATLAB function. The bypass diode, which improves the voltage profile of the PV module when cells are under shade is modelled in the code of PV array and the improved results of the V-I and P-t curves are hence obtained.
REFERENCES
[1] Gilbert M. Masters, “Photovoltaic materials and electrical characteristics,” Renewable and efficient electric power systems, Stanford
University.
[2] A. Fezzani, I. Hadj Mahammed , and S. Said, “MATLAB-Based Modeling of Shading Effects in Photovoltaic arrays,” 15th international
conference on Sciences and Techniques of Automatic control & computer engineering, pp. 781-787, 2014
[3] Xue Lin, Yanzhi Wang, Siyu Yue, Donghwa Shin, Naehyuck Chang, Massoud Pedram, “Near-Optimal, Dynamic Module Reconfiguration in a
[4] V. P. Anand, O. B Priyan, Bala Pesala, “Effect of shading losses on the performance of solar module system using MATLAB Simulation,” Electrical Energy Systems (ICEES), IEEE 2nd International Conference, pp. 61-64, 2014.
[5] Nikolay Telzhensky, Ilya Zeltser, Mor. M. Peretz, “Simple Method of PV Cells Balancing for Maximum Power Harvesting in Partially Shaded
Environment,” Electrical & Electronics Engineers in Israel (IEEEI), IEEE 28th Convention of Year 2014, pp.1-5,2014.
[6] S. Vemuru, P. Singh, and M. Niamat, “Modeling impact of bypass diodes on photovoltaic cell performance under partial shading,” in Proc.
IEEE Int. Conf. Electro Inf. Technology, pp. 1–5, 2012.
[7] D. Nguyen and B. Lehman, “An adaptive solar photovoltaic array using model-based reconfiguration algorithm,” IEEE Trans. Ind. Electron.,
vol. 55, no. 7, pp. 2644–2654, Jul. 2008
[8] M. Z. S. El-Dein, M. Kazerani, and M. M. A. Salama, “Optimal photovoltaic array reconfiguration to reduce partial shading losses,” IEEE
Trans. Sustain. Energy, vol. 4, no. 1, pp. 145–153, Jan. 2011.
[9] R. Ramaprabha and B. L. Mathur, “Characteristics of solar PV array under partial shaded conditions,” in Proc. IEEE Reg. 10 Conf. TENCON,
pp. 1–5, 2008.
[10] E. V. Paraskevadaki and S. A. Papathanassiou, “Evaluation of MPP voltage and power of mc-Si PV modules in partial shading conditions,”
IEEE Trans. Energy Convers., vol. 26, no. 3, pp. 923–932, Sep. 2011.
[11] C. Rahmann, V. Vittal, J. Ascui, and J. Haas, “Mitigation Control Against Partial Shading Effects in Large-Scale PV Power Plants,” IEEE
Transactions on Sustainable Energy, Vol. 7, no. 1, pp. 173-180, 2016.
[12] Jeisson C. Gamba, Alvaro Romero, and Johann Hernandez, “Development of a photovoltaic panel model to find the solar cells optimal
reconfiguration under partial shading condition,” IEEE 42nd Photovoltaic specialist conference (PVSC), pp. 1-6, 2015.
[13] Yang Haoyuan, Yan Shuo, Siew-Chong Tan, S.Y.R. Hui, “Dynamic Modeling of Partial Shading on Photovoltaic Array,” IEEE Energy
![Fig. 1 Equivalent circuit of PV cell [1]](https://thumb-us.123doks.com/thumbv2/123dok_us/7775657.1282119/2.595.242.359.508.672/fig-equivalent-circuit-pv-cell.webp)
![Fig. 7 Bypass diode in parallel with Shaded cell [1]](https://thumb-us.123doks.com/thumbv2/123dok_us/7775657.1282119/6.595.225.377.267.390/fig-bypass-diode-parallel-shaded-cell.webp)