Estimation of Mean Arterial Pressure from
ECG and BP using Mathematical Model
R.R.Magavi1, Rayeesabanu.I.Jinabade2
Assistant Professor, Dept. of ECE, Maratha Mandal Engineering College, Belgaum, Karnataka, India1
PG Student [DECS], Dept. of ECE, Maratha Mandal Engineering College, Belgaum, Karnataka, India2
ABSTRACT: as of late, cardiovascular illness is one of the principle illnesses which threats human’s wellbeing and existence with most astounding death rate among different diseases. Peculiarly high blood pressure (BP) or hypertension contributes to cardiovascular diseases (CVD). An exact non-invasive approximation of mean arterial pressure (MAP) is of significant in the appraisal of circulatory function and diagnosis of various cardiovascular illnesses. MAP estimation technique based on the depending on pulse transit time (PTT) of cuff pressure (CP). The PTT calculated as the time space between the electrocardiogram (ECG) R-peaks and the most inclined points on the oscillometric pulses is precisely represented by considering the cuff-arm-artery framework in addition with blood flow dynamics. It is then diagnostically shown that MAP can be diagnostically demonstrated as the CP at which the PTT is extreme. In view of our hypothetical discoveries, another strategy for MAP estimation from concurrent ECG and Blood Pressure estimations is proposed.
KEYWORDS: Blood Pressure(BP), Cardovascular Disease(CVD), Mean Arterial Pressure(MAP) , Pulse Transit Time (PTT), Cuff Pressure (CP), Eletrocardiogram(ECG), Systolic Bloood Pressure (SBP), and Distolic Blood Pressure.(DBP).
I.INTRODUCTION
The human heart is a muscular organ and its function is exemplified by alternating intervals of contraction and relaxation. Throughout the contraction stage (systole), blood is driven out from the both of the left and right ventricles and impelled into the organised circulation and pulmonary circulation, relevantly. Throughout the relaxation stage of the heart (diastole), the ventricles are filled up with the blood in organising for subsequent contraction phase. Although systolic and diastolic arterial blood pressure values are significant measurements and contain tremendous diagnostic value, it is the mean arterial pressure (MAP) that drives blood all the way through the vasculature from arteries to arterioles, capillaries, venules, veins, and then back to heart.
Mean Arterial Pressure is estimated for the instance-subjective average of blood pressure values in large system arteries throughout the cardiac phase. The mean arterial pressure corresponds to the average arterial pressure throughout the cardiac cycle, in addition to it is the force that constrains the blood all the way through the vasculature. Mean arterial pressure is the instance-weighted arithmetic mean of pressure values in bulky arteries through the cardiac phase. The function of Mean arterial pressure is (1) The rate of heart pumping the blood into bulky arteries, (2) the rate of flow of blood out from large arteries to get into the smaller arteries and arterioles (3) Compliance of the arterial wall.
A precise non-invasive approximation of mean arterial pressure (MAP) has an immense significance in the analysis of circulatory purpose and prognosis of various cardiovascular diseases. Electrocardiogram (ECG) is almost the periodic signals that imitate the activities of heart [8]. Sufficient information regarding the normal and pathological physiology of heart can be acquired from ECG and BP
which the pressure fall of the arteries to the low level and fills the blood in chambers of heart. Blood pressure approximation would be either Invasive (direct) or Non-invasive (indirect)
Fig 1: The Cardiac Cycle. Definition of Systole and Diastole. Opening And Closure of the Aortic and Mitral Valves
The electrocardiogram, or ECG, is the widely used test to review the heart[10]. The ECG is commonly used due to its capability to screen the variety of cardiac irregularilities. ECG devices are most commonly available in every alternate medical amenity, and the ECG test is easy to perform, (safe and low-cost). Tracing the ECG signal, various information of the heart is identified as follows
Rate of the Heart.
Rhythm of the Heart.
Thickness of Heart Muscle in order to check the abnormalities.
Information regarding the prior heart attack.
To check about the coronary artery disease.
O know about the “conduction abnormalities” in the heart
An ECG is a sequence of waves and deflections tracings of the heart’s electrical signals [10] from an undeniable “view”. A normal ECG signal is shown in Fig 2
Fig 2: Various Views of ECG
II.LITERATURE SURVEY
Franklin et al leaned at a new concept at the debated issue for knowing which BP element best confine the BP-related cardiovascular issue. The authors take an advantage of the potentially gathered data of Framingham Heart Study. In 9657 adults free from the cardiovascular illness and with no anti hypertensive treatment, the authors authenticated that SBP is most stronger risk issue for cardiovascular illness than DBP. More significantly, they gave a demonstration that the combined appraisal of SBP and DBP increases the cardiovascular threat prediction over the 2 different components. The model including both the SBP and DBP values were significantly improved than the model which includes a single BP component (SBP or DBP) for predicting the cardiovascular issue, while the increase in area of the characteristic curve under the receiver operating of the SBP-plus-DBP model comparing with the SBP model has a lower in the multivariate-regulates than the irregulated model, which recommend that few of the augmentation prognostic information given by DBP might be comprised in the other frequently accepted issue markers. Within the circumstances of its restrictions. It is recommended that stroke may privilege to be predicted by the mean arterial pressure, while pulse pressure would have a great impact on coronary heart illness. Unfortunately, the concepts suggested by Franklin et al just measured overall cardiovascular ending points (mainly due to the power issue) but did not considered the coronary and cerebrovascular resulting separately
III.PROPOSED WORK
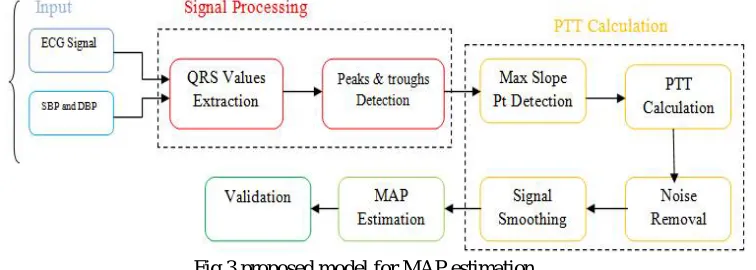
The proposed models aim to estimates the mean arterial pressure using the ECG and BP (SBP and DBP) values of the samples. The model [1] given below shows the block representation of the proposed model[4] which is as shown in the fig 3.
Fig 3 proposed model for MAP estimation Input
The input required for the proposed model is ECG signal and blood pressure values in the form of SBP and DBP values. Thus the, model uses simultaneous vales of ECG and SBP, DBP values in order to continue with further processing
ECG Signal Acquisition
ECG signal acquisition [2] varies depending on the transmitter receiver units. Either it supports wirelesstechnology or if there is a possibility of signal processing particularly on the count of electrocardiographic leads which can be examined at the same time, that are merely associated with the number of electrodes used. Every lead requires two electrodes. In conventional medicines, wherein exact analysis of cardiac disorders and illness is emphasized. Frequently all leadsare instantly examined. Electrocardiogram gives a complete summary of cardiac function
ECG Signal Extraction
The ECG Signal extraction [6] in Matlab program analyses the ECG recordings in order to get the P, QRS, and T of the ECG signal. The graphical user interface is quite easy to use and help us to get P, QRS and T values by the analysis of ECG signal. It is essential for the one who works on such programs need to choose the number of samples that can be considered for one cardiac phase in an ECG signal of the P-QRS-T waves.
Subsequently to extract the required information from the affected ECG signals, we are supposed to process the noisy ECG signals. The process includes the use of relevant filters and Thresholding levels of the signals. After providing with the thresholds. The signal is detrended to zero-crossings in order to continue with processing of the signal [6]. The flowchart for this is as in figure 4.
The software tool gives the main features of ECG Signal [8] processing and analysis which are as follows:
Load the ECG recordings from the source of data which may be in the form as text or binary files and excel files.
Save data as (txt, mat and xlsx types) depending on the type of data.
Read the ECG signal.
Removal the noise (low frequency components) from the ECG signals using by Golay filter [11].
Providing the threshold (i.e., zero crossings) in order to adjust the preprocessed signal
Extraction of P,QRS,T of the ECG signals
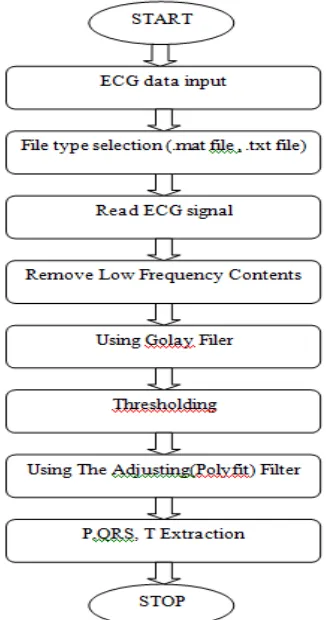
Firstly, read ECG data after selecting which lead you select and type of data from any type of file and then removing low frequency components after that using the Golay filter and later thresholding and then adjust filter and detect R-peaks to detect heart rate and P-QRS-T waves after a simple mathematical calculations by Matlab equations to calculate P, Q, R, S and T.
Fig 4: Flowchart for ECG Signal Processing PTT Calculation
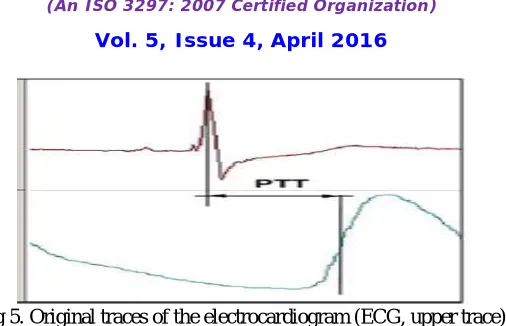
It is mainly accepted that the pulse transit time (PTT) [3] is associated with the arterial stiffness, thus can be used in order to approximate blood pressure. τp (t), τt (t), and τz (t) were measured as the time period between the ECG R-peaks
Fig 5. Original traces of the electrocardiogram (ECG, upper trace)
Showing the detection of R-wave and pulse wave in calculation of the pulse transition time (PTT)
The computed τp(t), τt (t), and τz(t) are conspired in the graylines, respectively. Since the calculated PTTs are very
noisy, several steps are performed before determining their true maximum, as follows:
1) Outlier Removal: An outlier removal method is applied to eliminate the PTT illustration that appears to be contradictory with the residue of the signal. The assumed outlier removal method in this paper depends on the robustness of quadratic polynomial function with the PTT signal. An outlier is characterized as a value more than the three standard deviations which are away as of the applied quadratic polynomial corresponded. The outliers are then eliminated and the same procedure is repeatedly used until outliers are not detected.
2) Smoothing: The PTTs are firstly smoothed by applying a moving average filter. Next, a cubic uneven spline function is fixed with the smoothed signal in order to eliminate the residual artifacts. As τt(t) demonstrates most of the
fluctuations, a 9-point moving average filter along with the spline function characterized by a smoothing parameter of 0.01 is utilized to smooth the signal. Alternately, τp (t) exhibits the slight fluctuations about its peak, and consequently,
it is smoothed utilizing a 3-point moving average filter along with spline function with smoothing constraint 0.2. τz(t)
was smoothed using a seven-point moving average filter and a spline function characterized by the smoothing constraint 0.02. The filter constraints utilized in this study are preferred empirically.
3) Maximum Detection: The smoothed PTTs were linearly interpolated and resample at 5 Hz. In order to avoid any remaining noise and artifacts, the search region for maximum was limited
MAP Estimation
The cuff pressure of the calculated PTT signal’s maximum is determined [1]. The detected maximum of PTT signal is the estimated MAP
Validation
For the validation purpose the values for the reference MAP are calculated from the huge dataset and the same is considered as reference MAP values. Thus here the MAP reference values are calculated using SBP and DBP values using the three different validation formulae [1].
1). 33% Formula
The principle for determining MAP using the measured SBP and DBP Values depends on addition of 33% of the pulse pressure to the DBP which is as shown below
Mean Arterial Pressure= DP+ 0.33*Y (1)
Where DP= diastolic pressure SP=Systolic pressure
Y= DP-SP (2)
2). 40% Formula
The uses of conventional formula of 33% under rate the MAP values. Thus as the part of correction the 33% co-efficient is replaced by the 40% co-co-efficient which is shown as follows
Mean arterial pressure=DP+0.40* Y (3)
3) Heart Rate-Dependent Formula:
Both the above used 33% as well as 40% formulae do not consider the effect of heart rate. Thus the new formula is proposed for calculation of MAP which uses the heart rate and obtains more accurate results. The heart rate dependent formula is as shown below
IV. EXPERIMENTAL RESULTS
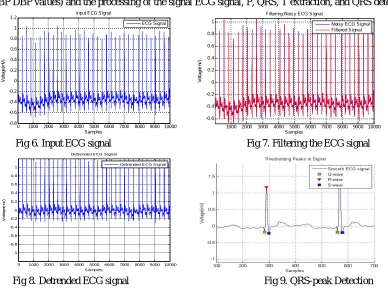
The results for the proposed work is shown at every stage of proposed block diagram including the data input (both ECG and SBP DBP values) and the processing of the signal ECG signal, P, QRS, T extraction, and QRS detection
Fig 6. Input ECG signal Fig 7. Filtering the ECG signal
Fig 8. Detrended ECG signal Fig 9. QRS-peak Detection
Fig 6,7and 8 shows the pre-processing of the ECG signal and fig 11 shows the SBP and DBP input Values and Fig 9 shows the QRS peak detection of the ECG Signal
Fig 10. Max R value of ECG Signal Fig 11. SBP and DBP inputs
Fig 10 shows the Max R value of the ECG signal and fig 12 shows the R-wave and S-wave in Noisy ECG signal and Fig 13 shows the filtered Signal
0 1000 2000 3000 4000 5000 6000 7000 8000 9000 10000 -0.8 -0.6 -0.4 -0.2 0 0.2 0.4 0.6 0.8 1 1.2
Input ECG Signal
Samples V o lt a g e (m V ) ECG Signal
1000 2000 3000 4000 5000 6000 7000 8000 9000 10000 -0.6 -0.4 -0.2 0 0.2 0.4 0.6 0.8 1 Samples V o lt a g e (m V )
Filtering Noisy ECG Signal
Noisy ECG Signal Filtered Signal
0 1000 2000 3000 4000 5000 6000 7000 8000 9000 10000 -1 -0.8 -0.6 -0.4 -0.2 0 0.2 0.4 0.6 0.8 1
Detrended ECG Signal
Samples V o lt a g e (m V )
Fig 12. R-wave and S-wave in Noisy ECG Signal Fig 13. Filtered Signal
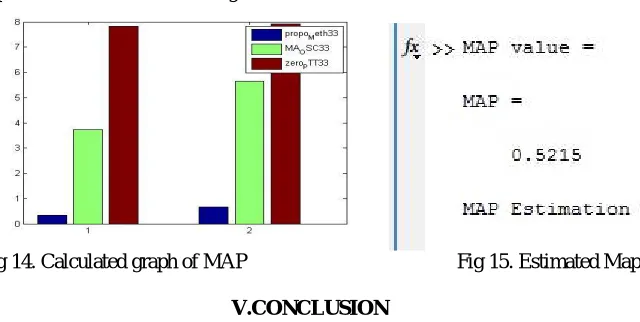
Fig 14 shows the graph of calculated MAP and Fig 15 shows the Calculated the MAP value
Fig 14. Calculated graph of MAP Fig 15. Estimated Map
V.CONCLUSION
The main reason for developing this paper was to develop some new mathematical model that could determine the behaviour of the Pulse transit time which is computed as the time period between the R-peaks of ECG signal and the SBP DBP pulses by which the MAP is estimated as the maximum detection of the PTT. The same estimated value is then validated using 3 different formulae which were used to calculate the reference values with our calculated values from the proposed model
REFERENCES
[1] M. Forouzanfar, S. Ahmad, I. Batkin, H.R. Dajani, V.Z. Groza, and M. Bolic, “Model-Based Mean Arterial Pressure Estimation Using Simultaneous electrocardiogramand oscillometric blood pressure measurements,” IEEE Transactions on Instrumentation and Measurement, Vol. 64, pp. 2443-2452, Mar. 2015.
[2] Apoorva Mahajan, Ankita Batni, Mayuri Dongre “ Acquisition, Filtering and Analysis of ECG Using MATLAB” (IJARECE) Volume 4, Issue 5, May 2015
[3] Mohamad Forouzanfar∗, Student Member, IEEE, Saif Ahmad, Izmail Batkin, Hilmi R. Dajani, Senior Member, IEEE, Voicu Z. Groza, Fellow, IEEE, and Miodrag Bolic, Senior Member, IEEE “Coefficient-Free Blood Pressure Estimation Based on Pulse Transit Time–Cuff Pressure Dependence IEEE Transactions On Biomedical Engineering, Vol. 60, No. 7, July 2013
[4] M. Forouzanfar, H. R. Dajani, V. Z. Groza, and M. Bolic, “Model-based Oscillometric blood pressure estimation,” in Proc. IEEE Int. Symp. Med.Meas. Appl. (MeMeA), Lisbon, Portugal, Jun. 2014, pp. 1–6.
[5] Harvard-MIT Health Sciences and Technology. (Aug. 2010). QRS Onset Detector.[Online]. Available:http://www.mit.edu/gari/CODE/ECGtools/ecgBag/sqrs.m.
[6] International Journal of Advanced Research in Electronics and Communication Engineering (IJARECE) “Acquisition, Filtering And Analysis Of ECG Using MATLAB” Volume 4, Issue 5, May 2015 1170 All Rights Reserved © 2015 IJARECE
[7] J. Parak, J. Havlik” ECG SIGNAL PROCESSING AND HEART RATE FREQUENCY DETECTION METHODS”
[8] ECG signal processing using Matlab by Fourier series