Developing And Testing General Models Of
Spoken Dialogue System Performance
Marilyn Walker, Candace Kamm, Julie Boland
AT& T Labs - Research
180 Park Ave, Florham Park, N.J. 07932, U.S.A
fwalker, [email protected],[email protected]
Abstract
The design of methods for performance evaluation is a major open research issue in the area of spoken language dialogue systems. This paper presents the PARADISE methodology for developing predictive models of spoken dialogue performance, and shows how to evaluate the predictive power and generalizability of such models. To illustrate the methodology, we develop a number of models for predicting system usability (as measured by user satisfaction), based on the application of PARADISE to experimental data from two different spoken dialogue systems. We compare both linear and tree-based models. We then measure the extent to which the models generalize across different systems, different experimental conditions, and different user populations, by testing models trained on a subset of the corpus against a test set of dialogues. The results show that the models generalize well across the two systems, and are thus a first approximation towards a general performance model of system usability.
1.
Introduction
The development of methods for evaluating, comparing and predicting system performance is a major open research issue in the area of spoken dialogue systems (SDSs). In 1997, we proposed PARADISE (PARAdigm for DIalogue System Evaluation) as a general integrative framework for evaluating SDSs (Walker et al., 1997). PARADISE ad-dressed three research goals:
to support the comparison of multiple systems or mul-tiple versions of the same system doing the same do-main tasks.
to provide a method for developing predictive models of the usability of a system as a function of a range of system properties.
to provide a technique for making generalizations across systems about which properties of a system im-pact usability, i.e. to figure out “what really matters to users”.
In previous work, we conducted several within-system comparisons, based on the application of PARADISE to experimental dialogues(Kamm et al., 1998; Litman et al., 1998; Walker et al., 1998a), and used PARADISE per-formance models as an objective perper-formance function for learning optimal dialogue strategies via reinforcement learning (Walker et al., 1998b; Walker, 2000). In this pa-per, we test the predictive power and generalizability of the models using experimental data from ANNIE, a SDS for voice dialing and messaging, and ELVIS, an SDS for ac-cessing email. We first develop a number models for pre-dicting system usability (as measured by user satisfaction). Then we measure the extent to which these models gen-eralize across systems, experimental conditions, and user populations, by testing models trained on a subset of the corpus against a test set of dialogues. The experimental corpus consists of 376 ANNIE and ELVIS dialogues con-sisting of approximately 30 hours of speech, representing both expert and novice populations.
The structure of the paper is as follows. We first review the PARADISE evaluation framework in section 2.. Then section 3. describes the ANNIE and ELVIS systems and the experimental setup for collecting the corpus of dialogues. Section 4. presents results from developing predictive mod-els of user satisfaction and testing these modmod-els on subsets of the corpus. We then discuss the results and suggest areas for future work.
2.
PARADISE
The state of the art in evaluating SDSs, prior to the pro-posal of the PARADISE framework, was to evaluate the SDS in terms of a battery of both subjective and objec-tive metrics. Some of these metrics focused on task com-pletion or transaction success. Others were based on the performance of the SDS’s component technologies, such as speech recognizer performance (Sparck-Jones and Gal-liers, 1996; Hirschman et al., 1990; Ralston et al., 1995; Pallett, 1985). Subjective metrics included measures of user satisfaction (Shriberg et al., 1992), or ratings gener-ated by dialogue experts as to how cooperative the system’s utterances were (Bernsen et al., 1996).
The motivation for PARADISE was twofold. First, it is often useful to have a single number to use as a perfor-mance function for feedback to the system or for evaluation (Walker, 2000). When a set of metrics are used, several metrics may contradict one another. For example, Danieli and Gerbino compared two train timetable systems (Danieli and Gerbino, 1995), and found that one version of their SDS had a higher transaction success rate and produced fewer inappropriate and repair utterances, but that the other version produced dialogues that were approximately half as long. However, it was unclear whether a higher transaction success or the length of the dialogue was more critical to performance, or what tradeoffs between them might be ac-ceptable.
users’ perceptions of system performance depend on the dialogue strategy and on tradeoffs among other factors like efficiency, usability and accuracy (Sparck-Jones and Gal-liers, 1996; Hirschman et al., 1993).
EFFICIENCY
MEASURES
MEASURES
MINIMIZE COSTS
QUALITATIVE
SUCCESS
MAXIMIZE TASK
MAXIMIZE USER SATISFACTION
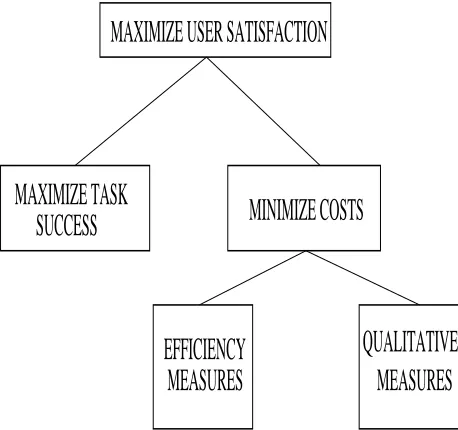
Figure 1: PARADISE’s structure of objectives for spoken dialogue performance.
The PARADISE framework derives a combined perfor-mance metric for a dialogue system as a weighted linear combination of a task-based success measure and dialogue costs. In order to specify what factors should go into this combined performance metric, PARADISE posits a partic-ular model of performance, illustrated in Figure 1. The model proposes that the system’s primary objective is to maximize user satisfaction. Task success and various costs that can be associated with the interaction are both contrib-utors to user satisfaction. Dialogue costs are of two types: dialogue efficiency and quality. Efficiency costs are mea-sures of the system’s efficiency in helping the user complete the task, such as the number of utterances to completion of the dialogue. Dialogue quality costs are intended to capture other aspects of the system that may have strong effects on user’s perception of the system, such as the number of times the user had to repeat an utterance in order to make the sys-tem understand the utterance.1
Applying PARADISE to dialogue data requires that di-alogue corpora be collected via controlled experiments dur-ing which users subjectively rate their satisfaction. In addi-tion, the other components of the model, i.e. task success and interaction costs, must be either automatically logged by the system or be hand-labeled. The PARADISE model posits that a performance function can then be derived by applying multivariate linear regression with user satisfac-tion as the dependent variable and task success, dialogue quality, and dialogue efficiency measures as independent variables.
1
Developing qualitative cost measures that can be measured automatically is an active area of research (Hirschman and Pao, 1993; Walker et al., 2000a).
Modeling user satisfaction as a function of task success and dialogue cost metrics is intended to lead to predictive performance models for SDSs, so that values for user satis-faction could be predicted on the basis of a number of sim-pler metrics that can be directly measured from the system logs, without the need for extensive experiments with users to assess user satisfaction. In order to make this predictive use of PARADISE a reality, the models that are derived from experiments with one set of systems or user popula-tions should be generalizable to other systems or other user populations. This paper reports results from applying PAR-ADISE to two different systems amd several different user populations, in order to begin to show what generalizations can be made across systems and user populations.
3.
Experimental Design
3.1. Experimental Setup
All of the experimental data used for the application of PARADISE was collected with a similar experimental setup. In each experiment, human subjects carried out a di-alogue using one of the didi-alogue systems, which was imple-mented using a general-purpose platform for phone-based spoken dialogue systems (Kamm etal. 1997). The AN-NIE experiments were designed to evaluate (1) the effect of novice versus expert user populations, and (2) the im-pact of a short tutorial on novice users. The ELVIS exper-iments were designed (1) to evaluate the effect of different dialogue strategies for managing initiative and presentation of information; and (2) to conduct experiments applying reinforcement learning to dialogue so that the ELVIS sys-tem could learn from experience which dialogue strategies are optimal (Walker et al., 1998b; Walker, 2000). The ex-periments required users to complete a set of application tasks in conversations with a version of the system. Each set of tasks was also designed to be representative of typ-ical tasks in that domain. We collected task completion, dialogue quality and dialogue efficiency metrics, as well as a user satisfaction measure for each dialogue.
Experiments with ANNIE were designed to be compa-rable with ELVIS so the users in the ANNIE experiments performed the same tasks as those for ELVIS. Each user had to perform three tasks in sequence in three difference conversations with the system. To examine the effect of a short tutorial, some users also performed an additional task as part of a tutorial interaction before starting the experi-mental tasks. The example email access task below was used for both ANNIE and ELVIS:
You are working at home in the morning and plan to go directly to a meeting when you go into work. Kim said she would send you a message telling you where and when the meeting is. Find out the Meeting Time and the Meeting Place.
text-to-speech when reading the message headers and the bodies of the messages.
A sample dialogue illustrating the completion of the same task with the system-initiative version of ELVIS is shown in the sample dialogue in Figure 3. In ELVIS, users could ask to hear a summary of their inbox, or ask to go ahead and read their messages. Once reading messages was initiated, users were prompted for message selection crite-ria, which allowed them to select messages based on their content by specifying values from the sender or the subject field. Since users could select a message directly rather than needing to linearly navigate through the folder, it was possi-ble for users of ELVIS to complete the task more efficiently. All of ELVIS’s utterances were realized via text-to-speech.
A. Annie here. U. Get my messages.
A. First message. “This is a message from Michael about Evaluation Technical memo”... (user barges in)
U. Next message.
A: Message 2. “This is a message from Kim about inter-viewing Antonio. I’d like to interview him. I could also go along to lunch. Kim.” 2:16 P.M. Monday, March 23rd. What’s next?
U: Next message.
A: Message 3. “This is a message from Kim about meet-ing today. The meetmeet-ing this mornmeet-ing is at 10:00 in 2d 516. See you there, Kim.” (user barges in)
U: I’m done here.
Figure 2: Sample Dialogue with the ANNIE system
E: Hi, ELVIS here. You have 5 new and 0 unread messages in your inbox. Say Read, Summarize, or say Help for more options.
U: Summarize.
E: In your top level inbox, from Kim, there’s 1 mes-sage about “Lunch.” and 1 mesmes-sage about “Meeting To-day”. From Michael, there’s 1 message about “Evalua-tion group meeting.” From Noah, there’s 1 message about “Call Me Tomorrow” and 1 message about “Interview-ing Antonio.” And from Owen, there’s 1 message about “Agent Personality.”
U: Read.
E: Select by Sender, Subject or in order of arrival? U: Sender.
E: Which Sender? U: Kim.
E: In the messages from Kim, there’s 1 message about “In-terviewing Antonio” and 1 message about “Meeting To-day.” The first message is titled, “Interviewing Antonio.” ( user barges in)
U: Next message.
A: “This is a message from Kim about meeting today. The meeting this morning is at 10:00 in 2d 516. See you there, Kim.”
U: I’m done here.
Figure 3: Sample Dialogue with ELVIS
The experiments resulted in 108 dialogues with the AN-NIE system and 268 dialogues with the ELVIS system, con-sisting of approximately 30 hours of speech.
3.2. Data Collection
Here, we discuss in detail the metrics that were logged and hand-labeled in experiments with both systems. We have not previously made specific recommendations about what metrics to use, as we consider this an active area of research (Walker et al., 2000a; Polifroni et al., 1998; Hirschman and Pao, 1993; Rudnicky, 1993; Danieli and Gerbino, 1995; Bernsen et al., 1996; Sanderman et al., 1998; Larsen, 1999). However, any metric for task success, dialogue efficiency or dialogue quality previously proposed in the literature can be easily incorporated into the PAR-ADISE framework.
The metrics for these experiments are based on a com-bination of dialogue quality and efficiency measures, and mainly focus on those measures that could be automatically logged or computed. Three different methods were used to collect the data: (1) All of the dialogues were recorded; (2) The dialogue manager logged the system’s dialogue behav-ior and a number of other measures discussed below; (3) Users filled out web page forms after each task (task suc-cess and user satisfaction measures). Measures are summa-rized in Figure 4 and described in more detail below.
Dialogue Efficiency Metrics
– elapsed time, system turns, user turns
Dialogue Quality Metrics
– mean recognition score, timeouts, rejections,
helps, cancels, bargeins (raw)
– timeout%, rejection%, help%, cancel%, bargein% (normalized)
Task Success Metrics
– task completion as per survey
User Satisfaction
– the sum of TTS Performance, ASR Performance,
Task Ease, Interaction Pace, User Expertise, Sys-tem Response, Expected Behavior, Comparable Interface, Future Use.
Figure 4: Metrics collected for spoken dialogues.
The dialogue efficiency metrics were calculated from the dialogue recordings and the system logs. The length of the recording was used to calculate the elapsed time in sec-onds (ET) from the beginning to the end of the interaction. Measures for the number of System Turns, and the number of User Turns, were calculated on the basis of the system logging everything it said and everything it heard the user say.
system behaviors that affect the quality of the resulting dia-logue were automatically logged. These included the num-ber of timeout prompts (timeouts) played when the user didn’t respond as quickly as expected, the number of rec-ognizer rejections (rejects) where the system’s confidence in its understanding was low and it said something like I’m sorry I didn’t understand you. User behaviors that the sys-tem perceived that might affect the dialogue quality were also logged: these included the number of times the system played one of its context specific help messages because it believed that the user had said Help (helps), and the number of times the system reset the context and returned to an ear-lier state because it believed that the user had said Cancel (cancels). The recordings were used to check whether users barged in on system utterances, and these were labeled on a per-state basis (bargeins).
Another measure of dialogue quality was recognizer performance over the whole dialogue, calculated in terms of concept accuracy. The recording of the user’s utterance was compared with the logged recognition result to cal-culate a concept accuracy measure for each utterance by hand. Concept accuracy is a measure of semantic standing by the system, rather than word for word under-standing. For example, the utterance Read my messages from Kim contains two concepts, the read function, and the sender:kim selection criterion. If the system understood only that the user said Read, then concept accuracy would be .5. Mean concept accuracy was then calculated over the whole dialogue and used, in conjunction with ASR rejec-tions, to compute a Mean Recognition Score MRS for the dialogue.
Because the goal is to generate models that will gener-alize across systems and tasks, we also thought it important to introduce metrics that are likely to generalize. All of the efficiency metrics seemed unlikely to generalize since, e.g. the elapsed time to complete of a task depends on how difficult the task is. Other research suggested that the dia-logue quality metrics were more likely to generalize (Lit-man et al., 1999; Walker et al., 1999), but it seemed likely that the raw counts would be task specific. Thus we nor-malized the dialogue quality metrics by dividing the raw counts by the total number of utterances in the dialogue. This resulted in the timeout%, rejection%, help%,
can-cel%, and bargein% metrics.
The web page forms are the basis for calculating Task Success and User Satisfaction measures. Users reported their perceptions as to whether they had completed the task (Comp).2
They also had to provide objective evidence that they had in fact completed the task by filling in a form with the information that they had acquired from the system.3
In order to calculate User Satisfaction (USAT), users were asked to evaluate the system’s performance with a user satisfaction survey. The survey probed a number of
2
Yes,No responses are converted to 1,0.
3
This supports an alternative way of calculating Task Success objectively by using the Kappa statistic to compare the informa-tion that the users filled in with a key for the task (Walker et al., 1997). However earlier results indicated that user’s perception of task success was a better predictor of overall satisfaction, so here we simply use perceived task success as measured by Comp.
Was the system easy to understand in this conversa-tion? (TTS Performance)
In this conversation, did the system understand what you said? (ASR Performance)
In this conversation, was it easy to find the message you wanted? (Task Ease)
Was the pace of interaction with the system appropri-ate in this conversation? (Interaction Pace)
In this conversation, did you know what you could say at each point of the dialogue? (User Expertise)
How often was the system sluggish and slow to reply to you in this conversation? (System Response)
Did the system work the way you expected him to in this conversation? (Expected Behavior)
In this conversation, how did the system’s voice inter-face compare to the touch-tone interinter-face to voice mail? (Comparable Interface)
From your current experience with using the system to get your email, do you think you’d use the system regularly to access your mail when you are away from your desk? (Future Use)
Figure 5: User satisfaction survey for ELVIS and ANNIE experiments.
different aspects of the users’ perceptions of their interac-tion with the SDS in order to focus the user on the task of rating the system, as in (Shriberg et al., 1992; Jack et al., 1992; Love et al., 1994). A sample survey is in Figure 5. The surveys were multiple choice and each survey response was mapped into the range of 1 to 5. Then the values for all the responses were summed, resulting in a User
Satisfac-tion measure for each dialogue ranging from 8 to 40.
4.
Results of Applying PARADISE
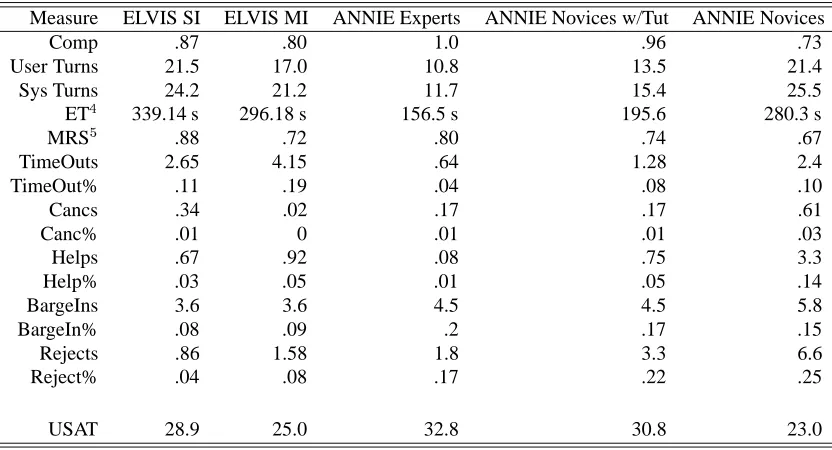
Table 1 summarizes the experimental corpus of 376 di-alogues in terms of experimental conditions and the metrics that were collected. This section reports results for
training models to predict user satisfaction via multi-variate linear regression;
testing these models across different systems, differ-ent experimdiffer-ental conditions, and differdiffer-ent user popu-lations to determine to what extent they generalize.
training models to predict user satisfaction via tree re-gression;
Measure ELVIS SI ELVIS MI ANNIE Experts ANNIE Novices w/Tut ANNIE Novices
Comp .87 .80 1.0 .96 .73
User Turns 21.5 17.0 10.8 13.5 21.4
Sys Turns 24.2 21.2 11.7 15.4 25.5
ET4
339.14 s 296.18 s 156.5 s 195.6 280.3 s
MRS5
.88 .72 .80 .74 .67
TimeOuts 2.65 4.15 .64 1.28 2.4
TimeOut% .11 .19 .04 .08 .10
Cancs .34 .02 .17 .17 .61
Canc% .01 0 .01 .01 .03
Helps .67 .92 .08 .75 3.3
Help% .03 .05 .01 .05 .14
BargeIns 3.6 3.6 4.5 4.5 5.8
BargeIn% .08 .09 .2 .17 .15
Rejects .86 1.58 1.8 3.3 6.6
Reject% .04 .08 .17 .22 .25
USAT 28.9 25.0 32.8 30.8 23.0
Table 1: Performance measure means per dialogue for different SDSs.
variable was user satisfaction, and the independent vari-ables were the metrics discussed above and shown in Ta-ble 1. An alternative to the more traditional regression anal-yses, tree modeling uses the predictor variables to split the dataset into its most informative subsets. The goodness-of-fit measure is the proportion reduction in error (PRE) achieved by using the subsets (rather than the overall mean) to predict the dependent variable. When the dependent vari-able is continuous, as it is here, the goodness of fit measure from the regression tree model is directly comparable to the multiple R2
in linear regression. We also constructed re-gression tree and linear models for subsets of the data corre-sponding to the two different systems, Annie and Elvis. As shown in Table 2, the explanatory power of the tree mod-els was quite similar to that obtained via linear modmod-els, and similar sets of predictor variables were observed. However, there is reason to be cautious with respect to the linear mod-els. In each of the three analyses, 5-10were ”high-leverage” points, which exert excessive influence on the path of the fitted model.
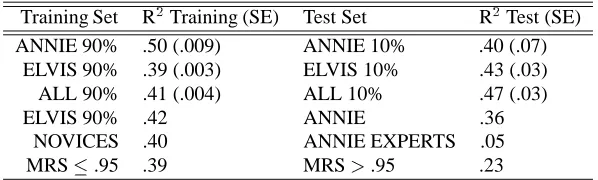
Our next step was to explore the generalizability of the linear models by training a model on 90% of the data, then testing the model on the remaining 10%. Our primary mo-tivation is an interest in using regression models to predict user satisfaction, both within and across systems and tasks. A secondary reason to explore the generalizability of the linear models, in particular, is the concern raised by the high-leverage values.
An overall summary of the results for testing and train-ing predictive models is in Table 3. Each model discussed was trained by performing a stepwise multivariate linear regression on some set of dialogues with user satisfaction as the dependent variable and the other metrics discussed above and shown in Table 1 as the independent variables. For each model we describe the training set, indicate the performance of the trained model on the training set in
terms of the amount of variance in user satisfaction in the training set accounted for by the trained model. When 10 fold cross-validation is used to estimate R2
,the value re-ported is a mean and the standard error (SE) is shown. The table also describe the test set, and indicate the performance of the trained model on the test set in terms of the amount of variance in user satisfaction in the test set accounted for by the trained model. Table 3 lists the factors that were significant predictors of user satisfaction for each of these models.
We first trained models for each system on a random 90% of the dialogues for that system. Results for each sys-tem are given in the first two rows of Table 3, showing the degree to which the model is able to predict user satisfac-tion in the training set (Column labeled R2
Training).6 We then tested whether a model trained on a random 90% of the corpus for a particular system could predict user satis-faction in the remaining 10% of the dialogues for that sys-tem. The results in the first two rows of Table 3 suggest that both the ELVIS and ANNIE models generalize quite well.
We then examined models trained on the combined data from both systems. The ALL row in Table 3 gives the re-sults for training on a random 90% of the dialogues from the combined corpus and testing on the remaining 10% of the dialogues. As the table shows, the model is a good pre-dictor of user satisfaction in the test set, accounting for 47% of the variance in R2
.
Next we examined whether models trained on a random 90% of one of the systems (ELVIS) could predict user sat-isfaction for users of ANNIE. The results for this test are shown in row 4 of Table 3. The ELVIS model accounts f,
6
For the first 3 rows of the table, 10-fold cross-validation is used to estimate R2
. Thus, the training and testing R2
values rep-resent means, and standard errors (SE) are shown. For the rest of the table, the R2
Dataset PRE Regression Tree (predictors) R2
Linear Regression (predictors) ENTIRE .33 (comp, mrs) .42 (comp, mrs, reject%, help%)
ANNIE .56 (helps, mrs, comp, reject%) .56 (help%, mrs, comp, rejects, barge-in%) ELVIS .37 (mrs, comp) .41 (mrs, comp, barge-ins)
Table 2: Comparing the explanatory power of regression trees and linear models.
Training Set R2
Training (SE) Test Set R2
Test (SE) ANNIE 90% .50 (.009) ANNIE 10% .40 (.07)
ELVIS 90% .39 (.003) ELVIS 10% .43 (.03)
ALL 90% .41 (.004) ALL 10% .47 (.03)
ELVIS 90% .42 ANNIE .36
NOVICES .40 ANNIE EXPERTS .05
MRS.95 .39 MRS>.95 .23
Table 3: Testing the predictive power of different models.
which is comparable to the generalization capability of a model actually trained on the ANNIE data itself.
We then turn to the question of whether models trained on one user population generalize to a different type of user population. We examined this in two ways.
First, we had a group of expert users who participated in the ANNIE experiments. These users had been using the ANNIE system for over 6 months on a regular basis. All of the other users who participated in the experiments were novice users who were not familiar with the limita-tions of spoken dialogue systems. Out of the 376 dialogues, 36 were dialogues with expert users and the remaining 340 dialogues were collected with novice users. We trained a model with the dialogues from the novice users and tested it against the dialogues with the experts. The results are shown in Table 3 in the NOVICES row. The results show that models trained on novice users do not easily gener-alize to an expert user population. The correlation of the predicted values to the actual values is only .19; the novice model only accounts for 4% of the variance in user satis-faction in the expert population.
Second, speech recognition performance varies a great deal from user to user, and thus it is important to assess whether the models trained on ANNIE and ELVIS would generalize to systems whose speech recognition perfor-mance overall was much better. In order to examine this question, we selected the 65 out of 376 of the dialogues that had a Mean Recognition Score (MRS) better than .95 (GoodASR dialogues). We used the 311 dialogues where MRS was less than or equal to .95 to train a model for pre-dicting user satisfaction and then tested it on the GoodASR dialogues. The results shown in the MRS .95 row of Table 3 show that the model only accounts for 23% of the variance in R2
in the test data. This is actually higher than one might expect given the large contribution of MRS to user satisfaction in all the models.
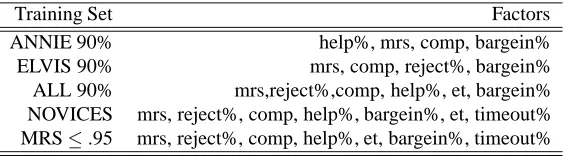
Table 4 also shows which factors were found to be sig-nificant predictors of user satisfaction in each of the trained
models (Factors column), ordered by degree of contribu-tion. Except for the ANNIE system model, recognizer per-formance (MRS) and task success (COMP) are always the largest contributors to user satisfaction, followed by the percentage of the dialogue turns that were rejections (RE-JECT%), where the system asked the user to repeat or para-phrase what they had just said. The models for the ANNIE experiments reflect the fact that the population of users was deliberately varied in these experiments. ANNIE experts had been using ANNIE for a period of about 6 months and many of them had considerable experience with other spo-ken dialogue systems. The ANNIE model reported in row 1 shows that the percentage of requests for help was a sig-nificant predictor of user satisfaction, reflecting the fact that some users needed help significantly more than others, and these same users typically had much lower satisfaction with the system.
5.
Discussion and Future Work
When we introduced the PARADISE framework for evaluating spoken language dialogue systems (SDSs) we hoped to apply an empirical approach to developing general models of system usability. We proposed that user satisfac-tion could be used as a measure of system usability, and that it would be possible to develop models for predicting usability by learning which of a range of other metrics were good predictors of user satisfaction.
Training Set Factors
ANNIE 90% help%, mrs, comp, bargein%
ELVIS 90% mrs, comp, reject%, bargein%
ALL 90% mrs,reject%,comp, help%, et, bargein% NOVICES mrs, reject%, comp, help%, bargein%, et, timeout% MRS.95 mrs, reject%, comp, help%, et, bargein%, timeout%
Table 4: Factors that have significant predictive power in different models ordered by magnitude of contribution.
models on the unseen 10% of the dialogues was roughly comparable to performance on the training set.
We then showed that a general model, trained on 90% of the dialogues combined from both systems accounted for 41% (0.4%) of the variance in user satisfaction, and that this model accounted for 47% (3%) of the variance in user satisfaction in the unseen 10% of the dialogues. In other words, the performance of the general model trained on 90% of the data is performing just as well on the test set as on the training set.
We also tested the extent to which a model trained on one system (ELVIS) can predict user satisfaction for AN-NIE. These tests showed that the ELVIS model could ac-count for 36% of the variance in user satisfaction in AN-NIE. The ELVIS model’s predictive power on the ANNIE data is no worse than a model trained on 90% of the ANNIE dialogues. This suggests that there are general factors that predict user satisfaction that are shared by the models; this finding is also supported by the fact that the models share many predictive factors as shown in Table 4.
However, the models generalized less easily across user populations. When we tested models trained on dialogues with novices against dialogues with experts, the novice models did not predict user satisfaction in the expert pop-ulation. This shows that it is important in future work to carry out longitudinal studies of users as they gain ex-perience with the system, and that general models must be trained on a sample of dialogues including both expert and novice users. Similarly, the models trained on dia-logues with users who experienced average recognizer per-formance did not do a very good job predicting user sat-isfaction in dialogues with users who experienced excel-lent recognizer performance, although the correlations were higher than one might have expected.
At a higher level of generalization, we compared the explanatory power of regression trees and linear models. Although we initially thought that tree modeling might im-prove predictive performance (Brieman et al., 1984), we found that the two types of models yielded quite similar re-sults, both in terms of overall explanatory power and in the predictor variables that emerged. Nonetheless, we suspect that tree models can provide explanatory models in cases where linear regression is inappropriate. For example, in future work, we plan to explore the predictive power of tree models for estimating categorical dependent variables, as well as dependent variables like ”completeness,” which can be coded continuously, but have a strongly skewed distri-bution.
The results reported contribute to the goal of develop-ing general models of system usability, however there are several ways in which this work should be extended. First, it would be useful to repeat this analysis with a large cor-pus of cross-system dialogues collected via participation in theDARPA COMMUNICATOR evaluations (Walker et al., 2000a). Second, it is important to extend these techniques to dialogues collected in field studies, as opposed to the controlled experimental environment described here, per-haps by first examining the differences between dialogues collected with predefined scenarios for a particular user to dialogues collected with open tasks, i.e. when the user de-fines the task, as in (Baggia et al., 1998). We plan to utilize the DARPA COMMUNICATOR evaluation data to examine these differences (Walker et al., 2000a). Finally, it is im-portant to determine whether it is possible to achieve better model fits than those reported here. The model fits range from the ELVIS model that accounts for 39% of the vari-ance in user satisfaction to the ANNIE model that accounts for 50% of the variance in user satisfaction.
There are at least two other possible avenues for im-proving the models of user satisfaction in addition to the tree models tested here. One possibility is that larger dia-logue corpora might help, although when we examined the model fits as a function of training set size the curve ap-peared to start levelling out at 250 dialogues (Walker et al., 2000b). However it is possible that this data set is some-what homogeneous since it was all collected with the same platform. Second, it may be possible to develop a num-ber of additional metrics for predicting user satisfaction that would generalize across systems (Walker et al., 2000a). The results presented here suggest that users are highly at-tuned to the quality of the interaction rather than efficiency, but it is a challenge to develop metrics that assess the qual-ity of the interaction that can be reliably hand-labelled or automatically measured. In future work, we hope to con-tribute to the development of metrics that assess the quality of the system’s strategies for presenting information and for providing context-sensitive help.
6.
References
Baggia, Paolo, Giuseppe Castagneri, and Morena Danieli, 1998. Field trials of the italian arise train timetable sys-tem. In Interactive Voice Technology for Telecommuni-cations AppliTelecommuni-cations, IVTTA.
human-machine dialogue. In International Conference on Spoken Language Processing, ICSLP 96.
Brieman, Leo, Jerome H. Friedman, Richard A. Olshen, and Charles J. Stone, 1984. Classification and Regres-sion Trees. Wadsworth and Brooks, Monterey Califor-nia.
Danieli, M. and E. Gerbino, 1995. Metrics for evaluating dialogue strategies in a spoken language system. In Pro-ceedings of the 1995 AAAI Spring Symposium on Empiri-cal Methods in Discourse Interpretation and Generation. Hirschman, L., M. Bates, D. Dahl, W. Fisher, J. Garofolo,
D. Pallett, K. Hunicke-Smith, P. Price, A. Rudnicky, and E. Tzoukermann, 1993. Multi-site data collection and evaluation in spoken language understanding. In Pro-ceedings of the Human Language Technology Workshop. Hirschman, L. and C. Pao, 1993. The cost of errors in a spoken language system. In Proceedings of the Third European Conference on Speech Communication and Technology.
Hirschman, Lynette, Deborah A. Dahl, Donald P. McKay, Lewis M. Norton, and Marcia C. Linebarger, 1990. Be-yond class A: A proposal for automatic evaluation of dis-course. In Proceedings of the Speech and Natural Lan-guage Workshop.
Jack, M.A., J. C. Foster, and F. W. Stentiford, 1992. In-telligent dialogues in automated telephone services. In International Conference on Spoken Language Process-ing, ICSLP.
Kamm, Candace, Diane Litman, and Marilyn A. Walker, 1998. From novice to expert: The effect of tutorials on user expertise with spoken dialogue systems. In Pro-ceedings of the International Conference on Spoken Lan-guage Processing, ICSLP98.
Larsen, Lars Bo, 1999. Combining objective and subjective data in evaluation of spoken dialogues. In ESCA Work-shop on Interactive Dialogue in Multi-Modal Systems. Litman, Diane J., Shimei Pan, and Marilyn A. Walker,
1998. Evaluating Response Strategies in a Web-Based Spoken Dialogue Agent. In Proceedings of ACL/COLING 98: 36th Annual Meeting of the Associ-ation of ComputAssoci-ational Linguistics.
Litman, Diane J., Marilyn A. Walker, and Michael J. Kearns, 1999. Automatic detection of poor speech recognition at the dialogue level. In Proceedings of the 37th Annual Meeting of the Association of Computa-tional Linguistics , ACL99.
Love, Stephen, R. T Dutton, J. C. Foster, M. A. Jack, and F. W. M. Stentiford, 1994. Identifying salient usability attributes for automated telephone services. In Interna-tional Conference on Spoken Language Processing, IC-SLP.
Pallett, David S., 1985. Performance assessment of auto-matic speech recognizers. J. Res. Natl. Bureau of Stan-dards, 90:371–387.
Polifroni, J., S. Seneff, J. Glass, and T. Hazen, 1998. Evalu-ation methodology for a telephone-based conversEvalu-ational system. In Proc. First International Conference on Lan-guage Resources and Evaluation, Granada, Spain.
Ralston, J. V., D. B. Pisoni, , and John W. Mullennix, 1995. Perception and comprehension of speech. In Syrdal, Bennet, and Greenspan (eds.), Applied Speech Technol-ogy. CRC Press, pages 233–287.
Rudnicky, A. I., 1993. Factors affecting choice of speech over keyboard and mouse in a simple data-retrieval task. In EUROSPEECH93.
Sanderman, Angielen, Janienke Sturm, Els den Os, Lou Boves, and Anita Cremers, 1998. Evaluation of the dutchtrain timetable information system developed in the arise project. In Interactive Voice Technology for Telecommunications Applications, IVTTA.
Shriberg, Elizabeth, Elizabeth Wade, and Patti Price, 1992. Human-machine problem solving using spoken language systems (SLS): Factors affecting performance and user satisfaction. In Proceedings of the DARPA Speech and NL Workshop.
Sparck-Jones, Karen and Julia R. Galliers, 1996. Evaluat-ing Natural Language ProcessEvaluat-ing Systems. SprEvaluat-inger. Walker, M., , J. Fromer, G. Di Fabbrizio, C. Mestel, and
D. Hindle, 1998a. What can I say: Evaluating a spoken language interface to email. In Proceedings of the Con-ference on Computer Human Interaction (CHI 98). Walker, M. A., D. Litman, C. A. Kamm, and A. Abella,
1997. PARADISE: A general framework for evaluating spoken dialogue agents. In Proceedings of the 35th An-nual Meeting of the Association of Computational Lin-guistics, ACL/EACL 97.
Walker, Marilyn, Julie Boland, and Candace Kamm, 1999. The utility of elapsed time as a usability metric for spoken dialogue systems. In Proc. IEEE Workshop on Automatic Speech Recognition and Understanding, AS-RUU99.
Walker, Marilyn A., 2000. An application of reinforcement learning to dialogue strategy selection in a spoken dia-logue system for email. Journal of Artificial Intelligence Research.
Walker, Marilyn A., Jeanne C. Fromer, and Shrikanth Narayanan, 1998b. Learning optimal dialogue strate-gies: A case study of a spoken dialogue agent for email. In Proceedings of the 36th Annual Meeting of the Asso-ciation of Computational Linguistics, COLING/ACL 98. Walker, Marilyn A., Lynette Hirschman, and John
Ab-erdeen, 2000a. Evaluation for DARPA communicator spoken dialogue systems. In Proc. Second International Conference on Language Resources and Evaluation, Athens, Greece.