Feature Extraction for Native Language Identification
Using Language Modeling
Vincent Kr´ıˇz, Martin Holub, Pavel Pecina Charles University in Prague
Faculty of Mathematics and Physics Institute of Formal and Applied Linguistics
{kriz, holub, pecina}@ufal.mff.cuni.cz
Abstract
This paper reports on the task of Native Language Identification (NLI). We devel-oped a machine learning system to identify the native language of authors of English texts written by non-native English speak-ers. Our system is based on the language modeling approach and employs cross-entropy scores as features for supervised learning, which leads to a significantly re-duced feature space. Our method uses the SVM learner and achieves the accuracy of 82.4 % with only 55 features. We com-pare our results with the previous similar work by Tetreault et al. (2012) and ana-lyze more details about the use of language modeling for NLI. We experiment with the TOEFL11 corpus (Blanchard et al., 2013) and provide an exact comparison with re-sults achieved in theFirst Shared Task in NLI(Tetreault et al., 2013).
1 Introduction
We present a system for identifying the native lan-guage (L1) of a writer based solely on a sample of their writing in a second language (L2). In this work we focus on English as the second language. According to the weak Contrastive Analysis Hypothesis (Lado, 1957), speakers and writers of the same L1 can sometimes be identified by sim-ilar L2 errors. These errors may be a result of linguistic interference. Common tendencies of a speaker’s L1 are superimposed onto their L2. Na-tive Language Identification (NLI) is an attempt to exploit these errors in order to identify the L1 of the speaker from texts written in L2. In the present study we approach NLI exclusively as a classifi-cation task where the set of the L1 languages is known a priori.
1.1 Motivation and Possible Applications
The NLI task is a quickly growing subfield in NLP. The task is motivated by two types of questions:
1. questions about the native language influence in non-native speakers’ speech or writing, and
2. questions about the accuracy of the NLI clas-sification that is achievable, which also in-cludes the technical details of the classifica-tion systems.
Native Language Identification can be used in educational settings. It can provide useful feed-back to language learners about their errors. Smith and Swan (2001) showed that speakers of differ-ent languages make differdiffer-ent kinds of errors when learning a foreign language. A system which can detect the L1 of the learner will be able to provide more targetted feedback about the error and con-trast it with common properties of the learner’s L1. The knowledge of the native language can be used as a feature for authorship analysis (Sta-matatos, 2009). The plethora of available elec-tronic texts (e.g., e-mail messages, online forum messages, blogs, source code, etc.) presents the potential of authorship analysis in various appli-cations including criminal law (e.g., identifying writers of harassing messages, verifying the au-thenticity of suicide notes), civil law (e.g., copy-right disputes), and forensic linguistics. In the end, it includes the traditional applications to literary research (e.g., attributing anonymous or disputed literary works to known authors). Bergsma et al. (2012) consider the NLI task as a sub-task of the authorship analysis task.
Relatively similar to NLI is the task of Lan-guage Variety Identification. It has been recently addressed by the research community (Zampieri and Gebre, 2012; Sadat et al., 2014; Maier and G´omez-Rodr´ıguez, 2014).
2 Related Work
2.1 Known Approaches to the Task
Most researchers use a system involving the Sup-port Vector Machines (SVM) trained on n-gram based features. The most common features in-clude character n-grams, function words, parts of speech, spelling errors, and features of writing quality, such as grammatical errors, style markers, and so forth.
In contrast, Swanson and Charniak (2012) in-troduced the Tree Substitution (TSG) structures, learned by Bayesian inference. Bykh et al. (2013) used recurring n-grams, inspired by the variation n-gram approach to corpus error annotation detec-tion (Dickinson and Meurers, 2003). Ionescu et al. (2014) propose a combination of several string kernels and use multiple kernel learning. Malmasi and Cahill (2015) provide a systematic study of feature interaction and propose a function to mea-sure feature independence effectiveness.
The most important related work is the recent paper by Tetreault et al. (2012), which was, to our best knowledge, the first extensive study involving the use of language modeling and entropy-based features for the sake of NLI. The comparison with our work is summarized in Sections 5.4 and 6.
2.2 Results Achieved on the ICLE Corpus
Studies before 2012 experimented with the texts included in the International Corpus of Learner English (ICLE) (Granger et al., 2002). Since the ICLE corpus was not designed with the task of NLI in mind, the usability of the corpus for this task is further compromised by idiosyncrasies in the data such as topic bias.
The highest NLI accuracy was 90.1%, which was reported by Tetreault et al. (2012). The au-thors used a system involving SVM with the L1-regularized logistic regression solver and default parameters. The system reported in the study by Tetreault et al. (2012) classified between seven L1s. The reported accuracy is higher than any of the previous NLI studies that examined the same number (Bykh et al., 2013) or even a smaller num-ber of L1s in the ICLE.
The ensemble method used by Tetreault et al. (2012) involved the creation of separate classifier models for each category of features; the L1 affil-iations of individual texts were later predicted by the combined probabilities produced by the differ-ent classifier models. The authors pointed out that
combining all features into a single classifier gave them an NLI accuracy of only 82.6%, which falls far short of the 90.1 % they achieved through the ensemble method.
The study by Jarvis and Paquot (2012) presents a system that examines 12 L1s in the ICLE. Their system uses a combination of features that in-cludes only lexical n-grams (1-grams, 2-grams, 3-grams, and 4-grams). The system provides the highest classification accuracy of only 53.6 %.
2.3 The First NLI Shared Task (2013)
The First Native Language Identification Shared Task (Tetreault et al., 2013), henceforth the Shared Task, was intended to unify the community and help the field progress. Tetreault et al. (2013) report the methods most participants used, the data they evaluated their systems on, the results achieved by the different teams, and some sugges-tions and ideas about what we can do for the next iteration of the NLI shared task.
The Shared Task used the new corpus TOEFL11 (Blanchard et al., 2013) designed specifically for the NLI task and provided a common set of L1s as well as evaluation standards for this competition. This allows a direct comparison of approaches. The corpus was published by the Linguistic Data Consortium1in 2014.
The Shared Task consisted of three sub-tasks. We consider our system to be a part of theClosed
sub-task, which is the 11-way classification task using only the TOEFL11 data for training. Al-though we use English texts from the Wikipedia to build the language model of general English, this common data are not connected with the task.
In total, 29 teams competed in the Shared Task competition. The majority of teams used Support Vector Machines. The teams used ensemble meth-ods for combining their classifiers. There were a few other teams that tried different methods, such as Maximum Entropy, Discriminant Function Analysis, and K-Nearest Neighbors. The most successful approaches are reported and compared with our system in Table 5.
In this work we experiment with exactly the same data, using the same cross-validation splits as the participants of the Shared Task, so we can provide the exact comparison with the published results.
1https://catalog.ldc.upenn.edu/
3 Development Data
3.1 Basic Characteristics of the TOEFL11
The TOEFL11 corpus (Blanchard et al., 2013) contains 12,100 essays uniformly balanced be-tween 11 target L1 languages. In addition, it is sampled as evenly as possible from 8 topics (prompts) along with 3 proficiency levels (low, medium, high) for each essay. The proficiency level has been determined by assessment experts using a consistent rating procedure for the entire corpus. The 11 target L1 languages covered by the corpus are: Arabic (ARA), Chinese (CHI), French (FRE), German (GER), Hindi (HIN), Ital-ian (ITA), Japanese (JAP), Korean (KOR), Spanish (SPA), Telugu (TEL), and Turkish (TUR).
The number of essays per target L1 language is perfectly balanced. It is also almost perfectly balanced in relation to the prompts written about. All eight prompts are reflected in all target L1 languages. For 4 target languages (ARA, CHI, JAP, KOR), all prompts are almost equally repre-sented with a proportion of approximately 12.5% per prompt. In other L1s, there is more variability. The distribution of the proficiency levels is even more variable. In conclusion, the TOEFL11 is not a perfectly balanced corpus, but it is much larger than the ICLE and involves fewer prompts, which are more evenly distributed across the L1 groups.
3.2 Experiment Settings
For the purposes of the Shared Task, the cor-pus was split into three sets: training (TOEFL 11-TRAIN), development (TOEFL11-DEV), and test (TOEFL11-TEST). The training corpus consisted of 900 essays per L1, the development set sisted of 100 essays per L1, and the test set con-sisted of another 100 essays per L1. The Shared Task organizers asked the participants to perform 10-fold cross-validation on a data set consisting of the union ofTOEFL11-TRAINandTOEFL11-DEV. For a direct comparison with the Shared Task par-ticipants, we experiment with the same folds as in the competition.
4 Feature Engineering
We define a small set of cross-entropy based fea-tures computed over different language models, which leads to significant reduction of the usual feature space based on n-grams. The features are then used by a SVM classifier.
4.1 Use of Language Modeling
Our system is inspired by Moore and Lewis (2010). They show how to select a good sub-set of the available data as a training portion for a language model that improves the match be-tween the language model from that data source and the desired application output. In their work they score text segments by the difference of the cross-entropy of a text segment according to the in-domain language model compared to the cross-entropy of the text segment according to a lan-guage model trained on a random sample of the data source from which the text segment is drawn. The introduced cross-entropy difference selection method produces language models that are both a better match to texts in a restricted domain and re-quire less data for training than any of the other data selection methods tested.
Moreover, Axelrod et al. (2011) reported an im-provement of their end-to-end machine translation system using domain adaptation based on extract-ing sentences from a large general-domain parallel corpus that are most relevant to the target domain selected with simple cross-entropy based methods.
4.2 Cross-entropy Scoring
We apply the idea of scoring texts by the differ-ence in cross-entropy and developed the system for classifying target L1 languages. We built 11 special language models of English, each based on the texts with the same L1 language available in the training data. To compare these special language models with general English, we have built a general language model of English, using Wikipedia. Then we use cross-entropy to measure the similarity between a given test instance and target L1 languages. These cross-entropy scores then serve as features for the SVM classifier.
Formally, the cross-entropy of texttwith empir-ical n-gram distributionpgiven a language model
M with distributionqis H(t, M) =−X
x p(x) logq(x).
For each L1 to be classified (L1, . . . ,L11) we
built a language modelMi. We also built a model
of general EnglishMG. Then we define the
nor-malized cross-entropy score:
DG(t, Mi) =H(t, Mi)−H(t, MG).
elements of the feature vector describing text t. The usage of the language model of general En-glish is motivated by the idea that we are interested only in text features which distinguish author’s L2 language (i.e. his or her specific English) from other authors with different L1 languages. Cor-rect language constructions typically occurring in general English are removed from the comparison.
4.3 Computing the L1 Language Models
To build the L1 language modelsMiwith as many
training data as possible, we used the leave-one-outmethod.
Let ti be the i-th training instance and gs(ti)
is the true L1 of text ti. To calculate the
cross-entropy for the instance ti, using the language
model for language Lj 6= gs(ti), we built the
modelMj using all available training instancestk
such thatgs(tk) =Lj.
To calculate the cross-entropy for the instance
ti, using the language model for languageLj =
gs(ti), we builtMj using all available training
in-stances tk except the instance ti itself: tk,Lj =
gs(ti), k6=i.
Because of this approach, the cross-entropy scores proposed in Section 4.2, are only approx-imate. Each cross-entropy was computed with re-spect to a slightly different vocabulary, resulting in a different out-of-vocabulary (OOV) rate. OOV tokens in the scoring text were excluded from the computation, so the measurements are not strictly comparable.
We believe that this drawback is reasonable: (1) it allows us to compute scores for all training in-stances, and (2) we do not have to split the training data into two parts – one for building the language model and the other for the cross-entropy calcula-tion.
4.4 Language Model of General English
We built a language model of general English
MG using Wikipedia. The official Wikipedia
dumps contain a lot of technical pages and it is not straightforward to extract meaningful sen-tences and portions useful for language model-ing. In order to avoid the duplication of the laborious efforts, we gratefully used the project TC Wikipedia2 provided by Artiles and Sekine
(2009).
2http://nlp.cs.nyu.edu/wikipedia-data/
4.5 Cross-entropy Based Features
We adopted and experimented with all success-ful feature families used in the previous works re-ported in Section 2.
For each feature family, we defined 11 cross-entropy scores derived from the 11 language mod-els coresponding to the 11 target L1 languages.
• Tokens (T). Token based language model. • Characters (C). Character based language
model.
• Suffixes (Sn). Language models built on
to-ken suffixes of the lengthn∈ {2, ...,6}. • POS tags (P). Language model built on POS
tags. We tagged the TOEFL11 corpus as well as the whole Wikipedia by the Stanford tag-ger (Toutanova et al., 2003).
For each feature family we built and compared the performance of two language models: one from the original text, and the other using the same, but lower-cased text. Moreover, we exper-imented with and compared different smoothing methods, as described in details in Section 5.2.
4.6 Other features
To complete the list of feature families, we added 9 statistical(ST)and two categorical(PR)features:
Text length characteristics include the num-ber of sentences, numnum-ber of tokens and numnum-ber of characters for the given instance. It also includes the average sentence length (# of tokens / # of sen-tences) and average token length (# of characters / # of tokens).
Lexical variety familyincludes the number of unique tokens (in the original as well as the lower-cased text) and the so called lexical variety. It is defined as the ratio between a unique number of tokens and the overall number of tokens in the classified instance. We provide two features for both the original and the lower-cased text.
Prompt and proficiency(PR) are two categori-cal features available for each TOEFL11 instance, which encode the topic of the essay and the profi-ciency level of the writer, respectively.
5 Results and Discussion
Maximum n-gram order
Smoothing method 3 4 5 6 7 8
Witten and Bell (1991) 61.3 61.8 61.8 61.9 62.0 62.0 Witten and Bell (1991)* 65.8 66.4 66.4 66.3 66.3 66.2 Ristad (1995) 69.6 69.7 69.6 69.7 69.6 69.8 Chen and Goodman (1996) 56.8 58.5 58.8 68.8 59.0 59.0 Kneser and Ney (1995) 59.0 60.6 61.0 61.2 61.2 61.3 Kneser and Ney (1995)* 77.5 77.8 77.8 77.9 77.9 77.9
Table 1: The influence of different smoothing methods and n-gram ranges (from [1,3] to [1,8]) on the system accuracy. Each system uses 11 cross-entropy based features over token based language models.
Maximum n-gram order
ID Feature family 3 4 5 6 7 8
C Characters 61.4 70.5 73.0 74.1 74.6 74.9 S2 Suffixes (2) 68.8 68.4 68.3 68.3 68.3 68.2
S3 Suffixes (3) 73.6 73.2 73.2 73.2 73.1 73.0
S4 Suffixes (4) 75.5 75.3 75.4 75.5 75.4 75.4
S5 Suffixes (5) 77.1 76.9 77.2 77.1 77.1 77.1
S6 Suffixes (6) 77.7 77.8 77.8 77.8 77.7 77.8
T Tokens 78.0 78.0 77.9 78.0 77.9 78.0 P POS tags 53.1 53.2 52.0 50.4 49.1 48.2
Table 2: Accuracy of the system using background language models built on different feature families and n-gram ranges (from [1,3] to [1,8]). Each system uses 11 cross-entropy based features over specified language model.
a number of models and compare: (1) different smoothing methods; (2) performance of different feature families; (3) different n-gram range used by language model; (4) different combinations of feature families.
5.1 SVM Settings
Our most successful system uses a linear SVM multiclass classifier. In our experiments, we did not observe any gain from using either polynomial or RBF kernels. This observation is exactly in line with previous research (see Section 2). The pa-rameterCostwas optimized through cross valida-tion.
In this work, the SVM implementation of the R packagee10713 is applied, which is based on the
LIBSVM library (Chang and Lin, 2011). To pro-vide a multiclass classifier, we experimented with two common strategies: (i) one-vs-one and (ii)
one-vs-all. The first strategy yields consistently better results.
3http://cran.r-project.org/web/
packages/e1071/
5.2 Best Smoothing Method
We used the SRILM software4(Stolcke, 2002) to
build langauge models (LM) as well as to calcu-late cross-entropy based features. This software offers several smoothing algorithms. Experiments showed that selecting an appropriate smoothing method is essential for model quality. Table 1 presents averaged accuracies from the cross val-idation over TOEFL11-TRAIN. The token-based LMs are built with different smoothing strategies. Witten-Bell (Witten and Bell, 1991) and Kneser-Ney smoothing (Kneser and Ney, 1995) currently support interpolation. This option causes the discounted n-gram probability esti-mates at the specified order n to be interpo-lated with lower-order estimates. This sometimes yields better models with some smoothing meth-ods. In Table 1, interpolated smoothing methods are marked with *.
According to the results from Table 1, we se-lected the Kneser and Ney (1995) discounting with interpolation as the most successful smoothing
al-4http://www.speech.sri.com/projects/
ID Feature family Original Lower-case
C Characters 44.4 61.4
S2 Suffixes (2) 55.9 68.8
S3 Suffixes (3) 67.4 73.6
S4 Suffixes (4) 70.3 75.5
S5 Suffixes (5) 71.7 77.1
S6 Suffixes (6) 73.2 77.7
T Tokens 74.6 78.0
Table 3: Accuracy of the system using background language models built on original texts compared with language models built on lower-cased texts.
gorithm and we used it in all next experiments.
5.3 Individual Feature Families
The results presented in this section are aver-aged accuracies over the 10-fold cross-validation on the combinedTOEFL11-TRAINandTOEFL 11-DEV sets. The cross-validation folds were ex-actly defined by the organizers of the Shared Task. Statistical significance was computed using the corrected resampled (two tailed) t-Test (Nadeau and Bengio, 2003), which is suitable for cross-validation based experiments. The test signifi-cance was 0.05.
We experimented with almost all types of n-gram features used by the participants of the Shared Task. For each feature family we built 6 different LMs based on a different n-gram range (from [1,3] to [1,8]).
Table 2 shows the classifier performance us-ing different feature families individually. For each family we selected the most successful n-gram range. We noticed that a higher n-n-gram or-der improves only character based features. For other feature families the differences in perfor-mance were not statistically significant. In such cases we selected the lowest n-gram order to keep the model as simple as possible.
The accuracies presented in Table 2 were ob-tained using language models built from the lower-cased texts. Table 3 shows the accuracy improve-ment based on the lower-case transformation. We consider language models built on original train-ing data to be too sparse. Transformation to lower-case makes the data less sparse and language mod-els more expressive. Each model in Table 3 uses 11 cross-entropy based features. Language mod-els contains n-grams from the range [1, 3].
C T S4 P PR ST Accuracy
x x x x x x 82.43±0.5
x x x x x 82.18±0.8
x x x x 82.16±0.6
x x x x 81.97±0.5
x x x x x 81.91±0.6
x x x 81.31±0.4
x x 81.07±0.5
x x 80.94±0.7
x x x x x 78.29±0.7
x 77.99±0.7
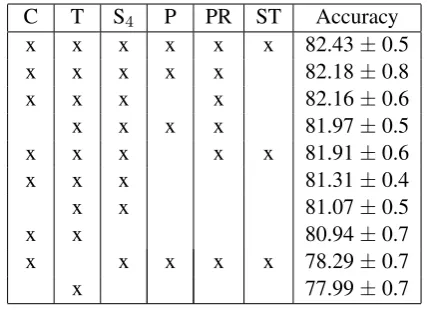
Table 4: Accuracy with confidence intervals of the system using combinations of different feature families, as defined in Section 4.5: C – characters, T – tokens, S4– suffixes of length 4, P – POS tags,
PR – proficiency, and prompt, ST – statistical fea-tures.
5.4 Feature Families Combinations
To obtain the best performance we tried to find out the most successful combination of the proposed feature families. Table 4 shows several interesting combinations.
The individual suffix model achieved best per-formance with the length of 6 (see Table 2). How-ever, in combination with other families, it finally appeared that the best performance was achieved with the suffixes with the length of 4, which was found using the cross-validation on the training data set. Our hypothesis is that the suffix mod-els with the length greater than 4 are rather sim-ilar to the token models, since many tokens have less than 5 characters, which implies that the gain from their combination is quite poor. Therefore the choice of S4does not seem to be dependent on
the training data set.
The full combination of the feature families consists of 55 features. We wanted to examine whether we could reduce this amount even more. According to Table 4, the most important family is the token feature family. Its removal from the model causes a large decrease in accuracy. On the other hand, the removal of the statistical feature family (ST) and POS tags feature family (P) leads to almost the same system performance.
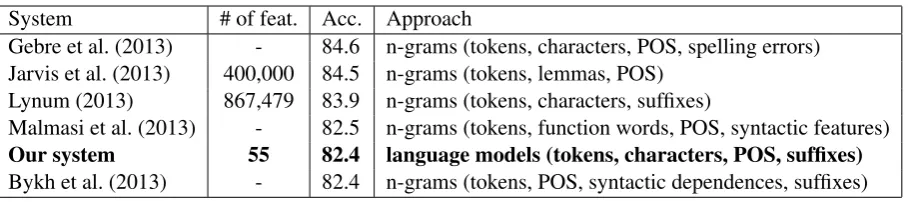
System # of feat. Acc. Approach
Gebre et al. (2013) - 84.6 n-grams (tokens, characters, POS, spelling errors) Jarvis et al. (2013) 400,000 84.5 n-grams (tokens, lemmas, POS)
Lynum (2013) 867,479 83.9 n-grams (tokens, characters, suffixes)
Malmasi et al. (2013) - 82.5 n-grams (tokens, function words, POS, syntactic features)
Our system 55 82.4 language models (tokens, characters, POS, suffixes)
Bykh et al. (2013) - 82.4 n-grams (tokens, POS, syntactic dependences, suffixes) Table 5: Final comparison of different NLI systems submitted to theclosedsub-task. Number of features is not provided for the Shared Task participants who did not specified it in their reports.
paper), while our models with the accuracy be-tween 78 % and 81.3 % are significantly better. Since we do not know all details of their imple-mentation, we can only hypothesize that the big difference in accuracy is mainly due to different smoothing methods used, or perharps due to dif-ferent computation of the entropic scores.
5.5 Best Shared Task Systems – Comparison
Our experiment settings are perfectly in line with the Shared Task guidelines, so we can directly compare the performance of our system with the best participants of the Shared Task, see Table 5. All the best systems used n-grams of tokens, char-acters, and POS tags. Two systems (Malmasi et al., 2013; Bykh et al., 2013) used also syntacti-cally based n-grams and function words. The sys-tems differ in the value type provided for n-gram feature vectors. The most successful systems (Ge-bre et al., 2013; Lynum, 2013) used TF-IDF. Other systems used binary values as well as absolute and relative frequencies.
In fact, all compared systems work with hun-dreds of thousands of n-gram features. Training models with such a huge number of features re-quires specific hardware and could be time con-suming. Of course, our model also deals with a huge number of n-grams, but are hidden in the lan-guage models consisting of smoothed linear com-binations of n-grams. All the statistical informa-tion extracted and collected when the 11 language models are learned from the training data is finally comprised in a small number of features. The re-sulting benefit is that the SVM learner then works only with a few already trained and smoothed lin-ear n-gram combinations and in contrast to the other compared models it does not need to learn a huge number of parameters/weights for all n-gram features.
6 Conclusion
We described our system for identifying the native language (L1) of a non-native English writer. Our research was focused on the use of a significantly reduced feature space. The language modeling ap-proach and using cross-entropy scores led to an enormous decrease in the feature space dimension: from hundreds of thousands to 55 features.
In comparison with the recent work by Tetreault et al. (2012), who also examined the use of lan-guage models in a similar way, we obtained a bet-ter result when using only the features based on language modeling, which is probably due to the fact that (1) we used a different (and for our pur-pose significantly better) smoothing method, and (2) we succesfully combined several approches to language modeling using different types of n-grams. Another difference is in using our “nor-malized cross-entropy scores” as features in con-trast to their “perplexity scores”, the exact effect of which, however, is not known.
We experimented with and combined several feature families and a number of different lan-guage models. Cross-validation testing on the TOEFL11 corpus revealed that our best model ac-curacy is 82.4 % in categorizing essays into 11 L1 languages, which is a result comparable to the state-of-the-art.
Acknowledgements
Claude Nadeau and Yoshua Bengio. 2003. Infer-ence for the generalization error. Machine Learning, 52(3):239–281.
Eric Sven Ristad. 1995. A natural law of succession.
CoRR, abs/cmp-lg/9508012.
Fatiha Sadat, Farzaneh Kazemi, and Atefeh Farzindar. 2014. Automatic identification of arabic language varieties and dialects in social media. In Proceed-ings of the Second Workshop on Natural Language Processing for Social Media (SocialNLP), pages 22– 27. Association for Computational Linguistics and Dublin City University, 08/2014.
Bernard Smith and Michael Swan. 2001. Learner En-glish: A teacher’s guide to interference and other problems. Ernst Klett Sprachen.
Efstathios Stamatatos. 2009. A survey of modern au-thorship attribution methods. Journal of the Ameri-can Society for Information Science and Technology, 60(3):538–556.
Andreas Stolcke. 2002. Srilm-an extensible lan-guage modeling toolkit. In Proceedings Interna-tional Conference on Spoken Language Processing, pages 257–286, November.
Benjamin Swanson and Eugene Charniak. 2012. Na-tive language detection with tree substitution gram-mars. InProceedings of the 50th Annual Meeting of the Association for Computational Linguistics (Vol-ume 2: Short Papers), pages 193–197. Association for Computational Linguistics.
Joel Tetreault, Daniel Blanchard, Aoife Cahill, and Martin Chodorow. 2012. Native tongues, lost and found: Resources and empirical evaluations in na-tive language identification. InProceedings of COL-ING 2012, pages 2585–2602. The COLING 2012 Organizing Committee.
Joel Tetreault, Daniel Blanchard, and Aoife Cahill. 2013. A report on the first native language identi-fication shared task. InProceedings of the Eighth Workshop on Innovative Use of NLP for Build-ing Educational Applications, pages 48–57, Atlanta, Georgia, June. Association for Computational Lin-guistics.
Kristina Toutanova, Dan Klein, Christopher D. Man-ning, and Yoram Singer. 2003. Feature-rich part-of-speech tagging with a cyclic dependency network. InProceedings of the 2003 Conference of the North American Chapter of the Association for Computa-tional Linguistics on Human Language Technology - Volume 1, NAACL ’03, pages 173–180, Strouds-burg, PA, USA. Association for Computational Lin-guistics.
Ian H. Witten and Thomas C. Bell. 1991. The zero-frequency problem: Estimating the probabilities of novel events in adaptive text compression. IEEE Transactions on Information Theory, 37(4):1085– 1094.
![Table 1: The influence of different smoothing methods and n-gram ranges (from [1,3] to [1,8]) on thesystem accuracy](https://thumb-us.123doks.com/thumbv2/123dok_us/1089053.1137411/5.595.140.460.62.173/table-inuence-different-smoothing-methods-ranges-thesystem-accuracy.webp)