Article
Nuclear Magnetic Resonance and Headspace Solid-Phase Microextraction Gas
Chromatography as Complementary Methods for the Analysis of Beer Samples
Sarah R. Johnson 1, Samantha E. Soprano 1, Laura M. Wickham 1, Neil Fitzgerald 1,* and John C. Edwards 2 1 Department of Chemistry Biochemistry & Physics, Marist College, 3399 North Road, Poughkeepsie,
NY 12601, USA; sarah.johnson6@marist.edu (S.R.J.); Samantha.soprano1@marist.edu (S.E.S.); laura.wickham1@marist.edu (L.M.W.); john@processnmr.com (J.C.E.)
2 Process NMR Associates, 87A Sand Pit Road, Danbury, CT 06810, USA * Correspondence: neil.fitzgerald@marist.edu; Tel.: +1-845-575-3000
Abstract: Chemical analysis of the organic components in beers has applications to quality control, authenticity and improvements to the flavor characteristics and brewing process. This study aims to show the complementary nature of two instrumental techniques which in combination can identify and quantify the majority of organic components in a beer sample. Nuclear Magnetic Resonance (NMR) was used to provide concentrations of twenty five different organic compounds including alcohols, organic acids, carbohydrates, and amino acids. Calorie content was also estimated for the samples. NMR data for ethanol concentrations were validated by comparison to a Fourier Transform Infrared Spectrometry (FTIR) method. Headspace Solid-Phase Microextraction (SPME) Gas Chromatography Mass Spectrometry (GCMS) was used to identify a range of volatile compounds such as alcohols, esters and hop derived aroma compounds. A simple and inexpensive conversion of a Gas Chromatography Flame Ionization Detector (GC FID) instrument to allow the use of Solid-Phase Microextraction was found to be useful for the quantification of volatile esters.
Keywords: beer; nuclear magnetic resonance; solid-phase microextraction; gas chromatography
1. Introduction
Beer is the most popular alcoholic beverage in America [1]. Interest in craft beers in the United States has led to the substantial increase in small scale breweries that typically cannot afford sophisticated analytical techniques. A market potentially exists, therefore, for independent entities which have access to laboratories and expensive instrumentation to provide analytical services to breweries. Analysis of organic chemicals in beer samples has quality control and authenticity applications and can also provide information to the brewer to improve the efficiency of the process, quality of product and discover the source of problems in the system.
Beer is a complex mixture of over 800 organic molecules ranging from the ng/L to percent
produced as a result of yeast metabolism. Resulting ester and alcohol concentrations can provide information about wort composition, fermentation parameters, and yeast strains.
Nuclear Magnetic Resonance (NMR) is a common chemical characterization technique. The instrument is typically used to provide structural information about organic compounds. It also has the capability to generate quantitative information for components in complex mixtures. The instrument utilizes a strong magnetic field to cause the alignment of a fraction of the nuclear spins in a sample which are then capable of absorbing radio frequency radiation. The frequency absorbed depends on the chemical environment of the absorbing nucleus. The strength of absorption at a given frequency depends on the concentration of the chemical and number of nuclei in an identical chemical environment. Therefore, if the number of identical nuclei are known for a given molecule, the concentration can be determined by comparison to an internal standard of known concentration. Nord et al. [3] used proton NMR to quantify organic and amino acids in beer samples and compared their results to those obtained by High
Performance Liquid Chromatography (HPLC) and capillary electrophoresis. The methods were found to be in good agreement. Duarte et al. [4] investigated multivariate analysis of NMR and Fourier Transform Infrared Spectrometry (FTIR) data as a potential tool for the quality control of beer. They applied Principal Component Analysis (PCA) to data obtained from 50 beer samples to be able to group beers to common characteristics. The same group used PCA of proton NMR data in order to be able to
investigate effects of brewing site and date of production [5]. A similar approach has been reported by Lachenmeier et al. [6] for potential application to quality control of beer.
A limitation of NMR is the relatively poor detection limits. Typically sample concentrations below approximately 10 mg/L are not observable. For volatile substances at lower concentrations (such as alcohols, esters, aldehydes, ketones, and sulfur compounds) headspace capillary Gas Chromatography (GC) is commonly used. Headspace Solid-Phase Microextraction (SPME) is a simpler and less expensive alternative to static headspace. The method involves exposing a fiber to the headspace in order to concentrate the volatile analyte on the fiber surface. The analyses are subsequently thermally desorbed from the fiber in the GC inlet. SPME has been applied to a wide variety of sample types including beer. Jelen et al. [7] compared static headspace and SPME for the analysis of alcohols and esters in beers. They found the two methods to be highly correlated and suggested SPME as an inexpensive alternative to automated static headspace. Horák et al. [8] compared SPME to Stir Bar Sorptive Extraction for the analysis of selected esters in beer. They found the two methods to have similar performance with high repeatability and good linearity. Several others have demonstrated the application of SPME GCMS for the analysis of volatile compounds in beer [9-11].
In this work we demonstrate the complementary nature of NMR and headspace SPME GC for identification and quantification of important flavor and aroma compounds in beer samples. The techniques were applied to 9 beer samples of a variety of styles obtained from a small craft brewery. NMR ethanol data has also been compared to Fourier Transform Infrared Spectrometry (FTIR) results to provide validation of the NMR method.
2. Experimental
2.1 NMR Analysis
A volume of degassed beer samples (175 µL) was brought to a final volume of 750 µL with deuterated water. Exactly 10.0 mg of the internal quantitation standard in the form of maleic acid (Sigma Aldrich, St. Louis, MO, USA, 99.0%) was added to the samples. The samples were run under quantitative conditions on a Varian Mercury 300MVX NMR spectrometer equipped with a 5 mm ATB probe. Spectra were analyzed using Mnova (Mestrelab, Escondido, CA) software.
Components were quantified using the equation:
Component mg/L = 10 * ((Icomp / Ncomp) / 50) * (MWcomp / 116.1) * (1,000,000 / 175)
Where 10 is the mass of maleic acid in milligrams, Icomp is the integration of component resonance, Ncomp is the number of protons integrated, 50 is the integration of maleic acid/number of protons , MWcomp is the molecular weight of component molecule in atomic mass units, 116.1 is the molecular weight of maleic acid in atomic mass units, and the 1000000/175 factor rectifies the volumetric component of the calculation to allow mg/L to be calculated.
Calorie values were estimated based on total alcohol = 7 Cal/g, total carbohydrates = 4 Cal/g, total amino acids = 4 Cal/g and total organic acids = 4 Cal/g.
2.2 SPME GC Analysis
Identification and quantitation of aroma compounds in samples were accomplished by Solid-Phase Microextraction (SPME) of the headspace followed by Gas Chromatography (GC). For identification, the headspace was exposed to a Custodion Solid Phase Micro Extraction fiber (DVB/PDMS, 65µm) for 30 seconds prior to injection into a Torion T-9 GCMS (MXT-5 column, 50-296˚C at 2˚C/s with an initial hold time of 10 s and final hold time of 47 s).
For quantification of selected esters, a standard additions calibration method was employed followed by Gas Chromatography with an Agilent 5890 GC FID fitted with a DB 1 column (30 m, 0.53 mm id, 1.5 µm film thickness) and modified to accept the Custodian SPME fiber using a SPME septum (Merlin
Microseal) and 19 ga nut. The fiber was exposed in the GC inlet for 10 seconds prior to starting the temperature program (injector 270°C, detector 280˚C, oven temperature: 50°C for 3 min, 10˚C/min, 280°C for 1 min).
Standard additions were prepared in 4 mL glass vials fitted with septa. Solutions were prepared by combining 1.5 mL of degassed beer sample with varying amounts of a mixed stock solution and adding deionized water to achieve a total volume of 2 mL. Solutions were capped and heated at 80˚C for 30 minutes while exposing the SPME fiber to the headspace. The mixed stock solution was prepared by combining 40 mL of 200 proof ethanol (Sigma Aldrich, St. Louis, MO, USA) with 40.0 mg of isoamyl acetate (TCI, Tokyo, Japan, >98%), 11.9 mg of ethyl caprylate (Acros, New Jersey, USA, 99%+), and 12.4 mg of ethyl caprate (Acros, New Jersey, USA, 99%+) in a 100 mL volumetric flask and making to volume with deionized water.
2.3 FTIR Analysis
an iD7 ATR accessory was used to measure the area of the C-O stretching band between 1064 cm-1 and 1030 cm-1.. Ethanol concentrations were determined by a standard additions calibration method.
3. Results
3.1 NMR Results
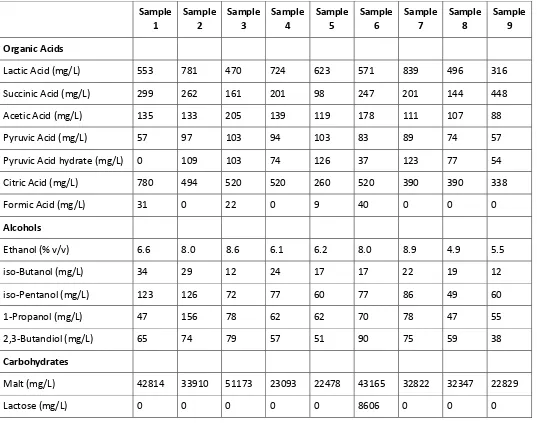
A typical NMR spectrum of a beer sample is shown in Figure 1. The concentrations of several alcohols, organics, carbohydrates, and amino acids can be determined from a single spectrum using maleic acid as an internal standard. Concentrations were calculated by comparison of integrals, knowing the number of chemically identical protons in each compound, the number of moles of maleic acid and the volume of sample. Concentrations of major organic compounds are listed in Table 2.
3.2 SPME GC Results
Figure 2 shows a typical chromatogram of a beer sample demonstrating clear resolution of common alcohol and ester compounds allowing several aroma compounds to be identified. Table 1 shows quantitative information for three common ester compounds. Several compounds were found to be below the detection limit for the method. Further optimization of the method may be possible to produce lower detection, however, the values determined are in a typical range for beer samples [12, 13]. Highest isoamyl acetate values were detected in samples 1 and 9 which were both characterized as Belgium style ales. Lowest ester concentrations were seen for the stout, Hefeweizen and English brown styles (samples 4, 5 and 6).
3.3 Ethanol Content
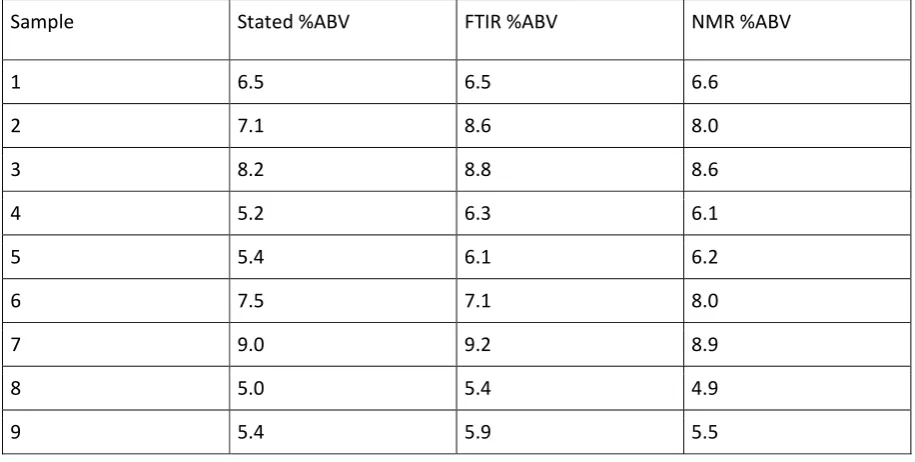
In order to validate the NMR method for ethanol content, the %ABV (Alcohol By Volume) quoted by the brewery was compared to the NMR values and FTIR values determined by a standard additions method. An ANOVA test at 95% confidence suggests a significant difference between the methods. Paired t-tests at 95% confidence show significant differences between the stated values and NMR method and the stated values and FTIR results, however, no statistical difference was found between the FTIR and NMR methods. Generally the stated values were lower than NMR and FTIR values.
4. Discussion
were compared to the values stated by the brewer and obtained by standard additions attenuated total reflectance infrared spectroscopy. The FTIR and NMR values were in good agreement which provides validation of the NMR method. Both NMR and FTIR methods provided values generally the same or higher than the stated values. This may indicate that some of these unfiltered samples continued to ferment in the barrel. The number of identifiable compounds by NMR could be increased and the detection limit lowered by freeze drying the sample.
The headspace SPME GC method is a nice complement to NMR as it provides information about volatile compounds which are present at concentrations that are too low for NMR to measure. In this work we focused on ester compounds but any volatile compound in the sub mg/L to percent range could potentially be measured. We used a GCMS instrument after headspace SPME sample preparation to identify volatile compounds. Some of the compounds identified are listed in Table 3. A relatively simple and inexpensive conversion of a GC FID instrument provides a cheaper method for identifying and quantifying compounds. In this case, however, known standards need to be available and identification is only possible by comparison of retention times. Quantification is also much more complex and time consuming than the NMR method. Initial attempts to quantify by external standards and internal standards calibration proved unsuccessful. Therefore, standard addition calibration was employed. Values obtained for three ester compounds were within expected ranges[12, 13]. Isoamyl acetate is known to be produced in higher amounts by Hefeweizen and Belgian yeast [14]. In this study, the two Belgium style beers (samples 1 and 9) did show higher isoamyl acetate values. The Hefewiezen (sample 4) however, did not show a measureable isoamyl acetate concentration. We do not have an explanation for this discrepancy. More compounds could be identified and detection limits lowered by a thorough optimization of the headspace SPME sample preparation. For example, Jeleń et al. [7] found that the addition of 28% sodium chloride had a significant effect on extraction efficiency via the salting out effect. Similarly, Horák et al. [8] found that adding 5 g of sodium chloride to their 10 mL sample improved recoveries of esters from beer. Extraction time, temperature, and sample volume could also be optimized to improve performance.
5. Conclusions
References
1. Gallup New Service. Gallup Poll Social Series: Consumption Habits. Available online:
http://www.gallup.com/file/poll/174083/Favorite_Alcoholic_Drink_140723%20.pdf (accessed on 28th July 2016).
2. Meilgaard, M.C.D. Beer Flavour. D. Tech Dissertation, Technical University of Denmark, Lyngby, Denmark, 1981.
3. Nord, L.I.; Vaag, P.; Duus, J.Ø. Quantification of Organic and Amino Acids in Beer by 1H NMR Spectroscopy. Anal. Chem. 2004, 76, 4790-4798.
4. Duarte, I.F.; Barros, A.; Almeida, C.; Spraul, M.; Gil, A.M. Multivariate Analysis of NMR and FTIR Data as a Potential Tool for the Quality Control of Beer. J. Agric. Food Chem. 2004, 52, 1031-1038.
5. Almeida, C.; Duarte, I.F.; Barros, A.; Rodrigues, J.; Spraul, M.; Gil, A.M. Composition of Beer by 1H NMR Spectroscopy: Effects of Brewing Site and Date of Production. J. Agric. Food Chem. 2006, 54, 700-706. 6. Lachenmeier, D.W.; Frank, W.; Humpfer, E.; Schäfer, H.; Keller, S.; Mörtter, M.; Spraul, M. Quality Control of Beer using High-Resolution Nuclear Magnetic Resonance Spectroscopy and Multivariate Analysis. Eur. Food Res. Technol. 2005, 220, 215-221.
7. Jeleń, H.H.; Wlazly, K.; Wąsowica, E.; Kamiński, E. Solid-Phase Microextraction for the Analysis of Some Alcohols and Esters in Beer: Comparison with Static Headspace Method. J. Agric. Food Chem.
1998, 46, 1469-1473.
8. Horák, T.; Ćulík, J.; Kellner, V.; Jurková, M.; Ćejka, P.; Hašková, D.; Dvořák, J. Analysis of Selected Esters in Beer: Comparison of Solid-Phase Microextraction and Stir Bar Sorptive Extraction. J. Inst. Brew. 2010,
116, 81-85.
9. Kleinová, J.; Klejdus, B. Determination of Volatiles in Beer using Solid-Phase Microextraction in Combination with Gas Chromatography/Mass Spectrometry. Czech J. Food Sci. 2014, 32, 241-248. 10. Leça, J.M.; Pereira, A.C.; Vieira, A.C.; Reis, M.S.; Marques, J.C. Optimal Design of Experiments applied to Headspace Solid Phase Microextraction for the Quantification of Vicinal Diketones in Beer through Gas Chromatography-Mass Spectrometric Detection. Anal. Chim. Acta 2015, 887, 101-110.
11. Pinho, O.; Ferreira, I.M.P.L.V.O.; Santos, L.H.M.L.M. Method Optimization by Solid-Phase
Microextraction in Combination with Gas Chromatography with Mass Spectrometry for Analysis of Beer Volatile Fraction. J. Chromatogr. A. 2006, 1121, 145-153.
12. Meilgaard, M.C. Prediction of Flavor Differences between Beers from their Chemical Compositions. J. Agric. Food Chem. 1982, 30, 1009-1017.
13. Common Brewing Faults. Available online:
http://wine.appstate.edu/sites/wine.appstate.edu/files/Common%20Attributes_Taubman.pdf (accessed July 29th 2016).
Figure Captions
Figure 1: Proton NMR spectrum of an IPA style beer (sample 2).
Figure 2: Headspace SPME chromatogram of an IPA style beer (sample 2).
Figure 3: Comparison of malt and lactose concentrations for nine beer samples.
Table Captions
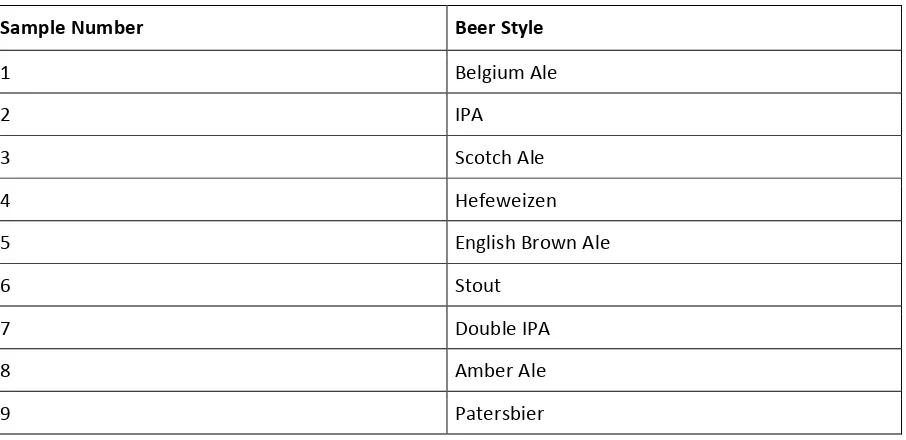
Table 1. Beer sample styles.
Table 2: Concentrations of organic compounds in beer determined by NMR.
Table 3: Concentrations of common ester compounds and other compounds identified.
Table 4: Comparison of methods for the determination of ethanol concentrations.
Figure 2: Headspace SPME chromatogram of an IPA style beer (sample 2).
Figure 3: Comparison of malt and lactose concentrations for nine beer samples.
Table 1. Beer sample styles.
Sample Number Beer Style
1 Belgium Ale
2 IPA 3 Scotch Ale
4 Hefeweizen
5 English Brown Ale
6 Stout
7 Double IPA
8 Amber Ale
9 Patersbier
0 15000 30000 45000 60000
1 2 3 4 5 6 7 8 9
C
once
n
tr
at
io
n (mg/L)
Sample Number
Sample 1
Sample 2
Sample 3
Sample 4
Sample 5
Sample 6
Sample 7
Sample 8
Sample 9
Organic Acids
Lactic Acid (mg/L) 553 781 470 724 623 571 839 496 316
Succinic Acid (mg/L) 299 262 161 201 98 247 201 144 448
Acetic Acid (mg/L) 135 133 205 139 119 178 111 107 88
Pyruvic Acid (mg/L) 57 97 103 94 103 83 89 74 57
Pyruvic Acid hydrate (mg/L) 0 109 103 74 126 37 123 77 54
Citric Acid (mg/L) 780 494 520 520 260 520 390 390 338
Formic Acid (mg/L) 31 0 22 0 9 40 0 0 0
Alcohols
Ethanol (% v/v) 6.6 8.0 8.6 6.1 6.2 8.0 8.9 4.9 5.5
iso-Butanol (mg/L) 34 29 12 24 17 17 22 19 12
iso-Pentanol (mg/L) 123 126 72 77 60 77 86 49 60
1-Propanol (mg/L) 47 156 78 62 62 70 78 47 55
2,3-Butandiol (mg/L) 65 74 79 57 51 90 75 59 38
Carbohydrates
Malt (mg/L) 42814 33910 51173 23093 22478 43165 32822 32347 22829
Lactose (mg/L) 0 0 0 0 0 8606 0 0 0
Peer-reviewed version available at
Beverages
2017
,
3
, , 21;
Amino Acids
Histidine (mg/L) 60 60 91 106 30 106 0 0 0
Uridine (mg/L) 24 24 95 119 24 167 214 24 143
Tryptophan (mg/L) 60 40 119 179 60 219 239 0 219
Phenylalanine (mg/L) 277 306 377 406 203 425 509 167 261
Tyrosine (mg/L) 194 247 300 380 159 362 415 203 177
Gallic Acid (mg/L) 66 50 50 0 25 83 91 0 33
GABA (mg/L) 487 643 713 668 266 558 477 362 352
Proline (mg/L) 1122 1149 1463 1274 754 1274 1301 628 870
Alanine (mg/L) 336 315 333 315 136 246 420 98 200
Valine (mg/L) 0 384 221 145 129 303 411 120 204
Cal/L 561 607 709 462 452 682 654 417 418
Peer-reviewed version available at
Beverages
2017
,
3
, , 21;
Sample Isoamyl Acetate (mg/L)
Ethyl Caprylate (mg/L)
Ethyl Caprate (mg/L)
Other compounds identified
1 2.1 1.6 0.8 Ethanol, ethyl acetate, isoamyl alcohol, ethyl
butyrate
2 0.2 0.2 BDL Ethanol, ethyl acetate, isoamyl alcohol, ethyl
butyrate, glyceraldehyde, butyl butyrate, β-pinene
3 ND BDL 0.9 Ethanol, ethyl acetate, isoamyl alcohol, ethyl
butyrate
4 BDL BDL BDL Ethanol, ethyl acetate, isoamyl alcohol, ethyl
butyrate, linalool
5 ND BDL BDL Ethanol, ethyl acetate, isoamyl alcohol, ethyl
butyrate
6 BDL BDL BDL Ethanol, ethyl acetate, isoamyl alcohol, ethyl
butyrate
7 1.0 BDL 0.8 Ethanol, ethyl acetate, isoamyl alcohol, ethyl
butyrate, butyl butyrate, isoamyl propionate, β
-pinene, amyl butyrate
8 0.6 0.4 0.2 Ethanol, ethyl acetate, isoamyl alcohol, ethyl
butyrate, amyl butyrate
9 3.4 BDL 0.6 Ethanol, ethyl acetate, isoamyl alcohol, ethyl
butyrate, ethyl valerate
BDL=Below Detection Limit, ND=Not Determined/Unacceptable Line Fit.
Peer-reviewed version available at
Beverages
2017
,
3
, , 21;
Table 4: Comparison of methods for the determination of ethanol concentrations.
Sample Stated %ABV FTIR %ABV NMR %ABV
1 6.5 6.5 6.6
2 7.1 8.6 8.0
3 8.2 8.8 8.6
4 5.2 6.3 6.1
5 5.4 6.1 6.2
6 7.5 7.1 8.0
7 9.0 9.2 8.9
8 5.0 5.4 4.9
9 5.4 5.9 5.5