Analysis of The Sea Level Rise of Guam
Albert Parker
1,*and
Cliff Ollier
21 Formerly School of Engineering and Physical Science, James Cook University, Townsville, QLD, Australia 2 The University of Western Australia, Crawley, WA, Australia
* Corresponding author
E-mail address: albert.parker@jcu.edu.au
Abstract
Many reported sea level records are often not a single measurement. They are then a composition of different records from several tide gauges. Sometimes, they are from the same tide gauge, but the tide gauge stability has been affected by earthquakes. This is the case of Guam as discussed in the present manuscript. The claimed sea level acceleration of Guam is only the result of two earthquakes that have compromised the stability of the tide gauge.
Keywords
Sea Level Rise, Sea Level Acceleration, segmented tide gauge records, Earthquakes, Guam
1. Introduction
Many sea level records are often not a single measurement. but They are then a composition of different records from several tide gauges. Sometimes, they are from the same tide gauge, but the tide gauge stability has been affected by earthquakes. This is the case of Guam as discussed in the present manuscript. The claimed sea level acceleration of Guam is only the result of two earthquakes that have compromised the stability of the tide gauge.
There is a need for science to be properly checked, and this is especially the case in the science of climate change. There is a problem of the missing checks of data sets, and sometimes the arbitrary redefinition of the numbers in the data sets. There is also the problem of the missing checks of the scientific claims based on the interpretation of the data. This is for example the case of the claim by the United States Environmental Protection Agency (www.epa.gov), a government agency, that in the recent publication “What Climate Change Means for Guam” (United States Environmental Protection Agency, 2016) write “Sea level has risen by about four inches relative to Guam’s shoreline since 1993.”. The publication then concludes that “If the oceans and atmosphere continue to warm, sea level around Guam is likely to rise one to three feet in the next century.”
The claim of a sharp sea level rise of about four inches or
about 1001.6 mm since 1993 has never been peer reviewed and published in a scientific journal, and our consideration of the data below suggests it may be in error, dismissed as soon as the relative sea level data for Guam are considered carefully. However, nobody has done this basic fact check. Rather, the statement is considered “settled science” by the general press. Nevertheless, the claim by the US EPA has been indeed echoed in the media, as for example by the authoritative New York times in a piece of title “North Korea Aside, Guam Faces Another Threat: Climate Change” (Ives, 2017).
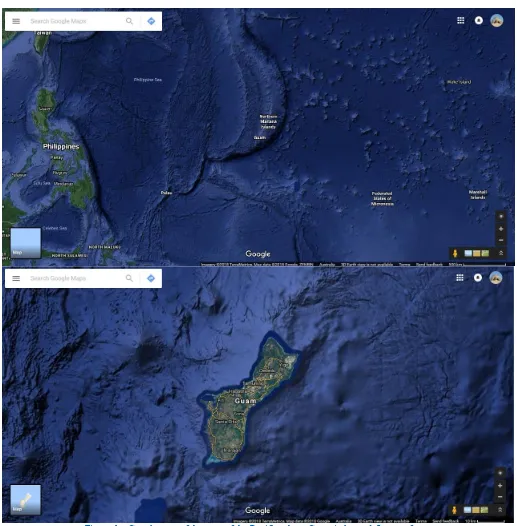
From en.wikipedia.org/wiki/Guam, Guam is an un-incorporated territory of the United States in Micronesia in the western Pacific Ocean, Figure 1. In 2016, 162,742 people resided on Guam. Guam has an area of 540 km2 and a
population density of 299/km2. Guam is part of an island
chain created by the colliding Pacific and Philippine Sea tectonic plates. Challenger Deep, the deepest surveyed point in the Oceans, is southwest of Guam at 10,911 meters deep. The highest point in Guam is Mount Lamlam at an elevation of 407 meters. The island of Guam is 50 km long and 6 to 19 km wide. The island experiences occasional earthquakes.
Preprints (www.preprints.org) | NOT PEER-REVIEWED | Posted: 2 April 2018 doi:10.20944/preprints201803.0196.v2
Figure 1 – Google map of the area of the Pacific where Guam is located. Images from www.google.com.au/maps/@13.443597,144.6068712,3065433m/data=!3m1!1e3 and www.google.com.au/maps/@13.4649666,144.8169847,95786m/data=!3m1!1e3\
2. The tide gauge records of
Guam
Before looking at gauge records we must note that earthquakes in Guam are not infrequent and they are often accompanied by tsunami. During the time window covered by the recording of the Apra Harbor tide gauge, there have been five earthquakes, November 1975, August 1993, April 1997, October 2001 and April 2002. Some of them have left clear sign in the record. Also, Guam is not supposed to be
subjected to subsidence.
American Journal of Environment and Sustainable Development Vol. X, No. X, 2017, pp. XX-XX 3
gauges of the Pacific. The mean trend for the datasets that span more than 25 years, a minimum length suggested by the BOM/NTC to produce minimally reliable trends was only +1.14 mm/yr., an inconvenient truth for many. The rate of rise for Guam is 0.61 mm/yr., Figure 2. To be noted, the fluctuations of the mean sea levels are close to the fluctuations of the Southern Ocean Index (SOI).
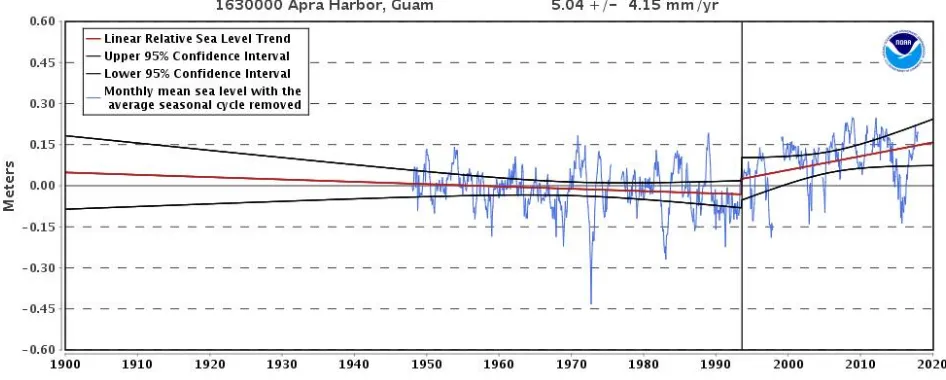
Figure 3 then presents the relative sea level trend in Guam Apra Harbor according to NOAA. The trend is 5.04 millimeters/year with a 95% confidence interval of +/- 4.15 mm/yr. based on monthly mean sea level data from
1993 to 2017. The image is from
tidesandcurrents.noaa.gov/sltrends/sltrends_station.shtml?stn id=1630000.
Nominally because of an earthquake, NOAA arbitrarily ignored the data prior of 1993, starts the computation about a low water level, and neglects the very evident effect of another earthquakes much larger than the effect of the earlier earthquake as better explained in detail later.
Without cherry picking the short time window, but not accounting for the shift of datum linked to a couple of earthquakes, the full record of Guam Apra Harbor, Figure 4, provides a much smaller rate of rise (analysis from
sealevel.info,
www.sealevel.info/MSL_graph.php?id=guam&lin_ci=0&qua dratic=1&co2=0).
With date range 1948/1 to 2016/11 the slope is 1.762 ±1.297 mm/yr., and the acceleration is an unrealistically large 0.1765 ±0.1362 mm/yr².
Figure 2 - Annual mean sea levels and linear sea level trends (mm/year) for Guam Apra Harbor. Figure reproduced modified from Australian Government Bureau of Meteorology National Tidal Center (2006). Y axis tick marks every 10 cm.
Figure 3 - Relative sea level trend in Guam Apra Harbor according to NOAA. The trend is 5.04 millimeters/year with a 95% confidence interval of +/- 4.15 mm/yr. based on monthly mean sea level data from
1993 to 2017. Image from tidesandcurrents.noaa.gov/sltrends/sltrends_station.shtml?stnid=1630000.
Figure 4 – Trend analysis in Guam Apra Harbor from sealevel.info. Image from www.sealevel.info/MSL_graph.php?id=guam&lin_ci=0&quadratic=1&co2=0.
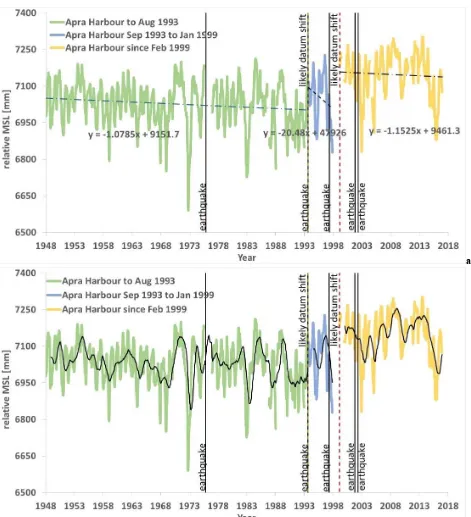
If we analyze the relative sea level measurements from the Apra Harbor tide gauge (data from
www.psmsl.org/data/obtaining/stations/540.php),
Figure 5, we may note that the claim by the US EPA is not objective. A proper examination of the data from the tide gauge shows the following:
The tide gauge record has a gap of 2 months in January and February 1993, before the August 1993 earthquake, but not after. There has been no disruption of measurements following the August 193 earthquake. The pattern before and after the earthquake seems different.
The tide gauge has a long gap of 14 months from December 1997 to February 1999. It follows the April 1997 earthquake, but it started 6 months later. It is trailed by two other gaps of 2 and 3 months, June to July 1999, and then September to November 1999. The pattern does not seem different before and after the earthquake, but it seems different from the time the measurements restarted after the 14 months disruption.
The relative sea levels have been continuously reducing from January 1948 to August 1993 at a rate of -1.08 mm/year.
In August 1993 there is a likely datum shift of 20-30 mm following the 7.8 Mw Mag., IX MMI earthquake.
PSMSL reports on October 16, 2002 “Guam - suspected land movement of 2-3cm in 1993 following earthquake.”
In February 1999, when the measurements restart after an interruption of 14 months following the April 1997 6.5 Mw Mag. VII MMI earthquake, there is the impression of an even larger second, additional datum shift of not less than 30-40 mm.
PSMSL reports on July 18, 2011 that the stability of the tide gauge is a concern. “The operators of the Guam tide gauge Center for Operational Oceanographic Products and Services (CO-OPS) part of NOAA note that a change in the sea level trend occurs after the 1993 Guam earthquake. The
stability of the tide gauge datum for the post earthquake is therefore a concern.CO-OPS continue to monitor the site.”
Remarkably, there is no note in PSMSL explaining the reason why the measurements were discontinued for 14 months, and then erratic in the following 6 months, following the April 1997 earthquake. Similarly, there is no mention of a possible second datum shift that seems very likely from the data.
Since January 1999, the sea levels have been continuously falling at a rate of -1.15 mm/year.
Even though it makes no sense to compute trends with only 4 years of data, (September 1993 to November 1997), after that there are no data until February 1999), if we do so the sea levels are still falling. After that there are no data until February 1999.
The early 1990s were a time of generally low sea levels across the Pacific following the Southern Ocean Index (SOI) oscillations (Parker, 2013; Parker, 2014a, b; Parker & Ollier, 2017a, b, Mörner, 2007, 2010, 2016).
The 12 months average of MSL in 1992 is 103 mm lower than the 12 months average of the MSL of 1948 (6,952 vs. 7,056 mm).
Despite the two unaccounted datum shifts, of 20-30 mm, and then 30-40 mm, the 12 months average of MSL in 2016 is 114 mm higher than the 12 months average of MSL in 1992 (7,066 vs. 6,952 mm), but still only 11 mm higher than the 12 months average of MSL in 1948.
American Journal of Environment and Sustainable Development Vol. X, No. X, 2017, pp. XX-XX 5
a
b
Figure 5 - Monthly average mean sea levels (MSL) in Apra Harbor. (a) linear fittings. (b) 12 months moving averages.
In addition to Apra Harbor, Guam also has the tide gauge of Pago Bay (www.psmsl.org/data/obtaining/stations/2130.php), unfortunately recording only since May 2004. With the same short time window of data May 2004 to November 2015, Pago Bay has a mild sea level rise of +1.24 mm/year while Apra Harbor has a much stronger sea level fall of -3.01 mm/year.
By accounting for the two datum shifts of 30 mm since
September 1993 and another 30 mm since February 1999, and clearing the MSL time series of the subsidence rates of the inland domes of GUAM and GUUG, the absolute MSL is completely detrended only showing oscillations since January 1948.
The sea levels have been reducing in all the 3 periods of nearly continuous measurements separated by the two very likely datum-shifts (break-points). Every alignment technique
magnitude of the two datum shifts as soon as their existence is admitted.
By neglecting the two datum shifts, and starting the time window in January 1993, the 100 mm of sea level rise were already there in December 2002. There was therefore no reason to wait until 2016 to make a claim, especially the incredibly high rate of sea level rise of more than 10 mm/year. Despite the neglected datum shifts of not less than 50-70 mm total, the water level of 2016 are about same as of 1948.
A datum shift is likely to have occurred in August 1993, the same time as the earthquake, and then before measurement restarted in February 1999, after the 14-months gap that followed the April 1997 earthquake. The two unaccounted datum shifts are 20-30 mm, and not less than 30-40 mm.
3. Conclusions
The alleged 4 inches or 100 mm of relative sea level rise since 1993 are very likely the effect of the two datum shifts. One, of about 20-30 mm, that is also mentioned by PSMSL immediately following the 1993 earthquake, is quite evident in the data. The other, of not less than 30-40 mm, very likely occurred after the 1997 earthquake. The sea level seems indeed quite different, from the time the measurements restarted after the 14 months disruption in February 1999, to the values immediately after the earthquake.
In addition, there is also the effect of the low water levels of 1992 that were 100 mm below the water levels of 1948 relating to the very well-known ENSO/SOI oscillations.
So, the science behind the alleged 100-mm sea level rise in Guam since 1993 is very far from solid. Yet nobody holding a position within a scientific organization has so far questioned this claim. Possibly many within the commercial academies are only waiting to apply for research grants aiming the study of the mitigation strategies to cope with the treat of this sea level rise. We believe there is no evidence for an alarming rise in sea level in Guam.
References
[1] Australian Government Bureau of Meteorology National Tidal Center (2006), Pacific Country Report, Sea Level & Climate: Their Present State, Tuvalu, June 2006.
www.bom.gov.au/ntc/IDO60033/IDO60033.2006.pdf [2] United States Environmental Protection Agency (2016),
What Climate Change Means for Guam. August 2016, EPA 430-F-16-062
https://19january2017snapshot.epa.gov/sites/production/ files/2016-09/documents/climate-change-gu.pdf
[3] Ives, M. (2017), North Korea Aside, Guam Faces Another Threat: Climate Change, New York Times, AUG. 11, 2017
www.nytimes.com/2017/08/11/world/.../guam-north-[4] Mörner, N.A., (2007), The Greatest Lie Ever Told. Nils-Axel Mörner.
[5] Mörner, N.A. (2010), There is no alarming sea level rise!
21st century science & technology. Fall 2010: 7-17. [6] Morner, N.A., (2016), Chapter 12 – Sea Level Changes
as Observed in Nature, in Evidence-Based Climate Science (Second Edition). Data Opposing CO2 Emissions as the Primary Source of Global Warming, Pages 215–229. Edited by:Don Easterbrook. ISBN: 978-0-12-804588-6.
[7] Parker, A. (2013), Natural oscillations and trends in long-term tide gauge records from the Pacific, Pattern Recogn. Phys., 1, 1-13.
[8] Parker, A. (2014a), Minimum 60 years of recording are needed to compute the sea level rate of rise in the Western South Pacific, Nonlinear Engineering. 3(1):1-10.
[9] Parker, A. (2014b), Confirming the lack of acceleration in the pacific sea levels, Environmental Science: An Indian Journal. 9(11):376-389.
[10]Parker, A. & Ollier, C.D., (2017a), California sea level rise: evidence based forecasts vs model predictions.
Ocean & Coastal Management, 149: 198-209. DOI: 10.1016/j.ocecoaman.2017.07.008