THE INTEGRATED BIOLOGICAL INDICATOR AS A TOOL FOR
DETECTION OF RIVER POLLUTION
JOHAN SOHAILI1, NOR AZMAN KASAN2, ZAHARAH IBRAHIM3 and NORMALA HASHIM4
1, 2, 4 Department of Environmental Engineering, Faculty of Civil Engineering, Universiti Teknologi Malaysia, 81310 UTM Skudai, Malaysia.
3 Department of Biology, Faculty of Science, Universiti Teknologi Malaysia, 81310 UTM Skudai, Malaysia
Correspondence E-mail: 1[email protected], 2 [email protected], 3[email protected], 4[email protected].
ABSTRACT
Water quality of the River Pontian Kecil is influenced by both organic and inorganic nature of pollutant. The predominant sources of Pontian Kecil contamination at Johor, Malaysia are agricultural activities and pollution derived from urban area located in the area within the river corridor. This river and its tributaries is important to human as water supply, domestic water uses, irrigation, fisheries and recreation. It should be controlled under the Water Quality Management Plan (WQMP) as beneficial water. The use of biological indicator is to predict local condition that can result in a variety of spatial scales that biological indicator can be addresses. Biological indicator was applied as a tool to measure the water resources condition, biological restoration goals, enforcement and compliance, and establishing baseline data for Nature Resource Damage Assessment (NRDA). The effect of future development along the river corridor on water quality could not be ruled out. A study on water quality, biological indicator and the existing species of flora and fauna are used in observing the effects of the activities within the river. The relevant sources are identified, an appropriate prevention and control measures is proposed.
Keywords: Water quality, Pontian Kecil and Biological indicator
1 INTRODUCTION
Malaysia has more than 1 million kilometers of rivers and streams that comprise corridors of great economic, social, cultural and environmental value. These corridors are complex ecosystems which include lands, plants, animals and network of streams within them. They perform a number of ecological functions such as modulating streams flow, storing water, removing harmful materials from water and providing habitat for aquatic and terrestrial plant and animals.
River corridors are an area with vegetation and soil characteristics distinctly different from surrounding uplands and support higher levels of species diversity, species densities and rates of biological productivity than most other landscape elements [4]. Streams and river corridors are also evolve in response to surrounding ecosystems. Changes within a surrounding ecosystem will impact the physical, chemical and biological processes occurring within a river corridor.
1.1 River Pollution
In general, rivers in Malaysia have also deteriorated over the years with the overall river water quality index falling by 1 percent from 1994 to 2002 (Table 1.1). However, there is no single major contributor to the deterioration of river water quality in the District of Pontian, Johor. The parameters measures in this study are including:
(i) Total Suspended Solids- as a measurement of suspended particulate in the river;
(ii) Biochemical Oxygen Demands- as a measurement of organic pollution resulting from
agro-based and other industries;
(iii) Ammoniacal Nitrogen-as a measurement of organic pollution from sewage and animal waste;
(iv) Chemical Oxygen Demands- as a measurement of chemicals pollution; and
(v) PH.
Table 1: Macro performance indicators for the state of the river water quality in Malaysia (1994-2002)
Parameters Rate of Changes (Percentage)*
Overall Water Quality Index -1
Total Suspended Solids -1
Biochemical Oxygen Demands -1
Ammoniacal Nitrogen -2
Source: Department of Environment, 1994
*Rate of change is measure based on percentage of compliance to the Proposed Interim National Water Quality Standards for Malaysia.
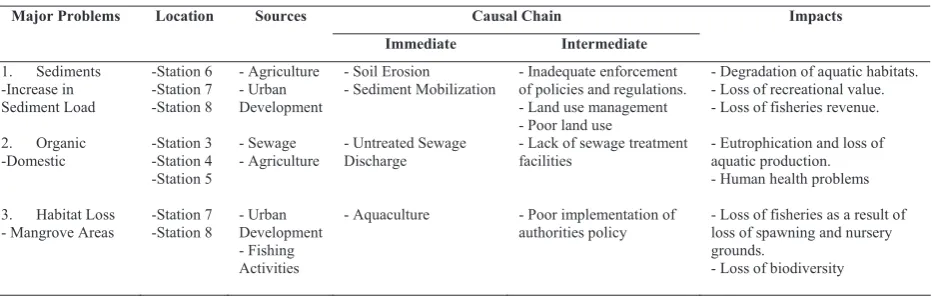
Some of the pollutants which enter the Sungai Pontian Kecil riverine system are suspended solids resulting from the land development and also organic waste from domestic sources and agricultural husbandry are considered to be the chronic pollutants. Table 4.1 provides an indication of the sources of pollution at Sungai Pontian Kecil Catchment’s area and the Causal Chain Analysis.
Table 2: Source of Pollution at Sungai Pontian Kecil and Causal Chain Analysis
Causal Chain Major Problems Location Sources
Immediate Intermediate
Impacts
1. Sediments -Increase in Sediment Load
-Station 6 -Station 7 -Station 8
- Agriculture - Urban Development
- Soil Erosion
- Sediment Mobilization - Inadequate enforcement of policies and regulations. - Land use management - Poor land use
- Degradation of aquatic habitats. - Loss of recreational value. - Loss of fisheries revenue.
2. Organic
-Domestic -Station 3 -Station 4 -Station 5
- Sewage
- Agriculture - Untreated Sewage Discharge - Lack of sewage treatment facilities - Eutrophication and loss of aquatic production. - Human health problems
3. Habitat Loss
- Mangrove Areas -Station 7 -Station 8 - Urban Development - Fishing Activities
- Aquaculture - Poor implementation of
authorities policy - Loss of fisheries as a result of loss of spawning and nursery grounds.
- Loss of biodiversity
1.2 Biological Assessment
One means of overcoming these problems is to use biological system to monitor water quality and provide a direct measurement of toxicity. These biological monitoring system can act as an early warning system that is automatically monitor the physiological or behavioral responses of aquatic organisms and provide an immediate indication or developing toxic condition [3].
Most organisms living in the water body are sensitive to any changes in their environment whether natural or cause by human. Different organisms are responding in different ways to these changes. The most common responds include death, total migration to a new habitat and physiological changes in aquatic organisms.
2 RESEARCH METHODOLOGY
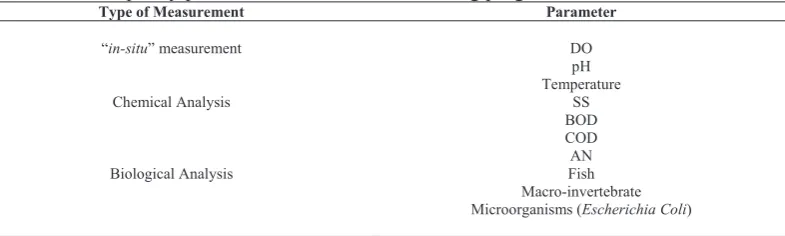
2.1 Evaluation of Monitoring Parameters
Samplings at Sungai Pontian Kecil are conducted at a frequency of twice a month. Water quality parameter monitored included “in-situ” measurements for general water quality parameter and collection of surface water samples and aquatic organisms as biological indicators. These parameters are selected to evaluate the water quality of Sungai Pontian Kecil river corridor according to human activities and sewage discharged from settlement areas as follows:
(i) General Water Quality: Dissolved Oxygen (DO), pH, Temperature and Suspended Solids (SS).
(ii) Human Activities: Biochemical Oxygen Demand (BOD) and Chemical Oxygen Demand (COD).
(iii) Sewage Pollution: Ammoniacal Nitrogen (AN), Microorganisms (E.Coli)
Table 3 : Water quality parameters included in monitoring program
Type of Measurement Parameter
“in-situ” measurement
Chemical Analysis
Biological Analysis
DO pH Temperature
SS BOD COD AN Fish Macro-invertebrate Microorganisms (Escherichia Coli)
Although the water quality monitoring of the Sungai Pontian Kecil river was conducted at a relatively high frequency, the interval of the sample collection was conducted without considering the tidal factors. The water quality data obtained from the analysis shows the water quality sampling of Sungai Pontian Kecil river was conducted randomly during high or low tides. Tidal consideration was highly important especially during samplings at the downstream stations which will be affected by tidal influences. A proper water quality monitoring programmed would require samplings to be conducted during low flow to enable the assessment of water quality during worst conditions.
2.2 Field Technique
2.3 Analytical Technique
Chemical analysis to the water sample for determination of Biochemical Oxygen Demand (BOD), Chemical Oxygen Demand (COD) and Ammoniacal Nitrogen (AN) was done by using HACH-DR 4000. Total suspended solids and total coliform for determination of microorganism was also carried out at the Environmental Engineering Laboratory, Faculty of Civil Engineering, Universiti Teknologi of Malaysia.
2.4 Assessment of Biological Indicator
Most organisms living in the water body are sensitive to any changes in their environment, whether natural or cause by human. Different organisms respond in different ways to these changes. The most common responds include death, total migration to new habitat and physiological changes in aquatic organisms.
Continuous monitoring of water quality is traditionally done through the uses of physico-chemical sensors that can measure such parameter as pH, dissolved oxygen concentration and specific toxic constituents. These data can provide valuable immediate information on the potential toxicity of water to aquatic organisms or even to human, but physico-chemical sensors do have a number of drawbacks. Since they do not directly measure toxicity, they cannot detect materials that are not specifically monitored or that are present at levels that are toxic but below analytical detection limits. One means of overcoming these problems is to use biological system to monitor water quality and provide a direct measurement of toxicity. These biological monitoring systems can act as an early warning system, automatically monitor the physiological or behavioral responses of aquatic organisms and provide an immediate indication or developing toxic condition [3]. The biological assessments conducted in this study involve organisms as follow:
i) Fish
ii) Macro-invertebrates iii) Microorganisms (bacteria)
3 RESULT AND DISCUSSION
3.1 Water Quality Trends
“In-situ” measurements were taken and water quality sampling was carried out at a frequency twice a month from May 2004 to November 2004 for Sungai Pontian Kecil river. The study area for water quality monitoring station on the Kg. Pesisir and Pekan Bakek was selected to represent the brackish water zone at the downstream site while the freshwater zone was represented by the station at Kg. Sepakat Jaya, Kg. Melayu Ulu Pontian, Kg. Sawah and Kg. Bt 30 at the upstream site of Sungai Pontian Kecil Catchments.
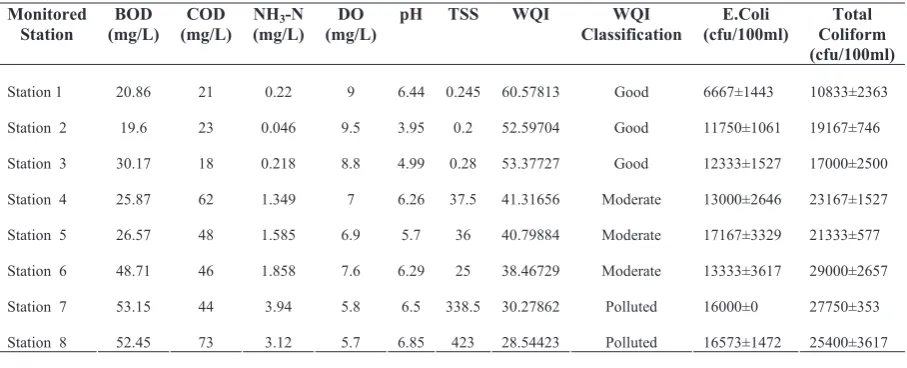
The Water Quality Index Classification in Table 4 considers the Station 1, Station 2 and Station 3 sampling points were “Good”. While the other three sampling points which are Station 4, Station 5 and Station 6 located at the middle stream were classified as “Moderate”. The remaining two stations which are Station 7 and 8 are designated as “polluted”. The indices mostly affected are the Dissolved Oxygen (DO), Biochemical Oxygen Demand (BOD), Chemical Oxygen Demand (COD) and the Ammoniacal Nitrogen (AN).
Table 4: Water quality and coliform bacteria counting results. Monitored
Station (mg/L) BOD (mg/L) COD (mg/L) NH3-N (mg/L) DO pH TSS WQI Classification WQI (cfu/100ml) E.Coli Coliform Total (cfu/100ml) Station 1 20.86 21 0.22 9 6.44 0.245 60.57813 Good 6667±1443 10833±2363
Station 2 19.6 23 0.046 9.5 3.95 0.2 52.59704 Good 11750±1061 19167±746
Station 3 30.17 18 0.218 8.8 4.99 0.28 53.37727 Good 12333±1527 17000±2500
Station 4 25.87 62 1.349 7 6.26 37.5 41.31656 Moderate 13000±2646 23167±1527
Station 5 26.57 48 1.585 6.9 5.7 36 40.79884 Moderate 17167±3329 21333±577
Station 6 48.71 46 1.858 7.6 6.29 25 38.46729 Moderate 13333±3617 29000±2657
Station 7 53.15 44 3.94 5.8 6.5 338.5 30.27862 Polluted 16000±0 27750±353
Station 8 52.45 73 3.12 5.7 6.85 423 28.54423 Polluted 16573±1472 25400±3617
3.2 Biological Assessment
Most aquatic organisms living in the water body are very sensitive to any changes in their environment, whether natural or caused by human. Different organisms will response in different ways to these changes [11]. The most extreme responses include death or total migration to another habitat. Aquatic organisms studied “in-situ” can show the integrated effects of all impact on the water body and can be used to compare relative changes in water quality from site to site.
The biological diversity is defined as including species diversity, ecosystem diversity and genetic diversity [12]. For the purpose of this study the discussion will be limited to species diversity. Where species diversity is concerned, there is no single authority on the actual size of river biological diversity in the country. The natural resources of the Sungai Pontian Kecil river corridor are multi-faceted which is ranging from the wildlife habitat to the rare plant habitats. The cold water of the river supports fishes habitat such as Liza parmata (Belanak) and also creates micro-climates which is sustain upland vegetation such as banana tree, tapioca, papaya and also palm oil plant. In order to maintain these significant natural resources values, the waters of the Sungai Pontian Kecil must be stay clean and the surrounding lands needs to continue to provide wildlife habitats and as a buffer of the harmful impacts.
3.3 Fish Species Abundance
The field surveys conducted in this study has yielded a total of 103 specimens comprising 10 fish species and 5 shrimps species as shown in Table 5 below. However, the total number of individuals and species collected was relatively small when compared to the size of the catchment. Table 5 below shows the distribution of species and number of individuals according to the monitored stations.
Table 5: Number of species and individuals according to station
Station 1 Station 2 Station 3 Station 4 Station 5 Station 6 Station 7 Station 8
Number of Species / genus
0 0 0 3 6 4 12 10
Total
Individual 0 0 0 3 10 17 31 42
As shown in the Table 5 above, the highest numbers of individuals were distributed at the stations 7 (Kg. Pesisir) and station 8 (Kg. Bakek) at the downstream of the river. Station 4 (Kg. Bt 30), station 5 (Kg. Parit Selangor) and station 6 (Kg. Parit Bengkok) are located in an oil palm plantation which has less human activities and other disturbance. The river stretch at station 4 has been continuously dug and widened for river maintenance purpose while station 5 and station 6 is influenced by discharges from nearby factory. While station 7 and station 8 are located near mangrove areas and also was influenced by the tidal activities from the sea water. All these factors may have contributed to the species diversity at the downstream area of the river.
On the other hand, there are also stations which are devoid of any fish species such as station 1 (Kg. Sepakat Jaya), station 2 (Kg. Melayu Ulu Pontian) and station 3 (Kg. Sawah). It is because of the difficulty to catch the fish in the areas of the Gunung Pulai Reservoir. It is possible that conditions such as these may have contributed to the lack of aquatic species in that area.
3.4 Macro-Invertebrates Community Composition and Abundance
In Sungai Pontian Kecil catchments, about 15 invertebrates taxa (benthic macro-invertebrate cladocerans and cepopods are excluded) including 4 taxa of Diptera, 1 taxa of Trichoptera, 2 taxa of Ephemeroptera, 1 taxa of Coleoptera, 1 taxa of Odonata, 1 taxa of Lepidoptera, 1 taxa of Hemiptera, 1 taxa of Collemboiia, 1 taxa of Crustacea, I taxa of Mollusca and 1 taxa of Annelida were identified (Table 6).
Table 6: Benthic macro-invertebrates numbers found at each Sungai Pontian Kecil river sampling station.
Station 1 Station 2 Station 3 Station 4 Station 5 Station 6 Station 7 Station 8 Diptera
Corduliida 1 1 4
Chironomidae 3 1 4 1 5 8
Simuliidae 6 4
Tipulidae 1 3 1 3 5 2
Trichoptera
Hydropsychidae 1 4 5
Ephemeroptera
Baetidae 1 4 1 1
Tricorythidae 3 4 5 3
Coleoptera
Hydrophilidae 2 4 3 1 1
Odonata
Protoneuridae 3 2 3 2
Lepidoptera
Pyralidae 1 4 2 1 3
Hemiptera
Veliidae 3 1 5 1
Collemboiia
Isotomidae 3 1
Crustacea
Pseudothelphusidae 1 2 1 1 1 2
Mollusca
Physidae 3 2 2 2
Annelida
Oligochaeta 4 3 3 3 1
3.5 E. Coli and Total Coliform
Studies were carried out on the evaluation of the Sungai Pontian Kecil river water samples at eight different selected sampling points. The method for the enumerations of the microorganisms was done using Fecal Coliform Test. The results was obtained from the laboratory analysis and presented in the Table 4 above.
Fecal coliform or E.Coli is bacteria that live in the guts of all warm-blooded animals. The bacteria are used to indicate the possibility of sewage pollution (Newman, 1999). It can be summarized that all stations in the Sungai Pontian Kecil were significantly higher during the raining season due to the storm water runoff. The present study indicated that the total coliform pollution was quite high, ranging from 12000 to 53500 cfu/ml for both raining and non-raining seasons.
Meanwhile, E.Coli values ranged in values from 9000 to 28000 cfu/ml. Table 4 shows the results
for water quality and coliform counting for the Sungai Pontian Kecil.
4 CONCLUSION
Although the pollution from the non-point sources is difficult to quantify, it nevertheless any actions for the need to identify the strategies that would help minimize the pollution from these sources. One inevitable strategy is to institute and implement policies that would ensure the control of socio-economic practices near water bodies. The strategy here includes recommending reviews, consolidations, updating and enforcement of existing Malaysian laws through agencies of the Government of Malaysia. In addition, innovative and alternative policy initiatives to enhance management of riparian environments in the country should be explored.
Control of impacts of urban activities, management of surface water run-off movement and water quality management, sedimentation control and vegetation protection along the river corridor should be the paramount objectives for any future management strategies adopted for Sungai Pontian Kecil Catchments.
ACKNOWLEDGEMENT
The co-operation received from the Department of Environmental Engineering, Faculty of Civil Engineering, Universiti Teknologi Malaysia communities to this study is highly appreciated. The authors are grateful to the Research Management Centre, UniversitiTeknologi Malaysia for funding this fundamental research through vot no. 75081.
REFERENCES
[1] APHA, 2002. Standard Method for the Examination of Water and Wastewater, 20th
Edition, Washington, D.C: American Public Health Association.
[2] Arundel, J. 1995. Sewage and Industrial Effluent Treatment: A Practical Guide. Oxford: Blackwell Science.
[3] Cairns, J., and Van Der Schalie, W.H. 1980. Water Research. Vol.14. 1179-1196pp [4] Celina B., Benoit J. and Lue B., (2002), Importance of Riparian Habitats to Flora
Conservation in Farming Landscape of Southern Quebec, Canada. Agricultural,
Ecosystem & Environment. Vol:94 pages:73-87.
[5] Christopher H., and Dominic C., (2003). Ecological Assessment and Strategies for the
Management of Mangrove in Brisbane Water-Gosford, New South Wales, Australia.
Landscape and Urban Planning. Vol: 62 pages 219-240
[6] Corbitt, R.A., 1999. Standard Handbook of Environmental Engineering, 2nd Edition, New
York: Mc Graw Hill. 589-593
[7] Department of Environmental Ministry of Sciences, Technology and the Environmental Malaysia, (2003). The Study of Pollution Prevention and Water Quality Improvement of
Sungai Tebrau and Sungai Segget, Volume 2: Page 2-1 – 2-44.
[9] Karr, J.R. and D.R Dudley, 1981. Ecological Perspective on Water Quality Goals. Environmental Management 5: 55-68
[10] Malaysian Department of Environment, 1997. Laporan Kualiti Alam Sekeliling, Malaysia: Department of Environment.
[11] Martha, E., (2004). Qualitative Study of Phytoplankton and Zooplankton in Lower
Grande De Anasco River and Tributaries. Page 1-8
[12] Newman, P.J., Nixon S.C., and Rees, Y.J., (1999). Surface water Quality: Monitoring,
Classification, Biological Assessment and Standard, Water Sciences and Technology, 30
(10): 1-10.