School Students: The Role of In-School, Out of School, and Psychological Factors. (Under
the direction of M. Nils Peterson).
Solving environmental challenges will require an environmentally literate citizenry,
equipped with ecological knowledge, pro-environmental attitudes, problem-solving skills,
and motivation toward environmentally responsible behaviors. This dissertation addresses
three approaches to building environmental literacy (EL) among middle school students:
through schools (Chapter 1), through activities outside of school (Chapter 2), and through
understanding psychological factors that affect environmental perceptions (Chapter 3).
Chapter 1. This study examined school-wide EE programs among middle schools in
North Carolina, including the use of published EE curricula and time outdoors while
disparities in EL levels may be mitigated by time spent in nature, especially among black and
Hispanic students.
Chapter 2. Significant life experience (SLE) research suggests presence of role
models, time outdoors, and nature-related media foster pro-environmental behavior, but most
research is qualitative. Based on a random sample of middle school students in North
Carolina, USA, we found limited positive associations between presence of a role model and
time outdoors with behavior and a negative association between watching nature television
and environmental knowledge. The strongest predictors of environmental knowledge and
behavior were student/teacher ratio and county income levels, respectively. We also found
that Native Americans engaged in environmental behaviors more than Caucasians, and that
African American and Hispanic students had lower levels of environmental knowledge.
Accordingly, life experiences appear less important than promoting small class sizes and
addressing challenges associated with lower incomes in schools.
Chapter 3. Though many climate literacy efforts attempt to communicate climate
change as a risk, these strategies may be ineffective because among adults, worldview rather
than scientific understanding largely drives climate change risk perceptions. Further,
increased science literacy may polarize worldview-driven perceptions, making some climate
literacy efforts counterproductive among skeptics. Because worldviews are still forming in
the teenage years, adolescents may represent a more receptive audience. This study
examined how worldview and climate change knowledge related to acceptance of
by
Kathryn Tate Stevenson
A dissertation submitted to the Graduate Faculty of
North Carolina State University
in partial fulfillment of the
requirements for the degree of
Doctor of Philosophy
Fisheries, Wildlife & Conservation Biology
Raleigh, North Carolina
2014
APPROVED BY:
_______________________________
______________________________
M. Nils Peterson
Howard Bondell
Committee Chair
________________________________
________________________________
DEDICATION
To all who taught me love of land, water, and creatures.
BIOGRAPHY
Kathryn Stevenson is a North Carolina native and grew up in Hickory. Seeds for her
interest in environmental education were planted early, through camping trips with her
family and many summers at the Green River Preserve, a camp set on 3,500 wooded acres in
Western North Carolina. One of Kathryn’s first teaching experiences was working as a camp
counselor at Green River, leading daily hikes, afternoon activities like canoeing and rock
climbing, and weekend backpacking trips.
Kathryn continued to develop her commitment to environmental education at
Davidson College, where she earned a Bachelors of Science in Biology and minor in
Spanish. She spent several terms abroad, studying wildlife management with the School for
Field Studies in Kenya, interning at Hammond Ranch in Zimbabwe, and studying
comparative tropical ecology and Spanish in Ecuador. On campus, she worked in Mike
Dorcas’s Herpetology Lab, where she started an outreach program for local schools; taking
lab animals to classrooms, setting up cover board monitoring on elementary school
campuses, and bringing K-12 students to work in the field with herpetology lab staff. She
also started EcoTeam at Davidson, which trains undergraduate students to teach
environmental education programs in third grade classrooms.
two years on Catalina Island, she moved to San Francisco where she taught high school
science at Drew School. Though she was in the classroom, she still got her students outside
through nearly weekly local field trips and extended trips to North Carolina, Kenya and
Tanzania, and the Galapagos Islands.
ACKNOWLEDGMENTS
Many, many thanks are owed for all the help and support that carried me to and
through graduate school. Firstly, my committee members – Nils Peterson, Sarah Carrier,
Howard Bondell, Susan Moore, and Renee Strnad – who have all been so generous with their
time, encouraging and supportive, and just fun to work with. Thank you to Renee for
snatching me up, finding me the perfect project, and continuing to keep me focused on the
point of all this research. Thanks goes to Susan for all the excellent editing and enthusiastic
leadership, especially on those laborious grant applications. Howard deserves special
recognition for cheerfully guiding me through my endless statistics queries, even while on
sabbatical. Thank you to Sarah for your passionate support of me and my work and the
opportunities to collaborate with you on yours. Special thanks to Nils for being a great
advisor; offering endless encouragement, guidance, editing, advice, opportunities,
enthusiasm, and skilled teaching and leadership every step of the way.
experience. A big thank you to Sarah Slover and Cindy Burke for patiently answering all
my questions, filing all that paperwork, and making sure we all stay in line; and also to all the
Turner House folks for making the wildlife cohort a great community. Thank you also to
North Carolina Sea Grant who funded all the research included here.
TABLE OF CONTENTS
LIST OF TABLES ... ix
LIST OF FIGURES ... x
CHAPTER 1: Environmental, Institutional, and Demographic Predictors of Environmental
Literacy among Middle School Children ... 1
Abstract ... 1
Introduction ... 3
Materials and Methods ... 8
Ethics statement ... 8
Sample selection ... 8
Survey instrument ... 10
Data collection ... 11
Data analysis ... 12
Results ... 14
Descriptive statistics ... 14
EE and outdoor education ... 14
Teacher attributes ... 16
Student attributes ... 17
School attributes... 18
Discussion ... 19
EE and outdoor education ... 19
Teacher development ... 21
Student attributes ... 23
Conclusions ... 27
References ... 28
CHAPTER 2: Role of significant life experiences in building environmental knowledge and
behavior among middle school students ... 46
Abstract ... 46
Introduction ... 47
Contributions and limitations of significant life experience research ... 47
Research on SLE-related variables with children ... 49
Study objectives ... 51
Methods... 51
Sampling ... 51
Survey instrument ... 52
Data analysis ... 54
Results ... 55
Discussion ... 56
Conclusion ... 60
CHAPTER 3: Overcoming skepticism with education: Interacting influences of worldview
and climate change knowledge on perceived climate change risk among adolescents ... 71
Abstract ... 71
Introduction ... 73
Methods... 77
Theoretical Model ... 77
Sampling ... 78
Instrument development... 79
Data Analysis ... 81
Ethics Statement... 82
Results ... 83
Discussion ... 84
References ... 90
APPENDECES ... 99
Appendix 1: Environmental Knowledge and Behavior Scales (Chapter 2) ... 100
LIST OF TABLES
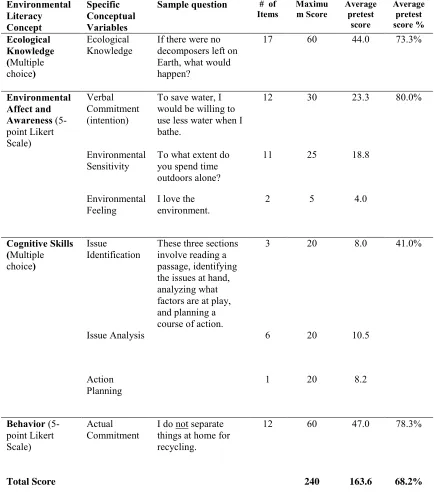
Table 1.1. Summary of MSELS contents and average pretest scores (McBeth et al., 2008).
The MSELS was organized into eight specific concept variables that were grouped into
four environmental literacy concept component scores. Average pretest scores for the
total sample are shown in raw score and percentage of maximum score for each
component. ... 41
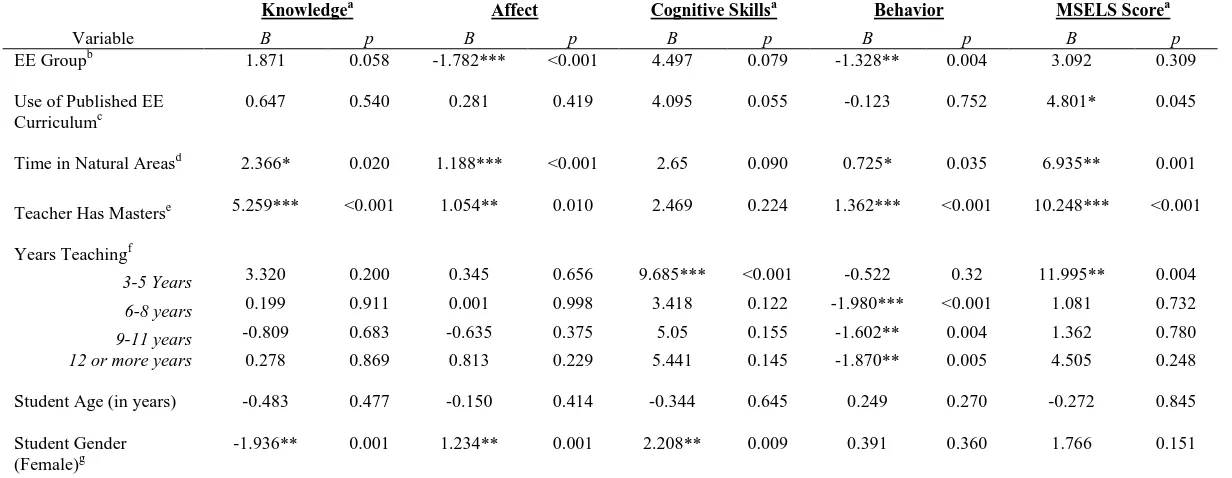
Table 1.2. Pretest MSELS Scores. Each labeled column represents a separate multiple
regression model for each section of the MSELS as well as total scores (N = 731).
Metric coefficients and p-values are displayed. Each model includes random effects for
classroom and all standard errors are robust. ... 42
Table 1.3. Difference in MSELS Scores between pretest and posttest. Each labeled column
represents a separate multiple regression model for each section of the MSELS as well
as total scores (N = 378). Metric coefficients and p-values are displayed. Each model
includes random effects for classroom and all standard errors are robust. ... 44
Table 2.1. Questions measuring SLE exposure among students. Each of these questions was
multiple choice with the directions, “on your answer sheet, darken in the letter of the
response that tells us the extent to which the s
tatement is true for you
.” Choices were a)
to a great extent, b) to a large extent, c) to a moderate extent, d) to a small extent, and e)
to no extent, corresponding to values of 1-5 respectively. Mean scores are reported with
standard deviations (
n
= 407). ... 69
Table 2.2. Regression models predicting environmental knowledge and behavior. Random
effects are significant (non-zero) in both models (N = 405). ... 70
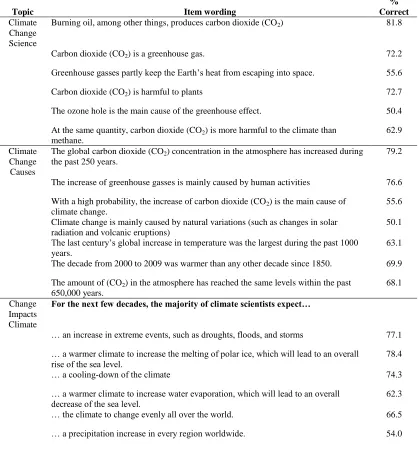
Table A2.1 Climate change knowledge scale. We drew these questions from Tobler et al.
(2012) and modified quesitons based on pretesting with middle school students (
n
=
92). Percentage correct represents the percentage of respondents whose answers reflect
current scientific understanding (n = 378) ... 104
Table A2.2 Individualism scales adapted from Kahan (2012). We modified the wording of
the original questions slightly based on results from pretesting with middle school
students (
n
= 92 ). Individualism was a six-point Likert scale ranging from strongly
disagree to strongly agree. ... 105
Table A2.3. Hierarchy scale
adapted from Pratto et al (1994). We modified the wording of
LIST OF FIGURES
Figure 3.1. Path diagram model for climate change risk perceptions among adolescents.
Path coefficients displayed are standardized. We weighted our sample to reflect the
population of coastal North Carolina before analysis (n = 378). Paths from each
demographic variable to each endogenous variable were included in the analysis, but
only the statistically significant paths are shown. Model goodness of fit statistics are as
follows: SRMR = 0.010 and overall R
2= 0.278. For ethnicity, 0 = white and 1 =
non-white. For gender, 0 = male and 1 = female. ... 97
Figure 3.2. Effect of increased climate change knowledge on acceptance of anthropogenic
global warming among students with differing worldviews. Both regression lines
predicting acceptance of anthropogenic global warming (AGW) (
n
= 378) were
generated from the regression equation implied by Figure 1 where climate change
knowledge, worldview, and demographic variables predict acceptance of AGW.
Predicted values and 95% confidence intervals (represented by error bars) of acceptance
of AGW have been converted to percentages of maximum scale score (max = 13).
Communitarians and individualists are represented by individualism-communitarianism
scale scores in the 10
thand 90
thpercentiles, respectively. Similarly, low knowledge is
represented by a 10
thpercentile score and high knowledge as a 90
thpercentile score.
Error bars represent a 95% confidence interval. ... 98
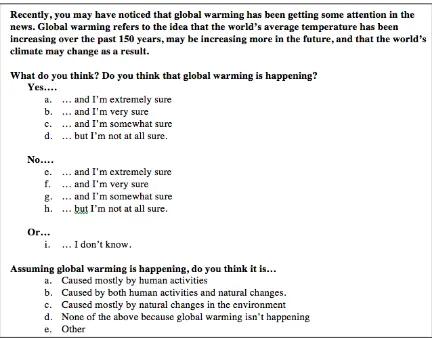
Figure A2.1. Acceptance of AGW scale
.
Items were taken from the only available
CHAPTER 1: Environmental, Institutional, and Demographic Predictors of
Environmental Literacy among Middle School Children
This chapter has been published with the following citation:
Stevenson, K. T., Peterson, M. N., Bondell, H. D., Mertig, A. G., & Moore, S. E. (2013).
Environmental, institutional, and demographic predictors of environmental literacy
among middle school children.
PLoS ONE
,
8
(3).
Abstract
Building environmental literacy (EL) in children and adolescents is critical to meeting
current and emerging environmental challenges worldwide. Although environmental
education (EE) efforts have begun to address this need, empirical research holistically
evaluating drivers of EL is critical. This study begins to fill this gap with an examination of
school-wide EE programs among middle schools in North Carolina, including the use of
published EE curricula and time outdoors while controlling for teacher education level and
experience, student attributes (age, gender, and ethnicity), and school attributes
(socio-economic status, student-teacher ratio, and locale). Our sample included an EE group
selected from schools with registered school-wide EE programs, and a control group
EE curricula paired with time outdoors represents a strategy that may improve all key
components of student EL. Further, investments in teacher development and efforts to
maintain enthusiasm for EE among teachers with more than 5 years of experience may help
to boost student EL levels. Middle school represents a pivotal time for influencing EL, as
improvement was slower among older students. Differences in EL levels based on gender
suggest boys and girls may possess complementary skills sets when approaching
Introduction
Direct responses to global environmental crises can slow the tide of environmental
degradation, but reversing the trend will require an environmentally literate citizenry. These
direct responses have included converting nearly 12% of the earth’s land base to protected
areas, which has undoubtedly altered the trajectory of species extinction (Convention on
Biological Diversity, 2010). Similarly, international climate change treaties guided by the
UN Framework Convention on Climate Change (UNFCCC) and carbon markets represent
the seeds of a response to global warming (Schreurs, 2012). Comparable initiatives are
associated with marine protected areas (Agardy, 1994), water conservation and quality
(Brezonik & Cooper, 1994), and erosion mitigation (Liu, Li, Ouyang, Tam, & Chen, 2008).
The existence of these programs and development of future responses, however, depend
entirely on publics who understand ecology, care about the environment, possess skills to
assess environmental risk, and share a commitment to sustainability.
These four attributes of a citizenry capable of achieving sustainability are reflected by
the four components of environmental literacy (EL): Knowledge, Affect, Cognitive Skills,
and Behavior (Hollweg et al., 2011). The environmental education (EE) movement revolves
around promoting EL. Precursors to environmental education included both nature study
and outdoor education early in the 19
thcentury, but environmental education as a field gained
momentum in 1977 with the first intergovernmental conference on environmental education
organized by the United Nations Education, Scientific, and Cultural Organization
collaborations between environmental literacy experts have focused the definition of
environmental literacy on the following topics: ecological knowledge, environmental
attitudes and sensitivity, issue and action skills, and verbal and actual commitment to
proenvironmental behavior (Hollweg et al., 2011; McBeth, Hungerford, Marcinkowski,
Volk, & Meyers, 2008).
Environmental literacy helps to create a citizenry equipped to tackle current and
emerging environmental concerns worldwide (Bickford, Posa, Qie, Campos-Arceiz, &
Kudavidanage, 2012), and each component of EL is critical to this goal. Lack of empirical
ecological knowledge about problems like extinction and climate change makes the problems
insurmountable. For instance, a 2011 national poll found that 63% of adults in the United
States “think there is solid evidence that the earth is warming,” which was down from 71%
who saw solid evidence in 2008 (The Pew Research Center for the People & the Press,
2011). If citizens do not accept overwhelming scientific evidence of warming trends,
behavior to mitigate effects of global warming and support for government policies is highly
unlikely (Tobler, Visschers, & Siegrist, 2012). Similarly, even an empirically aware public
must care about the environment, have skills required to identify problems and solutions, and
a willingness to act before the problems can be adequately addressed. That these
investment in the environment, knowledge of and skill in using action strategies, and
intention to act (Hungerford & Volk, 1990), all key components of EL (Hollweg et al., 2011).
Classroom activities have limited ability to change some components of EL, notably
emotional connection to the environment (affect) and environmental behavior (Rickinson,
2001), and outdoor education has been promoted as a solution to this challenge. Time
outdoors has been linked with the affective components of EL, a key predictor for
proenvironmental behavior (Judith Chen-Hsuan Cheng & Monroe, 2010). Duerdon and Witt
(2010) found that classroom activities were associated with improved environmental
knowledge whereas field experiences were correlated with improved affect which indirectly
improved behavior by activating knowledge. Skelly and Zajicek (1998) also found time
outdoors was a key predictor of pro-environmental attitudes in their evaluation of a
gardening program. In Louisiana, horticulture teachers found that students participating in a
program with an outdoor component were more aware of their role in the environment than
students who did not participate in the program (Karsh, Bush, Hinson, & Blanchard, 2009).
field of environmental education. Legislation stemming from these conferences included
resolutions of the European Union Council of Environmental Education in 1988, the 1995
National Environment Statute in Uganda (Palmer, 1998), and the Environmental Education
Act of 1990 in the United States, which reestablished the Office of Environmental Education
after its elimination in the 1980s (Palmer, 1998). Most recently, a groundswell of support for
connecting children to nature spurred the No Child Left Inside Act of 2011 (NCLI) in the
United States, which would have provided $100 million in funding for state EE efforts if
passed. Though much of the aforementioned legislation supported specific programs, this act
emphasized the role of outdoor education, integrated EE into formal schooling, and required
the development of state EE standards, assessment, and teacher training through state-wide
EL plans adopted by state boards of education (H.R. 2547, 2011).
Given the potential role of EL in addressing global environmental crises and the rapid
expansion of EE around the world, there is surprisingly little empirical research addressing
how EL is formed (Keene & Blumstein, 2010). Further, even less research utilizes
before-after, treatment-control designs. Blumstein and Saylan (2007) suggest a “bunker mentality”
within the environmental community may explain the reluctance to more formally evaluate
the drivers of EL. Whatever the cause for limited evaluation, research addressing the drivers
of EL is critical (Palmer, 1999). Although many studies examine factors contributing to at
least one component of EL, (Bradley, Waliczek, & Zajicek, 1999; Karsh et al., 2009;
elements include the National Environmental Literacy Assessment (NELA) project (McBeth,
Hungerford, Marcinkowski, Volk, & Cifranick, 2011; McBeth et al., 2008) and the 2011
Framework for Environmental Literacy Assessment (Hollweg et al., 2011). The NELA team
developed the first major assessment tool for middle school students in the United States and
the Framework project established guidelines for use in developing future assessment tools
worldwide. Although these latest efforts have made progress in standardizing and measuring
EL, no studies we are aware of have controlled for confounding factors including ethnicity,
socio-economic background, school quality, and teacher training or addressed the degree to
which specific EE efforts are effective in a school setting.
minority students score lower than white students in other academic areas (Osborne, 2001)),
and (5) negatively related to student-teacher ratios and enrollment in lower-income schools.
Materials and Methods
Ethics statement
The North Carolina State University institutional review board (IRB # 2212)
approved this study. All participants provided written informed consent. Students and their
parents/guardians were given either a Passive Consent form or an Active Consent form, per
the preference of the teacher and/or school. The Passive Consent form was only signed and
returned if the parents/students did not want to participate. The Active Consent form was
signed and returned to indicate consent to participate in the study.
Sample selection
We targeted 6
thand 8
thgrade students because middle school students are developing
cognitive abilities linked to the goals of EL and represent the latest and prime stage for
influencing how students engage in society as citizens and environmental decision makers
(McBeth et al., 2008). Additionally, we chose 6
thand 8
thgraders so we could compare our
results with the only other large scale assessment of EL available at the time that our study
was conducted – Phase 1 of the National Environmental Literacy Assessment Project
(McBeth et al., 2008).
Sampling occurred in three stages: schools, teachers, and classrooms. We followed
the three stage sampling model for two groups – an EE group randomly selected from
programs, and a control group randomly selected from 6
thand 8
thgrade science classes in
North Carolina that were not registered with the Office of Environmental Education. We
generated the first stage of the EE sample from a list of all schools registered with the NC
Office of EE (n = 40). We generated the first stage of the control sample from a list of all
665 middle schools in North Carolina. We omitted the 40 schools already included in the EE
group and then randomly selected 40 schools for the control group from the remaining 625
schools.
From the two lists of 40 schools, we generated a list of 6
thand 8
thgrade science
teachers at each school. This process resulted in 135 teachers in the control group and 95
teachers in the EE group. We randomly selected 85 teachers from each group to recruit for
the study and e-mailed each a letter of introduction and a brief recruitment survey. We sent
up to four survey reminders to each teacher in 4–7 day increments. Of the 170 teachers
contacted, 59 (34.7%) responded, and of these, 21 declined to participate and 38 consented,
representing 20 members of the control group and 18 members of the EE group. Two
teachers from each group later withdrew from the study. The 64% compliance rate among
teachers who we successfully contacted could allow for bias if participating teachers were
more environmentally oriented than other teachers. Because evaluating drivers of EL was
more important than extrapolating findings to general assessments of EL in NC, this potential
bias should not be problematic. Further, we measured teachers’ environmental orientations
participating teachers were more environmentally oriented than others it should not bias
student scores. Entering the pretest, we had 18 teachers participating from the control group
(ten 6
thgrade and eight 8
thgrade teachers) and 16 teachers participating in the EE group (four
6
thgrade teachers and twelve 8
thgrade teachers). Though we contacted equal numbers of
teachers in the control and EE groups and in 6
thand 8
thgrades, differential teacher response
rates prevented equal classroom numbers. If a teacher taught more than one 6
thor 8
thgrade
class, we asked them to flip a coin to randomly select one class for participation.
Survey instrument
All students in the study were given the Middle School Environmental Literacy
Survey (MSELS) developed by the NELA team (McBeth et al., 2011, 2008). The MSELS
consists of eight sections that contribute to an overall environmental literacy score (Table 1).
The MSELS was based on four instruments that reported established high validity and
reliability – the Middle School Environmental Literacy Instrument (Bluhm, Hungerford,
McBeth, & Volk, 1995), Children’s Environmental Attitude and Knowledge Scale (Leeming,
Dwyer, & Bracken, 1995), the Secondary School Environmental Literacy Assessment
their students outside, and their own training. Key questions included whether they use a
published EE curriculum (e.g. Project WET, Project WILD, Project Learning Tree), if they
visit natural areas during class time, and their experience in education and EE.
Data collection
In January of 2012, we visited all 34 classrooms. We administered the MSELS to the
students and asked each teacher to complete the teacher survey. From April 11 to June 6,
2012, we returned to the same classrooms and administered the post-test (using the MSELS
again) to the students. While visiting each classroom for the post-test, we also asked teachers
to complete a shorter follow-up survey that asked about the time they spent outdoors with the
participating class, their use of EE, and any further EE training they had received since the
pretest.
The Title I program is authorized by the Elementary and Secondary Schools Act to give
additional funding to schools with high percentages of low-income students(107th Congress,
2002), and Title I status can be used as a measure of school-level SES. Locale includes 12
categories: Large city, midsize city, small city, large suburb, midsize suburb, small suburb,
fringe town, distant town, remote town, fringe rural, distant rural, and remote rural areas
(National Center for Education Statistics [NCES], 2006). We collapsed these categories into
urban (including all size cities and suburbs) and rural (including all size towns and rural
areas).
Data analysis
We analyzed data using STATA software, version 12.1. Multiple linear regression
analysis was used to model component scores for the pretest and the difference between the
post-test and pretest as a function of membership in the EE group, spending time outdoors as
reported by the teacher at the end of the study, use of published EE curriculum, teacher
education level (Master’s degree or higher), years teaching experience, student attributes
Additionally, we calculated robust standard errors to account for the possibility of unequal
variances between individual students (Stock & Watson, 2007).
For each analysis (pretest and difference in scores), we modeled each component of
the MSELS (Knowledge, Affect, Cognitive Skills, and Behavior) as well as Overall EL using
the aforementioned independent variables. We calculated each of these scores according to
the guidelines listed in the Phase One NELA study (McBeth et al., 2008). This method
weighted the four components in the MSELS to contribute equally to the Overall EL score.
When modeling the change in MSELS scores, we also included the pretest score as a
predictor to control for the fact that students scoring high in the pretest had less potential for
improvement in the post-test.
Results
Descriptive statistics
There were 415 students in the control group (240 6
thgraders and 175 8
thgraders) and
324 students in the EE group (70 6
thgraders and 254 8
thgraders). Almost half (49.1%) of the
students in the study spent some class time outdoors and 42.1% were exposed to published
EE curricula. The average student age was 12.7 years, and there were slightly more females
(53.1%) than males. The students were primarily white (70.6%) and black (14.6%), with
smaller percentages of Hispanic students (8.2%), Asian students (3.4%) and Native
American/Alaskan students (3.3%). Half (50.0%) of the teachers in the study held Masters
degrees, and the average experience level was 9.2 years teaching. Over half of the students
were from schools with Title I programs (56.3%), and from rural communities (66.0%). The
average school-wide student-teacher ratio was 14.6, and 26.8% of the students in the study
were enrolled in Charter or private schools. Average pretest Cognitive Skills were
considerably lower than the other three components measured in the MSELS (Table 1.1).
EE and outdoor education
The explanatory power of the Affect and Behavior pretest models was low (R
2= 0.071 and
0.054, respectively), suggesting that although there was a negative relationship between
school-wide EE programs and Affect and Behavior scores, important drivers of Affect and
Behavior (e.g., behavioral norms, values (Stern, 2000), parental attributes, presence of a role
model for environmental stewardship (Chawla, 1999)) were not accounted for in the models.
Although all schools in the EE group were registered with the NC Office of Environmental
Education as having EE programs, only four of the teachers in this group indicated that their
students participated in a formal EE program. Similarly, none of the teachers in the control
group were associated with schools registered with the Office of EE, but three reported their
students participated in a formal EE program.
Both the pretest and change in EL models support hypothesis 2 by suggesting that
taking students outside was positively related to EL. Spending time in nature was positively
related to the pretest scores for all components except Cognitive Skills (p=0.09) and was the
most important factor predicting the Affect pretest scores in terms of significance and
magnitude (Table 1.2). Time outdoors was the most important positive predictor of change
in the Behavior component along with whether the teacher had a Master’s degree (Table 1.3).
Teacher attributes
Our results support hypothesis 3 by suggesting teacher development, primarily
through advanced degrees, is associated with improved EL among students. Teachers with
Master’s degrees had students who pretested higher in all components of EL except for the
Cognitive Skills component (Table 1.2), and those same students improved more than others
in the Behavior component (Table 1.3). Of the teachers that had Master’s degrees, most
Student attributes
Our results support hypothesis 4 in terms of ethnicity and age but are mixed with
regards to student gender. Girls pretested lower than boys in Knowledge but higher in Affect
and Cognitive Skills (Table 1.2), although they improved more than boys in Knowledge
(Table 1.3). Older students performed the same as younger students in the pretest (Table 1.2)
and improved less than younger ones in Behavior and Overall scores (Table 1.3, Figure 1.1).
Minority students fell behind in several components of EL. Native American students
pretested lower than white students in the Knowledge and Cognitive Skills components as
well as Overall (Table 1.2, Figure 1.1) and improved more slowly than white students in
Cognitive Skills during the semester (Table 1.3). Hispanic students followed the same pretest
patterns as Native American students (Table 1.2, Figure 1.1), but improved as much as white
students over the course of this study (Table 1.3). Black students entered the study behind
white students in the same areas as Native American and Hispanic students (Table 1.2,
Figure 1.1), however, they improved more slowly than white students in all three of these
areas (Table 1.3). Students self-identifying as black compared to white was the most
important negative predictor in Knowledge, Cognitive Skills, and Overall EL in terms of
significance and magnitude (Table 1.3, Figure 1.1).
in the pretest of Affect (Beta = 3.639, p = 0.012) and Behavior (Beta = 4.893, p = 0.016).
Additionally, the interaction term between time outdoors and black ethnicity approached
significance at the alpha = 0.05 level (Beta = 1.412, p = 0.099) for the Behavior pretest.
These findings suggest that time outdoors may impact some components of EL more for
Hispanic and black students than for white students. The main effect of time outdoors
approached significance (Beta = 0.667, p = 0.058) in the pretest Affect model with the
inclusion of the interaction terms, suggesting that although the relationship is stronger among
minority students, Affect scores are still positively associated with time outdoors among
white students. The time outdoors main effect was not significant in the pretest Behavior
scores, suggesting that time outdoors is positively related to Behavior scores among Hispanic
students but not significantly among white students. None of the interaction terms were
significant for the change in EL models.
School attributes
Discussion
EE and outdoor education
The surprising relationship, or lack thereof, between EL and school-wide EE
programs (hypothesis 1) may be explained by how EE programs are defined and
operationalized. The EE schools were drawn from a list of school-wide EE programs
maintained by the NC Office of Environmental Education. Although there are specific
qualifications listed on the website, teachers can register their own school based on a
personal assessment of their school’s EE program (NC Office of Environmental Education,
2011). The low percentage of teachers in EE schools as well as similar percentage of
teachers in control schools that stated their students participated in an EE program during the
study suggests attendance at an EE school had limited impact on whether a given student was
actually exposed to EE programming. Further, teachers may enroll their schools because
they perceive deficiencies in EE programming. This may explain why we found a negative
association between membership in the EE schools and pretest Affect and Behavior scores.
Ultimately, we suspect our findings related to attendance at EE schools have less to do with
the efficacy of school-wide EE programs than with how those programs are defined.
School-wide EE efforts may in fact be highly effective at building EL and other skills (Ernst, 2007;
State Education & Environment Roundtable [SEER], 2000), but our results suggest effective
evaluations of school-wide EE programs will need to account for what is happening in
individual classrooms.
suggest their use may improve EL. Use of EE curricula was the only variable that was
significantly linked to both higher pretest scores and improved Overall EL over the semester.
Most of this impact was in the Cognitive Skills component, which is not surprising as
guidelines for K-12 EE curricula emphasize ecological knowledge and awareness as well as
cognitive skill building (NAAEE, 2004). These skills focus on identifying and analyzing
complex issues as well as action planning and forming solutions. While many EE programs
are content-specific to wetlands (e.g., Project WET), wildlife (e.g., Project WILD), or forests
(e.g., Project Learning Tree) (Eick, Carrier, Perez, & Keasal, 2010), the fostering of
Cognitive Skills in all of these published EE curricula equip students to engage in and
respond to more complex issues including climate change, biodiversity loss, and water
quality problems. Studies through the State Education and Environment Roundtable suggest
Cognitive Skills built through EL improve academic achievement in reading, writing, math,
science, and social studies test scores (State Education & Environment Roundtable [SEER],
2000). Accordingly, use of published EE curricula may be an important tool for improving
student achievement in key academic areas beyond EL.
Behavior scores. As improvement in attitudes is generally linked to pro-environmental
behavior (Guagnano, Stern, & Dietz, 1995; Poortinga, Steg, & Vlek, 2004), our data may
show that time outdoors fosters pro-environmental attitudes and higher levels of
environmental sensitivity which over time leads to more environmentally friendly behavior.
Time outdoors also correlated with higher pretest scores in the Knowledge component. Time
outdoors can improve student attention in children (Taylor & Kuo, 2009) and is linked to
elevated creativity and improved problem solving skills in adults (Atchley, Strayer, &
Atchley, 2012), which may explain why contact with nature may improve the more purely
academic areas of EL (i.e., Knowledge). Because time outdoors was positively correlated
with all areas except Cognitive Skills, use of published EE curriculum and time outdoors
together represent a potentially powerful strategy for increasing EL. Our results add to the
growing chorus of support for taking kids outside by suggesting outdoor education can
promote EL in addition to social (Burdette & Whitaker, 2006), mental (Wells & Evans,
2003), and physical health (Potwarka, Kaczynski, & Flack, 2008).
Teacher development
Teacher development may be more important than curriculum in terms of predicting
EL and may influence EL faster than curriculum. Further, the benefits of teacher
development (having a Master’s and 3–5 years of experience) appear to have been largely
expressed in the pretest after only one semester of the course. The recent focus on teacher
effectiveness in education reform has resulted in numerous studies on how teacher
education seem to have little or inconsistent effect on overall student performance
(Goldharber, 2002), although subject-specific degrees (e.g. a MS in Biology for science
teachers) do seem to have significant impact in Math and Science (Goldhaber & Brewer,
1996). As most (75%) of the advanced degrees among the teachers in our study are in
education or science education, it appears that our results may conflict with those suggesting
training in education does not impact student learning (Rockoff, 2004). Our results suggest
that a strong background in pedagogical theory and technique is associated with improved
student EL.
this finding parallels research related to teacher experience and other areas of student
achievement, perhaps the similar factors of on-the-job training and attrition affect EL. With
respect to the pretest of Behavior and change in Affect scores, however, teachers with more
than 5 years of experience had students that underperformed those with new teachers. One
explanation may be related to loss of idealism and increasing burnout associated with more
years of teaching experience (Schamer & Jackson, 1996). Several studies have suggested
inadequate administrative support poses a barrier to inclusion of EE (Ernst, 2009) and may
contribute to waning enthusiasm and commitment to EE among teachers. Teachers can
become increasingly discouraged when not given support to expand use of EE through
training or curriculum development (May, 2000). Efforts to promote teacher enthusiasm
among veteran EE teachers may be just as important as similar efforts in other disciplines
(Rosenholtz, 2008), despite the enthusiasm demonstrated by many EE teachers.
Student attributes
wane in their interest in science and math in the middle school years (Fouad & Smith, 1996),
which could also explain the slower rate of EL improvement among eighth graders. These
findings suggest middle school grades may include an age related tipping point where EE
efforts start becoming less effective in promoting EL. We are not arguing that older students
cannot benefit from these efforts; rather younger students may have the greatest capacity for
learning. Further, the most readily available EE curricula may be more effective for 6
thgrade
students than 8
thgrade students.
Knowledge to use. This strategy could be particularly effective in problem-based group
work simulating environmental decision-making.
Ethnicity related differences in EL seem to mirror general education trends; however,
the implications may be more complex in EL contexts. Much attention has been paid to
achievement gaps between minority students and white students in education literature, and
most studies find that individual and school level socio-economic status (SES) are
confounded with ethnicity (Alexander, Entwisle, & Olson, 2001; Freyer Jr. & Levitt, 2004;
Kao & Thompson, 2003). These scholars suggest achievement differences are more an issue
of poverty than culture. We controlled for school level SES (Title I status), but the
differences in EL scores predicted by ethnicity may be at least partially explained by
individual SES data. Other explanations for these achievement gaps range from how views
of schooling fit into cultural narratives (Ogbu & Simons, 1998) to how teacher expectation
bias affects student performance (Boer, Bosker, Werf, de Boer, & van der Werf, 2010).
availability of natural areas among minority children offers another explanation for the
disparities in EL shown in our results (Strife & Downey, 2009). If minority students are
exposed to the outdoors less than white students, it would follow that in-school outdoor
experiences could have more impact on EL among minority students. Outdoor experiences
and contact with nature can be particularly effective in closing gaps in environmental
attitudes and awareness associated with ethnicity (Larson, Castleberry, & Green, 2010). The
interaction between time outdoors and Hispanic and black students suggest that time
outdoors was particularly important in predicting the pretest of Affect and Behavior
components among Hispanics and the pretest of Affect among black students. Exposure to
nature could help mitigate EL gaps associated with ethnicity, at least among Hispanic and
black students. This relationship could be a fruitful area of future study, including the
amount, type, or quality of outdoor experience and its impact on EL levels of minority
students.
School attributes
that the link between income and environmental concern is fading and is context dependent
(Mainieri et al., 1997; Samdahl & Robertson, 1989), which may explain why we found no
difference in most EL components associated with SES. In addition to lower SES, bigger
class sizes are generally associated with lower academic performance (Darling-hammond,
1999; Schwarts, Schmitt, & Lose, 2012). Our results support this research with a weak
negative association between student-teacher ratios and the Knowledge pretest. The
relatively low importance of school attributes is encouraging, because curriculum and teacher
development are more easily changed than poverty, school types (e.g. charter vs. traditional)
or locales.
Conclusions
Achieving EL through K–12 education is a critical step to creating a public equipped
to meet and solve environmental challenges. This study highlights key ways to ensure
investments in EE promote EL and ultimately lead to a sustainable future. First, we suggest
using published EE curricula and time outdoors in tandem because taken together they foster
all four components of EL among middle school students. Published EE curricula including
Project WILD, Project WET, and Project Learning Tree were particularly effective at
building Cognitive Skills. Future research should address whether other curricular
efforts, advanced degrees and years teaching experience are as important in EE as they are in
other academic disciplines. EE efforts may improve if advanced degrees among teachers are
promoted and teachers are retained for longer periods. The stabilization or even decline in
teacher effectiveness after 5 years of experience highlights the need for training,
administrative, and structural support for teachers that maintains their enthusiasm and
commitment to EE over the long run. Gender based differences in EL appear to complement
one another (with each gender excelling in areas where the other does not), suggesting
teachers have synergistic opportunities to raise EL levels among both boys and girls. The
relationship between ethnicity and EL reveal that although time outdoors may be effective
for all students, it may be especially effective for engaging black and Hispanic students.
References
107th Congress. No Child Left Behind (NCLB) Act, Pub. L. No. Stat. 1425 (2002).
Agardy, T. (1994). Advances in marine conservation: The role of marine protected areas.
Trends in Ecology & Evolution
,
9
(7), 267–270.
Alexander, K. L., Entwisle, D. R., & Olson, L. S. (2001). Schools, Achievement, and
Inequality: A Seasonal Perspective.
Educational Evaluation and Policy Analysis
,
23
(2),
171–191.
Bickford, D., Posa, M. R. C., Qie, L., Campos-Arceiz, A., & Kudavidanage, E. P. (2012).
Science communication for biodiversity conservation.
Biological Conservation
,
151
(1),
74–76.
Bluhm, W. J., Hungerford, H. R., McBeth, W. C., & Volk, T. L. (1995). A final report on
development and pilot-testing of the “Middle School Environmental Literacy
Instrument.” In R. Wilke (Ed.),
Environmental Literacy/Needs Assessment Project:
Final Report
. Stevens Point, WI: University of Wisconsin, Stevens Point.
Blumstein, D. T., & Saylan, C. (2007). The failure of environmental education (and how we
can fix it).
PLoS Biology
,
5
(5), e120. doi:10.1371/journal.pbio.0050120
Boer, H. De, Bosker, R. J., Werf, M. P. C. Van Der, de Boer, H., & van der Werf, M. P. C.
(2010). Sustainability of teacher expectation bias effects on long-term student
performance.
Journal of Educational Psychology
,
102
(1), 168–179.
doi:10.1037/a0017289
Boyd, D., Grossman, P., Lankford, H., Loeb, S., & Wyckoff, J. (2008).
Teacher Attrition and
Student Achievement
(No. 23) (Vol. 2009). Retrieved from
http://www.urban.org/UploadedPDF/1001270_teacher_attrition.pdf
Bradley, J. C., Waliczek, T. M., & Zajicek, J. M. (1999). Relationship Between
Brezonik, P., & Cooper, W. (1994). Reauthorization of the Clean Water Act: Important
Issues for Water Quality Scientists.
Journal of Contemporary Water Research and
Education
,
94
(1), 47–51.
Burdette, H. L., & Whitaker, R. C. (2006). Resurrecting Free Play in Young Children:
Looking Beyond Fitness and Fatness to Attention, Affiliation, and Affect.
Archives of
Pediatrics
,
159
, 46–50.
Chawla, L. (1999). Life paths into effective environmental action.
The Journal of
Environmental Education
,
31
(1), 15–26.
Cheng, J. C.-H., & Monroe, M. C. (2010). Connection to Nature: Children’s Affective
Attitude Toward Nature.
Environment and Behavior
,
44
(1), 31–49.
doi:10.1177/0013916510385082
Cheng, J. C.-H., & Monroe, M. C. (2010). Connection to nature: Children’s affective attitude
toward nature.
Environment and Behavior
,
44
(1), 31–49.
doi:10.1177/0013916510385082
Clotfelter, C. T., Ladd, H. F., & Vigdor, J. L. (2007). Teacher credentials and student
achievement: Longitudinal analysis with student fixed effects.
Economics of Education
Review
,
26
(6), 673–682. doi:10.1016/j.econedurev.2007.10.002
Convention on Biological Diversity. (2010).
Global Biodiversity Outlook 3
(Vol. 47).
Montreal, Canada. doi:10.1002/mus.23551
Duerden, M. D., & Witt, P. A. (2010). The impact of direct and indirect experiences on the
development of environmental knowledge, attitudes, and behavior.
Journal of
Environmental Psychology
,
30
(4), 379–392. doi:10.1016/j.jenvp.2010.03.007
Dunlap, R. E., Liere, K. D. Van, Mertig, A. G., & Jones, R. E. (2000). Measuring
Endorsement of the New Ecological Paradigm: A Revised NEP Scale.
Journal of Social
Issues
,
56
(3), 425–442.
Eick, C. J., Carrier, S., Perez, K., & Keasal, D. E. (2010). Summer Methods in Summer
Camps: Teaching Projects WILD, WET, and Learning Tree at an Outdoor
Environmental Education Center. In A. M. Bodzin, B. Shiner Klein, & S. Weaver
(Eds.),
The Inclusion of Environmental Education in Science Teacher Education
(pp.
173–189). Dordrecht: Springer Netherlands. doi:10.1007/978-90-481-9222-9
Ernst, J. (2007). Factors Associated With K-12 Teachers’ Use of Environment-Based
Education.
The Journal of Environmental Education
,
38
(3), 15–32.
doi:10.3200/JOEE.38.3.15-32
Ernst, J. (2009). Influences on US middle school teachers’ use of environment
‐
based
education.
Environmental Education Research
,
15
(1), 71–92.
doi:10.1080/13504620802710599
Fouad, N. A., & Smith, P. L. (1996). A test of a social cognitive model for middle school
students: Math and science.
Journal of Counseling Psychology
,
43
(3), 338–346.
doi:10.1037//0022-0167.43.3.338
Freyer Jr., R. G., & Levitt, S. D. (2004). Understanding the Black-White Test Score Gap in
the First Two Years of School.
The Review of Economics and Statistics
,
86
(May), 447–
464.
Gamba, R. J., & Oskamp, S. (1994). Factors Influencing Community Residents’ Participation
in Commingled Curbside Recycling Programs.
Environment and Behavior
,
26
(5), 587–
612. doi:10.1177/0013916594265001
Goldhaber, D. D., & Brewer, D. J. (1996). Evaluating the Effect of Teacher Degree Level on
Educational Performance.
Developments in School Finance
, 197–210.
Goldharber, D. (2002). The Mystery of Good Teaching.
Education Next
,
2
(1), 50–55.
Gorey, K. M. (2001). Early Childhood Education: A Meta-Analytic Affirmation of the Short-
and Long-Term Benefits of Educational Opportunity.
School Psychology Quarterly
,
16
(1), 9–30.
Guagnano, G. A., Stern, P. C., & Dietz, T. (1995). Influences on Attitude-Behavior
Relationships: A Natural Experiment with Curbside Recycling.
Environment and
Behavior
,
27
(5), 699–718. doi:10.1177/0013916595275005
Henry, G. T., Bastian, K. C., & Fortner, C. K. (2011). Stayers and Leavers: Early-Career
Teacher Effectiveness and Attrition.
Educational Researcher
,
40
(6), 271–280.
doi:10.3102/0013189X11419042
Hines, J. M., Hungerford, H. R., & Tomera, A. N. (1987). Analysis and Synthesis of
Research on Responsible Environmental Behavor: a Meta-Analysis.
The Journal of
Environmental Education
,
18
(2), 1–8.
Hollweg, K. S., Taylor, J., Bybee, R. W., Marcinkowski, T. J., McBeth, W. C., & Zoido, P.
(2011).
Developing a Framework for Assessing Environmental Literacy
.
Environmental
Education
. Washington, DC: NAAEE. Retrieved from http://www.naaee.net
Hungerford, H. R., & Volk, T. (1990). Changing Learner Behavior through Environmental
Education.
The Journal of Environmental Education
,
21
(3), 8–21.
Kao, G., & Thompson, J. S. (2003). Racial and ethnic stratification in educational
achievement and attainment.
Annual Review of Sociology
,
29
(1), 417–442.
doi:10.1146/annurev.soc.29.010202.100019
Karsh, K., Bush, E., Hinson, J., & Blanchard, P. (2009). Integrating Horticulture Biology and
Environmental Coastal Issues into the Middle School Science Curriculum.
HortTechnology
,
19
(4), 813–817.
Keene, M., & Blumstein, D. T. (2010). Environmental education: a time of change, a time for
change.
Evaluation and Program Planning
,
33
(2), 201–4.
Larson, L. R., Castleberry, S. B., & Green, G. T. (2010). Effects of an Environmental
Education Program on the Environmental Orientations of Children from Different
Gender, Age, and Ethnic Groups.
Journal of Park and Recreation Administration
,
28
(3),
95–113.
Leeming, F. C., Dwyer, W. O., & Bracken, B. A. (1995). Children’s environmental attitude
and knowledge scale: Construction and validation.
The Journal of Environmental
Education
,
26
(3), 22–31.
Lisowski, M., & Disinger, J. F. (1991). The Effect of Field-Based Instruction on Student
Understandings of Ecological Concepts.
The Journal of Environmental Education
,
23
(1), 19–23.
Liu, J., Li, S., Ouyang, Z., Tam, C., & Chen, X. (2008). Ecological and socioeconomic
effects of China’s policies for ecosystem services.
Proceedings of the National Academy
of Sciences of the United States
,
105
(28), 9477–9482.
Ma, X. (2008). Within-School Gender Gaps in Reading, Mathematics, and Science Literacy.
Comparative Education Review
,
52
(3), 437–460.
Mainieri, T., Barnett, E. G., Valdero, T. R., Unipan, J. B., Oskamp, S., & Trisha, R. (1997).
Green Buying: The Influence of Environmental Concern on Consumer Behavior.
The
Journal of Social Psychology
,
132
(2), 189–204. doi:10.1080/00224549709595430
Maloney, M., Ward, M., & Braucht, G. (1975). A revised scale for the measurement of
Marcinkowski, T. J., & Rehrig, L. (1995). The Secondary School Report: A Final Report on
the Development, Pilot Testing, Validation, and field Testing of the Secondary School
Environmental Literacy Assessment Instrument. In R. Wilke (Ed.),
Environmental
Education Literacy/Needs Assessment Project: Assessing Environmental Literacy of
Students and Environmental Education Needs of Teachers; Final Report for 1993-1995
(pp. 30–70). Stevens Point, WI: University of Wisconsin, Stevens Point.
May, T. S. (2000). Elements of Success in Environmental Education Through Practitioner
Eyes.
The Journal of Environmental Education
,
31
(3), 4–11.
McBeth, B., Hungerford, H., Marcinkowski, T., Volk, T., & Cifranick, K. (2011).
National
environmental literacy assessment, phase two: Measuring the effectiveness of North
American environmental education programs with respect to the parameters of
environmental literacy. Final Report
. Retrieved from
http://www.naaee.net/sites/default/files/programs/research/NELA_Phase_II_Report.pdf
McBeth, B., Hungerford, H., Marcinkowski, T., Volk, T., & Meyers, R. (2008).
National
Environmental Literacy Assessment Project: Year 1, national baseline study of middle
grades students. Final report
. Retrieved from
http://www.epa.gov/education/pdf/MASTERNELA_Year1Report_081208_.pdf
NAAEE. (2004).
Environmental Education Materials: Guidelines for Excellence
.
Washington, DC.
NC Office of Environmental Education. (2011). EE School Guidelines. Retrieved October
30, 2012, from
http://web.eenorthcarolina.org/net/org/add.aspx?tid=38000&glid=54764&s=0.0.0.37430
Neathery, M. F. (1997). Elementary and secondary students’ perceptions toward science:
correlations with gender, ethnicity, ability, grade, and science achievement.
Electronic
Journal of Science Education
,
2
(1). Retrieved from
http://ejse.southwestern.edu/article/view/7573/5340
Ogbu, J. U., & Simons, H. D. (1998). Voluntary and involuntary minorities: A
cultural-ecological theory of school performance with some implications for education.
Anthropology and Education Quarterly
,
29
(2), 155–188. doi:10.1525/aeq.1998.29.2.155
Osborne, J. W. (2001). Testing Stereotype Threat: Does Anxiety Explain Race and Sex
Differences in Achievement?
Contemporary Educational Psychology
,
26
(3), 291–310.
doi:10.1006/ceps.2000.1052
Palmer, J. A. (1998).
Environmental Education in the 21st century: Theory, practice,
progress and promise.
Routledge.
Palmer, J. A. (1999). Research Matters: a call for the application of empiracal evidence to the
task of improving the quality and impact of environmental education.
Cambridge
Journal of Education
,
29
(3), 379–395.
Potwarka, L. R., Kaczynski, A. T., & Flack, A. L. (2008). Places to Play: Association of Park
Space and Facilities with Healthy Weight Status among Children.
Journal of
Community Health
. doi:10.1007/s10900-008-9104-x
Rickinson, M. (2001). Learners and Learning in Environmental Education: a critical review
of the evidence.
Environmental Education Research
,
7
(3), 207–320.
doi:10.1080/1350462012006523
Rockoff, J. E. (2004). Childhood development and acces to nature: A new direction for
environmental inequality research.
The American Economic Review
,
94
(2), 247–252.
Rosenholtz, S. J. (2008). Effective Schools: Interpreting the Evidence.
American Journal of
Education
,
93
(3), 352–388.
Samdahl, D. M., & Robertson, R. (1989). Social Determinants of Environmental Concern:
Specification and Test of the Model.
Environment and Behavior
,
21
(1), 57–81.
doi:10.1177/0013916589211004
Schamer, L., & Jackson, M. (1996). Coping with Stress: Common Sense about Teacher
Burnout.
Education Canada
,
36
(2), 28–31.
Schreurs, M. A. (2012). Breaking the impasse in the international climate negotiations: The
potential of green technologies.
Energy Policy
,
48
(1), 5–12.
doi:10.1016/j.enpol.2012.04.044
Shores, K. a., Scott, D., & Floyd, M. F. (2007). Constraints to Outdoor Recreation: A
Multiple Hierarchy Stratification Perspective.
Leisure Sciences
,
29
(3), 227–246.
doi:10.1080/01490400701257948
Skelly, S. M., & Zajicek, J. M. (1998). The effect of an interdisciplinary garden program on
the environmental attitudes of elementary school students.
HortTechnology
,
8
(4), 579–
583.
State Education & Environment Roundtable [SEER]. (2000).
The effects of
environment-based education on student achievement
. San Diego, CA. Retrieved from
http://www.seer.org/pages/research/educeff.pdf
Stern, P. C. (2000). Toward a Coherent Theory of Environmentally Significant Behavior.
Journal of Social Issues
,
56
(3), 407–424.
Stern, P. C., Dietz, T., & Kalof, L. (1993). Value Orientations, Gender, and Environmental
Concern.
Environment and Behavior
,
25
(5), 322–348. doi:10.1177/0013916593255002
Stock, J. H., & Watson, M. W. (2007).
Introduction to Econometrics
(2nd ed., p. 796).
Boston: Person Eduction, Inc.
Straughan, R. D., & Roberts, J. A. (1999). Environmental segmentation alternatives: a look at
green consumer behavior in the new millennium.
Journal of Consumer Marketing
,
16
(6), 558–575. doi:10.1108/07363769910297506
Strife, S., & Downey, L. (2009). Childhood Development and Access to Nature.
Taylor, A. F., & Kuo, F. E. (2009). Children with attention deficits concentrate better after
walk in the park.
Journal of Attention Disorders
,
12
(5), 402–9.
doi:10.1177/1087054708323000
The Pew Research Center for the People & the Press. (2011).
More Moderate Republicans
See Evidence of Warming
. Washington, DC.
Tobler, C., Visschers, V. H. M., & Siegrist, M. (2012). Consumers’ knowledge about climate
change.
Climatic Change
,
114
(2), 189–209. doi:10.1007/s10584-011-0393-1
Wells, N. M., & Evans, G. W. (2003). Nearby Nature: A Buffer of Life Stress Among Rural
Children.
Environment and Behavior
,
35
, 311–330. doi:10.1177/0013916503251445
Zelezny, L. C., Chua, P.-P., & Aldrich, C. (2000). Elaborating on Gender Differences in
abcde
a
Used published environmental education curriculum (No = 0, Yes = 1)
b
Spent time in outdoors during class time (No = 0, Yes = 1)
c
Teacher holds Masters degree (No = 0, Yes = 1).
d
Reference group is teachers with 0-2 years teaching experience (0-2 years = 0, 3-5 years =1, 6-8 years = 2, 9-11 years =3, 12 or more years =4)
e
Reference group for student ethnicity is white students.