BRUCE B SEISMIC PROBABILISTIC RISK ASSESSMENT
Kevin Hwang1, Wen H. Tong2, Eliseo Chan3, and Amitabh Dar4
1
Senior Staff, Simpson Gumpertz & Heger, Newport Beach, CA, USA ([email protected]) 2
Associate Principal, Simpson Gumpertz & Heger, Newport Beach, CA, USA 3
Section Manager, Risk and Severe Accident Analysis, Nuclear Safety Analysis and Support Department, Bruce Power, Toronto, Ontario, Canada
4
Technical Advisor, Bruce Power, Toronto, Ontario, Canada
ABSTRACT
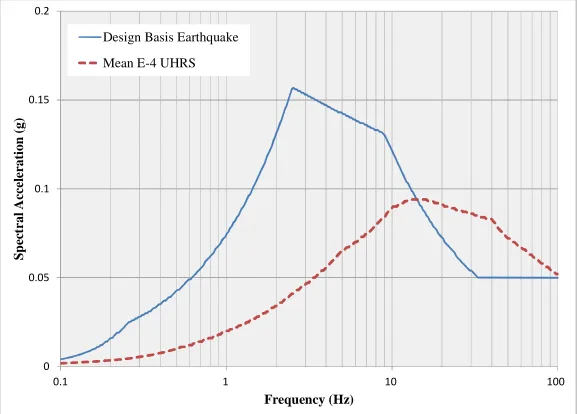
A site-specific probabilistic seismic hazard analysis (PSHA) was performed in 2011 for the Bruce B Nuclear Generating Station site in Ontario, Canada (AMEC, 2011). The generated site-specific mean uniform hazard response spectra (UHRS) with an annual frequency of exceedance of 1E-4 at the top of the sedimentary rock has significant energy content in the high frequency range, as shown in Figure 1. This latest site-specific seismic hazard is considered for the Bruce B seismic probabilistic risk assessment (PRA). A Motor Control Center (MCC) located at EL. 601 feet in the Bruce B Reactor Building was selected for this study among other safety-related equipment, and its functional capacity was evaluated by means of the Conservative Deterministic Failure Margin (CDFM) method outlined in EPRI NP-6041-SL (1991). Once the High Confidence of Low Probability of Failure (HCLPF) capacity of the MCC is calculated, the median capacity is computed by assuming a conservative variability to determine the seismic fragility. For the purpose of comparison, the same MCC is evaluated using the Fragility Analysis (FA) method in accordance with EPRI TR-103959 (1994), including updates in EPRI 1019200 (2009) with a further probabilistic simulation implemented on the UHRS seismic demand. With these best estimate UHRS seismic demands, the HCLPF capacity of the MCC is improved 11% for function during and 18% for function after the earthquake. Comparisons of the two seismic fragility curves are given for function after the earthquake, in the conclusion.
Figure 1. 2011 UHRS vs. DBE Horizontal Free-Field Surface Response Spectra (5% Damping) 0
0.05 0.1 0.15 0.2
0.1 1 10 100
S
p
ec
tra
l
A
ccel
era
ti
o
n
(g
)
Frequency (Hz)
INTRODUCTION
The Bruce B Nuclear Generating Station was seismically designed against a design basis earthquake (DBE) that has a peak ground acceleration (PGA) of 0.05g. Canadian Nuclear Safety Commission (CNSC) Regulatory Standard S-294 (2005) requires a PRA for both internal and external events, including seismic events. In 2011, a site-specific probabilistic seismic hazard analysis (PSHA) was performed for the Bruce site (AMEC, 2011). The generated site-specific mean uniform hazard response spectra (UHRS) with an annual frequency of exceedance of 1E-4 at the top of the sedimentary rock has significant energy content in the high frequency range as shown in Figure 1, similar to that observed for sites in Central and Eastern U.S. and to the east north American (ENA) spectrum in Canada (Atkinson, 2007). This latest site-specific seismic hazard is considered for the Bruce B seismic PRA.
Bruce Power chose to use a phased approach to address seismic risks. The idea behind the phased approach is to systematically identify and address the key risk contributors in a focused manner. An initial phase (Phase 0) was conducted to assess the quality and availability of plant information, to perform an initial walkdown with focus on key station-specific features that may influence station capability with respect to seismic events, and to formulate a preliminary identification of the likely risk contributors based on the available information and the station walkdown. A probabilistic risk assessment-based seismic margin (PRA-Based Seismic Margin Assessment) method was employed in Phase 1 to determine seismic fragilities of structures, systems, and components (SSCs) that are included in the seismic models for assessing seismic risk of the station. In Phase I, the seismic walkdown was performed to screen out equipment that is seismically rugged. The screening level was selected to be high enough such that the screened-out SSCs would not affect seismic risk of the plant. HCLPF seismic capacities of the screened-in SSCs were computed by means of the Conservative Deterministic Failure Margin (CDFM) method outlined in EPRI NP-6041 (EPRI, 1991). Median seismic capacities of these screened-in SSCs are estimated using the HCLPF capacities and a generic composite variability of 0.4. A high level estimate of the severe core damage frequency (SCDF) is then calculated as a product of Phase 1. In Phase 2, new seismic response analyses with the UHRS as input were performed for safety-related building structures housing the risk contributors identified in Phase 1 in order to compute best estimate seismic demands. With these best estimate UHRS seismic demands, refinements of seismic fragilities of the risk contributors will be performed using the Fragility Analysis (FA) method approximated by the Separation-of-Variables (SOV) method in accordance with EPRI TR-103959 (EPRI, 1994), including updates in EPRI 1019200 (EPRI 2009).
A Motor Control Center (MCC) located at EL. 601 feet in the Bruce B Reactor Building was selected as a test case for this study among other safety-related equipment. The MCC is about 91 inches tall and 19 inches deep, and is one of the key elements to bring the plant to safe shutdown condition. The HCLPF capacity of the MCC was calculated by CDFM method and then converted to seismic fragility using a generic composite variability of 0.4 (Kennedy, 1999). Seismic fragility of the MCC was also calculated by FA method with further refinement on the UHRS seismic demand. Lastly the CDFM-based seismic fragility was compared to the FA-based seismic fragilities.
EQUIPMENT SEISMIC QUALIFICATION
Equation (1) with a time interval of 0.005 sec. Figure 2 shows a plot of the sine sweep wave at a sweep rate of 2 octaves per minute for amax= 0.2g.
ܶܪ =ܽ ௫
× sin
2ߨቆ ଶ(ೌೡలబ ×) ೌೡ
లబ ×୪୭(ଶ)ቇ
(1)
Figure 2. Time History of Sine Sweep Waveform
Since both CDFM and FA methods require comparison of UHS in-structure response spectra (ISRS) to test response spectra (TRS) to determine seismic fragility, the input time history is converted to response spectra by a numerical method, the so-called “recurrence formulas,” originally developed by Nigam and Jennings (1969). Figure 3 demonstrates that the MCC specimen was tested over the frequency range of 2.5 to 36 Hz and the TRS envelope the UHS ISRS for all three directions.
Figure 3. Comparison of TRS and UHS ISRS at 5% Damping -0.2
-0.1 0 0.1 0.2
0 2 4 6 8 10 12 14 16
A
cc
el
er
at
io
n
(g
)
Time (sec)
0 0.5 1 1.5 2
1 10 100
S
p
e
ct
r
a
l
A
c
ce
le
r
a
ti
o
n
(g
)
Frequency (Hz)
TRS
Enveloped ISRS (E-W)
AverageISRS (E-W)
Enveloped ISRS (N-S)
Average ISRS (N-S)
Enveloped ISRS (V)
SEISMIC DEMANDS
UHS ISRS applicable to the MCC were generated by soil-structure interaction (SSI) analyses taking ground motion incoherence into account (Kinectrics, 2010). The input ground response spectra used for the SSI analysis was 2011 mean 10-4 UHRS anchored to 0.05g at EL. 571 feet, as shown in Figure 1. The SSI response analyses were performed using best estimate, lower bound, and upper bound soil properties. Averages of the response spectra from the three soil cases are considered median centered and are used for seismic fragility analysis of the MCC. The ISRS from the three soil cases are also enveloped to get 84th percentile response that must be used in CDFM method for the MCC. The average ISRS at EL. 601 feet and the enveloped ISRS at the same elevation are given in Figure 3. It is apparent from the plots that the vertical response is dominant and controls seismic fragility of the MCC.
APPLICATION OF CDFM METHOD
The MCC is evaluated first using the CDFM method presented in EPRI report NP-6041-SL (1991). Seismic evaluation of a piece of equipment for function during and after an earthquake starts with a comparison of TRS achieved during the seismic qualification test and ISRS at the same damping value. The 5% damped enveloped ISRS are compared to the TRS in Fiure 3 to find a critical frequency where the ratio of TRS/ISRS is the lowest, which is about 10 Hz in the vertical direction. Once the critical frequency has been determined, a sine wave of the frequency is generated and converted to 5% damped TRS for its comparison to the vertical UHS ISRS at the critical frequency. The ISRS or TRS may have narrow peaks that must be clipped to establish effective broadband spectra. Appendix Q of EPRI NP-6041 (1991) provides a procedure for clipping of narrow banded TRS and ISRS.
ܤ= ∆బ.ఴ
(2)
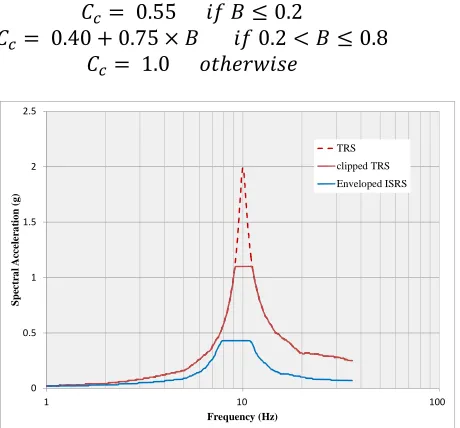
Bandwidth ratios are computed to be 0.08 for the TRS peak and 0.44 for the ISRS peak. The ISRS peak has a wider band width than the TRS, and hence the ISRS peak cannot be clipped. In CDFM, peak clipping should be done using the 84th percentile equation (see Equation (3)). Figure 4 shows a comparison of the original TRS, clipped TRS and the ISRS at 5% damping.
ܥ= 0.55݂݅ܤ≤ 0.2 (3)
ܥ= 0.40 + 0.75 ×ܤ݂݅0.2 <ܤ≤ 0.8
ܥ= 1.0ݐℎ݁ݎݓ݅ݏ݁
Figure 4. A Comparison of TRS and Enveloped ISRS at 5% Damping
0 0.5 1 1.5 2 2.5
1 10 100
S
p
ec
tr
a
l
Ac
c
e
le
ra
ti
o
n
(g
)
Frequency (Hz)
TRS
clipped TRS
The MCC specimen was tested by a single axis test, but in reality the MCCs will be subjected to multi-axis excitation under a seismic event. Thus a multi-axis to single axis correction must be made. EPRI NP-6041-SL (1991) recommends use of 1.2 as a reduction factor to account for this. The TRS must be divided by the appropriate knockdown factor, Fk, to obtain an approximately 99% exceedance level capacity. It is recommended in EPRI NP-6041-SL (1991) that a knock-down factor of 1.2 for function during and 1.0 for function after be used. Clipped TRS is computed using Equation (4). HCLPF capacity of the equipment qualified by equipment-based testing are calculated using Equation (5), and the corresponding median capacity is computed by Equation (6) with a conservative variability of 0.4. These equations are given in EPRI NP-6041-SL (1991).
ܴܶܵ= ቀ்ோௌಷೖ ಷ ೞቁ
(4)
ܪܥܮܲܨ= ்ோௌ
ோோௌ×ܲܩܣ (5)
ܣ =ܪܥܮܲܨ×݁ଶ.ଷଷ×ఉ (6)
ߚ= ටߚோଶ+ߚଶ (7)
where,
ܴܶܵ:Clipped test response spectra ܴܴܵ:Clipped required response spectra
ܥ:Clipping factor for required response spectrum ܨ:Knock-down factor
ܨ ௦:Multi-axis to single axis correction factor
PGA = Peak ground acceleration
The three seismic parameters and its HCLPF capacity are summarized in Table 2 for a comparison to the FA-based seismic fragility.
APPLICATION OF SEISMIC FRAGILITY METHOD
Capacity Spectrum
The same MCC is evaluated using the FA method presented in EPRI report TR-103959 (1994). The 5% damped average ISRS in the vertical direction is compared to the TRS in Figure 3 to find a critical frequency where the ratio of TRS/ISRS has a minimum value (about 9 Hz). A sine wave of this frequency is generated and converted to 5% damped TRS for its comparison to the vertical UHS ISRS at the critical frequency. In FA, peak clipping should be done using median equations, as shown in Equation (8). Uncertainties associated with the median clipping factor are given in Equation (9)
ܥ= 0.30 + 0.86 ×ܤ= 0.37݂݅ܤ≤ 0.4 (8)
ܥ= 0.50 + 0.36 ×ܤ݂݅ܤ> 0.4
ߚ = 0.37 − 0.50 ×ܤ݂݅ܤ≤ 0.4 (9)
ߚ = 0.24 − 0.17 ×ܤ݂݅ܤ> 0.4
where,
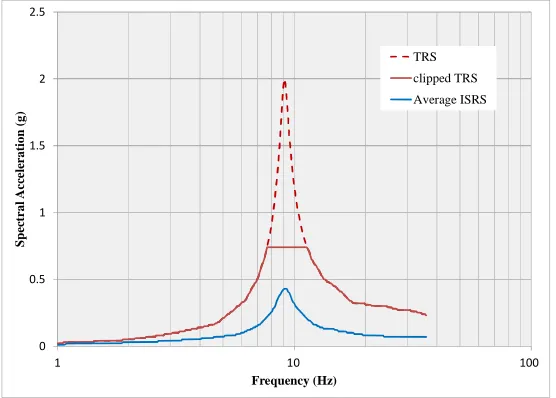
Bandwidth ratio is computed to be 0.08 for the TRS peak and 0.14 for the ISRS peak using Equation (1). The ISRS has a wider bandwidth than the TRS, and thus the ISRS peak cannot be clipped. Figure 5 shows a comparison of the original TRS, clipped TRS and the ISRS at 5% damping. There is no need to evaluate uncertainty associated with the clipping factor applied to the TRS since clipping the TRS always results in a conservative value.
Figure 5. A Comparison of TRS and Average ISRS at 5% Damping
Median Seismic Demand
Because of the wide bandwidth of ISRS, no peak clipping was made for the ISRS. However, as indicated in Figure 5, the spectral accelerations of the ISRS are significantly different above and below 9.07 Hz, and it is believed that the median spectral acceleration to the equipment would be less than the peak spectral acceleration – especially when such a reduction in the spectral ordinate is significant where spectral peak occurs. This median seismic demand can be obtained by a probabilistic simulation.
This probabilistic approach, called Latin Hypercube Simulation (LHS), starts with random generation of frequencies about the median frequency of 9.07 Hz to obtain a distribution of spectral acceleration values and fit a lognormal model to this distribution. The use of 0.1 and 0.15 for uncertainty on the equipment frequency and structure frequency, which affect seismic demand on the MCC, is recommended. To obtain N samples of a single random variable, the probability distribution for that variable is divided up into N equal probability regions using Equations (14) to (16).
݂=݂×݁௨×ఉ (14)
ݑ= Φିଵ(ܲ) (15)
ܲ= ିଵାௗே (ଵ) (16)
where,
) 1 (
rnd : Random number generating function,
n
f : Median natural frequency,
0 0.5 1 1.5 2 2.5
1 10 100
S
p
ec
tr
a
l
A
cc
el
er
a
ti
o
n
(g
)
Frequency (Hz)
i
u
: Standardized normal variable,
f
: Combined variability on frequency of concrete structure and typical electric cabinet,
N: Total number of samples.
The probability that the spectral acceleration will be equal or less than the value selected is expressed by Equation (17) when assuming that the spectral acceleration distribution is lognormal.
u i i a S Sa P ) ˆ ln( (17)
Inverse Gaussian operation of the equation transforms the equation into the following linear
equation (see Equation (18)). The transformed data,
Pi1
and ln
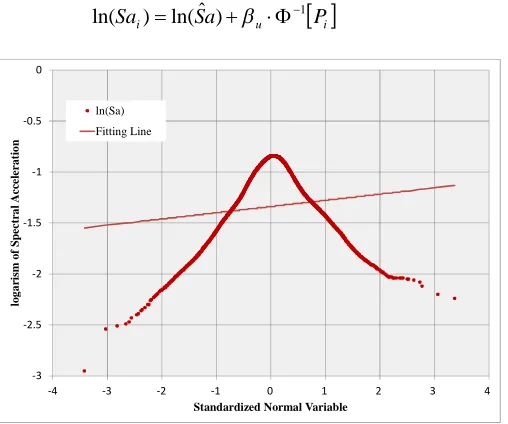
Sai are plotted for the sample valuesin Figure 6.
i ui Sa P
Sa) ln(ˆ ) 1
ln( (18)
Figure 6. Curve Fitting
The slope of the regression line is the logarithmic standard deviation on uncertainty, U , and the
exponential of the intercept of the line is the median spectral acceleration value. The peak spectral acceleration of the ISRS is 0.43g at 9.07 Hz, while the median spectral acceleration at the same frequency is 0.26g with uncertainty of 0.06, such that the demand reduction factor is computed to be 0.61 by taking a ratio of the median spectral acceleration to the peak value of the ISRS. This demand reduction factor is significantly lower than the values of 0.92 given in EPRI TR-103959 (1994).
Listed in the table below are factors of safety and the associated varaibilities of the other variables, such as capacity increase factor, broad-frequency-input spectrum device capacity factors recommend in EPRI TR-103959 (1994), and a structural response factor. No specific evaluation was done for a structural response factor of the building structure in this study. Instead, a structural response factor and the associated variability computed for a similar structure founded on similar site condition are
-3 -2.5 -2 -1.5 -1 -0.5 0
-4 -3 -2 -1 0 1 2 3 4
lo g a ri sm o f S p e c tr a l A c ce le r a ti o n
Standardized Normal Variable ln(Sa)
used to determine the seismic fragility of the MCC. Table 1 shows the relevant factors and variabilities for the various variables.
Table 1. Seismic Fragility Variables, Factors and Variability
Median clipped TRS and the resulting HCLPF capacity of the equipment qualified by equipment-based testing are calculated using the equations given in EPRI TR-103959 (1994) and reproduced below:
ܴܶܵ=ܴܶܵ×ܥ்×ܥூ (10)
ܴܴܵ=ܴܴܵ×ܥ×ܦோ (11)
ܣ = ்ோௌோோௌ×ܨ×ܨோௌ×ܲܩܣ (12)
HCLPF=ܣ ×݁ିଵ.ହ×(ఉೃାఉೆ) (13)
where,
ܥ்: Clipping factor for TRS (test response spectrum), ܥூ: Capacity increase factor,
ܦோ: Demand reduction factor,
ܨ: Conversion-to-median factor (strength factor above TRS).
Table 2 presents comparison of the three fragility parameters (median acceleration, randomness, and uncertainty) and the HCLPF capacities calculated by CDFM and FA methods.
Table 2. Comparison of Seismic Fragilities by CDFM and FA Methods
Variables Factor Randomness Uncertainty
Demand reduction 0.61 0.00 0.04
Capacity increase 1.10 0.00 0.05
Device capacity for funtion during 1.40 0.09 0.22
Device capacity for funtion after 1.95 0.09 0.28
Structure response 1.00 0.15 0.16
Total 1.83 0.20 0.40
Failure
Mode Method Am ĬR ĬU HCLPF
CDFM 0.22 0.24 0.32 0.09
FA 0.22 0.17 0.28 0.10
FA/CDFM 1.00 0.71 0.88 1.11
CDFM 0.27 0.24 0.32 0.11
FA 0.3 0.17 0.33 0.13
FA/CDFM 1.11 0.71 1.03 1.18
Function During
NOMENCLATURE
ܴܶܵ:Clipped test response spectra, ܴܴܵ:Clipped required response spectra,
ܥ:Clipping factor for required response spectrum, ܨ:Knock-down factor,
ܨ ௦:Multi-axis to single axis correction factor,
PGA = Peak ground acceleration,
ߚ: Uncertainty on clipping factor,
) 1 (
rnd : Random number generating function,
n
f : Median natural frequency,
i
u
: Standardized normal variable,
f
: Combined variability on frequency of concrete structure and typical electric cabinet,
N: Total number of samples,
ܥ்: Clipping factor for TRS (test response spectrum),
ܨ: Conversion-to-median factor (strength factor above TRS), ܦோ: Demand reduction factor,
ܥூ: Capacity increase factor
CONCLUSION
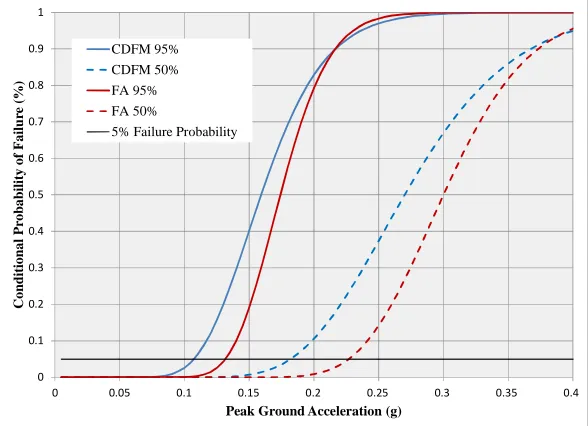
Figure 7 demonstrates that an FA-based seismic fragility could result in a lower value, i.e. less fragile, than a CDFM-based seismic fragility. The FA-based seismic fragility was developed through a probabilistic simulation on the UHRS seismic demand. The blue curves indicate the seismic fragility of the MCC developed by the CDFM approach, while the red curves indicate the seismic fragility developed by the FA approach. The solid curves represent the median, whereas the dotted curves represent the fragility curve with a level of 95% confidence. As indicated in the plot, the FA-based fragility has been improved significantly; the HCLPF capacity of the MCC is improved 11% for function during and 18% for function after the earthquake when comparing them with the CDFM-based fragility.
Figure 7. Seismic Fragility Curves of CDFM vs. FA Method
0 0.1 0.2 0.3 0.4 0.5 0.6 0.7 0.8 0.9 1
0 0.05 0.1 0.15 0.2 0.25 0.3 0.35 0.4
C
o
n
d
it
io
n
a
l
P
ro
b
a
b
il
it
y
o
f
F
a
il
u
re
(%
)
Peak Ground Acceleration (g)
CDFM 95% CDFM 50% FA 95% FA 50%
ACKNOWLEDGEMENTS
The authors sincerely thank Ms. Joan Higgs and Mr. Rob McLean of Bruce Power for reviewing the transcript and providing their valuable comments.
REFERENCES
AMEC NSS Limited, 2011, Bruce Nuclear Generating Station Seismic Hazard Assessment, B1062/RP/001 R01, 2011.
Atkinson, G.M., and Elgohary, M., 2007, Typical Uniform Hazard Spectra for Eastern North American Sites at Low Probability Levels, Canadian Journal of Civil Engineering,34: 12-18.
Bruce Power, 1978, Document No. 78-95-K,Seismic Tests for Nuclear Generating Station Motor Control Center, 28 February 1978.
Canadian Nuclear Safety Commission, 2005, Probabilistic Safety Assessment (PSA) for Nuclear Power Plants, Regulatory Standard S-294, CNSC, April 2005.
Electric Power Research Institute, 1991, A Methodology for Assessment of Nuclear Power Plant Seismic Margin (Revision 1), NP-6041-SL, Final Report, EPRI, August 1991.
Electric Power Research Institute, 1994, Methodology for Developing Seismic Fragilities, TR-103959, June 1994.
Electric Power Research Institute, 2009,Seismic Fragility Applications Guide Update, Final Report No. 1019200, December 2009.
Kennedy, R.P, 1999, Overview of Methods for Seismic PRA and Margin Assessments Including Recent Innovations, Proceedings of the OECD-NEA Workshop on Seismic Risk, Tokyo, Japan, August 1999. Kinectrics, 2010, Report No. K-149943-REPT-0006,Darlington Nuclear Generating Station PRA-Based Seismic Margin Assessment Phase 1 - Seismic Response Characterization Report, Revision 1, 13 January 2010.