18th International Conference on Structural Mechanics in Reactor Technology (SMiRT 18) Beijing, China, August 7-12, 2005 SMiRT18-F07-3
A SIMPLIFIED TECHNIQUE FOR SHAKEDOWN LOAD
DETERMINATION
Hany F. Abdalla
Mechanical Design and Production
Department
Cairo University, Egypt
[email protected]
Dr. Maher Y. A. Younan
*Mechanical Engineering Department
The American University in Cairo, Egypt
Tel: (202) 797-5336, Fax: (202) 795-7565
[email protected]
Dr. Mohammed M. Megahed
Professor of Solid Mechanics
Mechanical Design and Production Department
Cairo University, Egypt
[email protected]
ABSTRACTIn this paper a simple technique is presented to determine the limit shakedown load of a structure or a component using the finite element method. Through the proposed technique, the limit shakedown load is determined without performing time consuming cyclic loading simulations or iterative elastic techniques. Instead, it is determined by performing only two analyses namely, an elastic analysis and an elastic-plastic analysis. By extracting the results of the two analyses, the limit shakedown load of the structure is determined through the calculation of the residual stresses. The technique is applied and verified using two bench mark shakedown problems namely: the two-bar structure subjected to constant axial force and cyclic thermal loading, and the Bree cylinder subjected to constant internal pressure and cyclic high heat fluxes across its wall. The results of the proposed technique showed very good correlation with the, analytically determined, Bree diagrams of both structures. Moreover, the outcomes of the proposed technique showed very good results in comparison to full cyclic loading elasto-plastic finite element simulations of both structures.
Keywords: shakedown, cyclic load, residual stress, Bree diagram, finite elements
NOMENCLATURE
A Cross-sectional area of bar-2
E Young’s modulus
L Length of bar-1
P Pressure
Q R
Tensile axial force
m
Elastic-plastic solution increment Cylinder mean radius
i
t Thickness
α Material thermal coefficient of expansion ν Poisson’s ratio
T
∆ Temperature drop across cylinder thickness τ
∆ Temperature variation imposed on bar-2 E
σ Stress output from elastic solution σE
Stress output from elastic-plastic solution σPLPL Hoop stress due to pressure
σr Residual stress
INTRODUCTION
Over the last three or four decades, researchers have focused their efforts on limit load analyses in order to determine the load carrying capacity a structure or a component can withstand prior to collapse. These efforts included analytical, experimental, and numerical analyses. Complementary to determining limit load, the safe operating region for a structure subjected to cyclic loading in the elastic-plastic domain, the shakedown domain, should be determined as well to avoid early failure due to ratchetting or reversed plasticity. However, due to the time consuming cyclic elasto-plastic finite element analyses and the high expenses of experimental setups, the determination of structural responses due to cyclic loading conditions are delayed compared with the achievements in limit load analyses.
Some researchers proposed iterative elastic techniques, implemented using the finite element method, in order to obtain a rapid and approximate limit and shakedown loads. The iterative elastic techniques begin with an initial elastic solution which is modified in an iterative manner, through a series of linear elastic finite element solutions, to redistribute stresses in the structure or component by changing the elastic modulii of elements. The iterations proceed until a useful equilibrium solution is met. However, with the growing computing powers currently witnessed the elasto-plastic analyses become easier than before, economical, and yield more precise solutions.
LITERATURE REVIEW
Despite the introduction of the shakedown theory by Melan in the late thirties (1938), active research in this area began in the mid-sixties. Most of the work accomplished aimed at determining the shakedown loads and working domains for cyclically loaded structures focusing on simple structures, pressure vessels, and components with severe geometrical discontinuities.
The Two-bar problem has been investigated by several researchers. Parkes (1964) studied the problem of thermal ratchetting in an aircraft wing resulting from the cyclic thermal stresses superimposed on the normal wing loads. The wing is simulated by a two-bar structure in which the temperature of one bar (representing the skin) is cycled between two temperature limits while the temperature of the other bar (representing the web) is kept constant at the lower temperature limit. Miller (1959) showed that the strains due to ratchetting in the two-bar structure are considerably reduced due to material strain hardening. Megahed (1981) presented an analytical solution for the two-bar structure and studied the influence of hardening rule on the elastic-plastic behavior of the two-two-bar structure. Jiang and Leckie (1992) presented a method for direct determination of the steady solutions in shakedown analysis with application to the two-bar problem.
The Bree cylinder problem has also received adequate investigation by many researchers. Bree (1967) analyzed the elastic-plastic behavior of a thin cylindrical tube subjected to constant internal pressure and cyclic temperature drop across the tube thickness. He used a simple one-dimensional model and assumed a linear temperature drop distribution across the tube thickness and an elastic-perfectly plastic material model. Later, Mulcahy (1974) used a linear kinematic hardening model. Megahed (1978) analyzed the same problem and used a bilinear temperature distribution and incorporated the effects due to creep and cyclic hardening. Zarka et al. (1978) obtained an analytical solution to determine shakedown loads for structures having a kinematic hardening behavior. Leckie and Ranaweera (1980) used a parabolic temperature distribution across the tube thickness and found a bound on the creep deformation.
THE PROPOSED TECHNIQUE
The proposed technique assumes elastic-perfectly-plastic material behavior and involves performing two analyses. The first is an elastic analysis performed only once and its output is stored. In reality, structures are simultaneously subjected to both constant and cyclic load types. In the present linear elastic analysis, only the cyclic load type is applied in an increasing ramp pattern such that the stresses developed in the structure do not exceed the material yield strength.
The second analysis is an elastic-plastic analysis which involves the application of both the constant and the cyclic load types. The constant load is linearly applied in the first analysis step and causes only elastic stresses in the structure. The cyclic load type is then applied in the second analysis step in an increasing ramp pattern and causes the structure stresses to exceed the material yield strength. Therefore, the elastic-plastic solution is obtained in several solution increments until the load is fully applied.
Performing the two analyses and using their outputs, the residual stress is calculated for every element in the structure at every solution increment as follows:
i i
i r ELPL E
ref
P
P
σ =σ −σ (1)
The term ( ) denotes the cyclic load magnitude at an increment ( ) in the elastic-plastic solution. The term ( ) denotes the cyclic load magnitude applied in the elastic solution which causes elastic stresses in the structure. Equation (1) determines the residual stress (
i
P i
ref
P
r
σ ) converted to the same load increment by subtracting the elastic stress (σE) from the stresses obtained from the elastic-plastic solution (σELPL) at every solution increment (i).
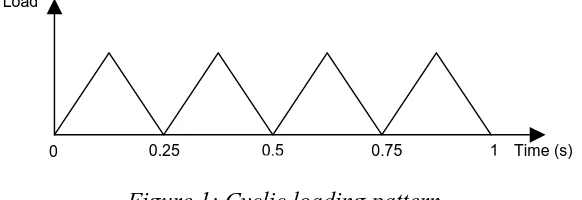
A MATLAB computer program is developed to read the output of the elastic and the elastic-plastic analyses and calculate the residual stresses using Eq. (1) for all elements at every elastic-plastic solution increment. The program outputs the loads corresponding to the solution increments at which the calculated residual stresses equals to or exceeds the material yield strength. The program then searches for the minimum of the output loads. This minimum load corresponds to a solution increment (i). Therefore the load corresponding to the solution increment (i ) is the limit shakedown load of the structure since its corresponding calculated residual stress is slightly less than the material yield strength. The output is accompanied with a corresponding list of elements satisfying the previous condition. The limit shakedown loads output by the proposed technique are used to perform full cyclic loading finite element simulations using the loading pattern consisting of four load cycles shown in Fig. 1. The full cyclic loading finite element simulations are performed to verify the proposed technique.
1 −
Load
0.25 0.5 0.75 1 Time (s)
0
Figure 1: Cyclic loading pattern
FINITE ELEMENT MODELING AND TECHNIQUE VERIFICATION
Two finite element models are presented namely; the two-bar structure model and the Bree cylinder model. The proposed technique is applied to both models and its output is compared to the analytically determined Bree diagrams of both structures. The general purpose non-linear finite element code ABAQUS/Standard version 6.4-1 is used in analyzing the two models considered.
The Two-Bar Model
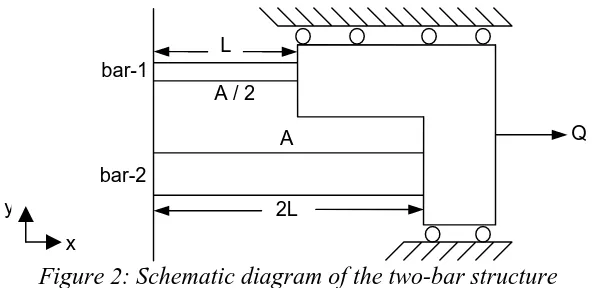
The Figure 2 shows a schematic of the two-bar structure considered. It consists of two parallel bars of cross-sectional areas (A) and (A 2) and lengths ( ) and ( ) as shown in Fig. 2. The two bars are fixed at their left ends and connected to a rigid body at their right ends as shown in Fig. 2. The rigid body is assumed to be weightless. A cyclic temperature variation is imposed on bar-2, while bar-1 remains at a constant temperature. The structure is subjected to a constant tensile axial load (Q) as shown in Fig. 2.
Figure 2: Schematic diagram of the two-bar structure
Each bar is meshed with one (T2D2T) truss element. The (T2D2T) is a 2-noded truss element with two integration points and performs coupled temperature-displacement analysis. The rigid body connected to the two bars is meshed with 2D rigid link elements (R2D2). Figure 3 shows the nodes and elements meshing the two bar structure considered.
x
L bar-1
A / 2
Q A
bar-2
y 2L
x
2 5
E1 E3
1
E4 Q
y 6
E5
E2 4
3
Figure 3: Meshing and loading of the two-bar structure
Elements 1 and 2 represent the meshing of bar-1 and bar-2 respectively using the (T2D2T) truss element type. Elements 3, 4, and 5 represent the meshing of the rigid links using the (R2D2) rigid link element type. An elastic-perfectly-plastic material behavior is assumed. Table 1 lists the geometric parameters and the material properties of the two-bar structure considered.
Table 1: Geometric parameters and material properties of the two-bar
structure
Area of bar-1 (mm2) 10
Area of bar-2 (mm2) 20 Length of bar-1 (mm) 100 Length of bar-2 (mm) 200
E (GPa) 210
α (oC−1) 11.7e-6
Y
σ (MPa) 200
ν 0.3
Concerning boundary conditions, nodes 1 and 3 are fixed in both the x- and y- directions. Nodes 2, 4, 5, and 6 are free to move in the x-direction and constrained from motion in the y-direction. The tensile force ( ) is applied on node 6 in the positive x-axis direction. Figure 4 shows the analytically determined Bree diagram of the two-bar structure where ( ) denotes elastic behavior, ( ) denotes shakedown, ( ) denotes reversed plasticity, and ( ) denotes ratchetting.
Q
T
∆
2
1
0
RP
z2 z1
R
3 z4 z
S
5 z
E
6 z
0 0.5 1.0 1.5 Q
Figure 4: The analytically determined Bree diagram of the two-bar structure
From Fig. 4, the normalized terms (Q) and (∆T) are expressed respectively as follows:
Y
Q Q
Aσ
= (2)
Y
E
T α τ
σ ∆
∆ = (3)
Applying the proposed technique, the elastic analysis, performed only once and stored, consists of one solution step where a temperature value of (40.7o ) is applied on bar-2 in an increasing ramp pattern. Bar-1 is kept at a constant temperature of (0 ). The (40.7 ) temperature corresponds to a (
C
o
C
o
C ∆ =T 0.5) on the Bree diagram shown in Fig. 4. The (40.7 ) temperature should cause only elastic stresses in the two-bar structure. No constant tensile axial force is applied.
o
C
The elastic-plastic analysis consists of two solution steps. The first step involves the application of the constant tensile axial force ( ) which causes only elastic stresses in the structure. The second step involves the application of temperature on bar-2 in an increasing ramp pattern. The applied temperature should cause the axial stress in bar-1 to exceed the material yield strength.
Q
The elastic solution is achieved in one solution increment while the elastic-plastic solution is obtained in several solution increments until the temperature is fully applied on bar-2. Therefore, the residual stress for each element, at every solution increment, is calculated using Eq. (1) and represented as follows:
i i
i r ELPL E
ref
T T
σ =σ −σ (4)
The term (T) denotes the cyclic temperature of bar-2 at an increment ( ) in the elastic-plastic solution. The term ( ) denotes the (40.7o ) temperature applied to bar-2 in the elastic solution which causes only elastic stresses in the two-bar structure.
i i
ref
T C
The proposed technique successfully determined the limit shakedown temperatures which form the shakedown region boundary of the analytically determined Bree diagram of the two-bar structure shown in Fig. 4. Six cases scanning six different operating conditions on the Bree diagram are presented.
Table 2: Axial force and temperature values input to the elastic-plastic
analyses of the six cases
Case Q ∆T Q (N) ∆τ (oC)
1 0.1 2.05 400 166.87
2 0.4 2.05 1600 166.87
3 0.6 1.82 2400 148.15
4 0.9 1.22 3600 99.31
5 1.1 0.82 4400 66.75
6 1.45 0.12 5800 9.77
The residual stresses are calculated at the integration points of the two elements meshing the two bars. Table 3 lists the limit shakedown temperatures output by the technique for the six cases and their corresponding (∆T ) values obtained using Eq. (3). Table 3 also lists the corresponding analytically determined (∆T ) values of the two-bar structure. For convenience, the results output by the technique, the (∆T), listed in Table 3 are plotted on the Bree diagram of the two-bar structure shown in Fig. 4 for the six cases.
Table 3: Limit shakedown temperatures output by the technique
Case Limit shakedown temperature (oC)
Corresponding (∆T ) calculated using
Eq. (3)
Analytically determined (∆T )
1 161.66 1.99 2.0
2 161.66 1.99 2.0
3 145.84 1.79 1.8
4 96.21 1.18 1.2 5 64.66 0.79 0.8 6 7.79 0.096 0.1
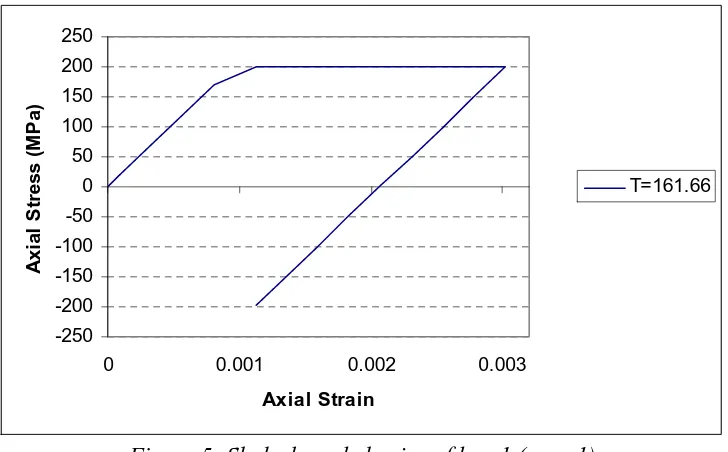
Performing full cyclic loading elasto-plastic finite element simulations using the limit shakedown temperatures listed in Table 3 and the axial force magnitudes listed in Table 2 results in shakedown behavior. Figure 5 shows the shakedown behavior of bar-1 of case-1 when bar-2 is cyclically loaded with the temperature value (∆ =τ 161.66 ) using the cyclic loading pattern shown in Fig. 1.
o
C
-250 -200 -150 -100 -50 0 50 100 150 200 250
0 0.001 0.002 0.003
Axial Strain
A
x
ia
l St
re
s
s
(
M
Pa
)
T=161.66
Figure 5: Shakedown behavior of bar-1 (case-1)
when bar-2 is cyclically loaded with a temperature value (∆ =τ 164 ) using the cyclic loading pattern shown in Fig. 1.
o
C
-250 -200 -150 -100 -50 0 50 100 150 200 250
0 0.001 0.002 0.003
Axial Strain
A
x
ia
l St
re
s
s
(
M
Pa
)
T=164
Figure 6: Reversed plasticity behavior of bar-1 (case-2)
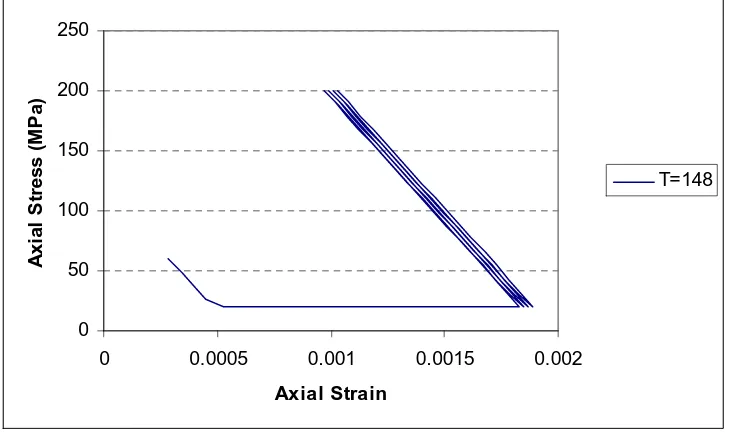
Ratchetting behavior occurs upon cyclically loading bar-2 with a temperature value exceeding the limit shakedown temperature, listed in Table 3, for case-3. Figure 7 shows ratchetting behavior of bar-2 of case-3 when bar-2 is cyclically loaded with a temperature value (∆ =τ 148oC) using the cyclic loading pattern shown in Fig. 1.
0 50 100 150 200 250
0 0.0005 0.001 0.0015 0.002
Axial Strain
A
x
ia
l St
re
s
s
(
M
Pa
)
T=148
Figure 7: Ratchetting behavior of bar-2 (case-3)
The Bree Cylinder Model
T
∆
m
R P
T
x
y
x
Figure 8: Schematic showing meshing and loading of the thin strip across the cylinder thickness
The (CAX4T) element has four integration points and performs coupled temperature-displacement analysis. The material model used is assumed to exhibit an elastic-perfectly-plastic behavior. Table 4 lists the geometric parameters and the material properties of the cylinder analyzed.
Table 4: Cylinder geometric parameters and material properties
m
R (mm) 52.0
t (mm) 4.0
E (GPa) 210.0
α (oC−1) 11.7e-6
Y
σ (MPa) 200.0
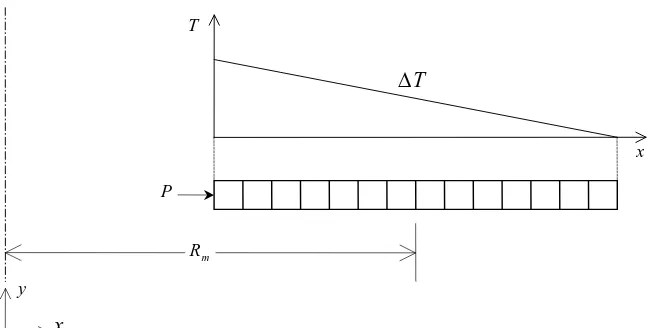
Concerning boundary conditions, the nodes on the bottom side of the thin strip are constrained in the y-direction. This induces plane stress conditions since the effect of axial stress on the cylinder was not included in the analytical work presented by Bree (1967). The internal pressure is applied on the cylinder inner wall as shown in Fig. 8. A linear temperature gradient is applied across the cylinder thickness with the maximum temperature at the cylinder inner wall and drops to zero temperature at the cylinder outer wall as shown in Fig. 8.
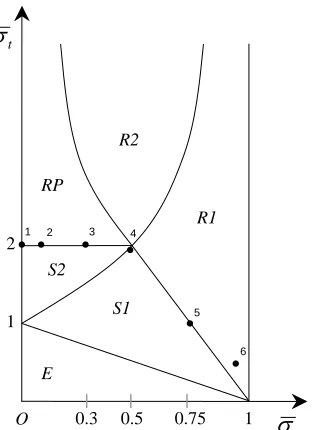
Figure 9 shows the analytically determined Bree diagram of the cylinder where ( ) denotes elastic behavior, ( ), ( ) denote shakedown, ( ) denotes reversed plasticity, and ( ), ( ) denote ratchetting.
E
1
Figure 9: The analytically determined Bree diagram of the cylinder
From the cylinder Bree diagram shown in Fig. 9, the normalized stresses (σP) and (σt ) are expressed respectively as follows:
P P
Y σ σ
σ
= (4)
t t
Y σ σ
σ
= (5)
Where
m P
PR t
σ = (6)
2
t
Eα T
σ = ∆ (7)
For the calculation of the internal pressure magnitudes input to the finite element simulations in addition to easier handling with the cylinder Bree diagram, Eq. (6) is substituted into Eq. (4) and expressed in terms of (P) as listed in Eq. (8).
P Y m
t P
R
σ σ
= (8)
Similarly, Eq. (7) is substituted into Eq. (5) and expressed in terms of (∆T ) in order to calculate the temperature drop across the cylinder thickness as listed in Eq. (9).
2 t Y
T E
σ σ α
∆ = (9)
Applying the proposed technique, the elastic analysis, performed only once and stored, consists of one solution step where a linear temperature gradient is applied across the cylinder thickness. The linear temperature gradient causes only elastic thermal stresses in the cylinder. No constant internal pressure is applied.
0.5 1
O
1 2
E
R1 RP
R2
S1 S2
p
σ
t
σ
z
0.3 0.75
z z z
z
z
1 2 3 4
5
The elastic-plastic analysis consists of two solution steps. The first step involves the application of a constant internal pressure magnitude causing elastic stresses in the cylinder. The second step involves the application of a linear temperature drop distribution across the cylinder thickness, as shown in Fig. 8, applied in an increasing ramp pattern. The linear temperature drop distribution across the cylinder thickness should cause the cylinder stresses to exceed the material yield strength.
The elastic solution is achieved in one solution increment while the elastic-plastic solution is obtained in several solution increments until the desired temperature gradient is fully applied. Therefore, the residual stress for every element in the cylinder, at every solution increment, is calculated using Eq. (1) and represented as follows:
i i
i r ELPL E
ref
T T
σ =σ −σ (10)
The term ( ) denotes the cyclic temperature of the cylinder inner wall at an increment (i) in the elastic-plastic solution. The term ( ) denotes the inner wall temperature applied in the elastic solution which causes only elastic stresses in the cylinder structure. The elastic analysis has no internal pressure (
i
T
ref
T
0 P
σ = ) and the temperature drop across the thickness (∆ ) has the highest temperature at the cylinder inner wall (T ) equals to 81 taking (
T ref .4oC
0.5 t
σ = ) in Eq. (9).
The proposed technique successfully determined the limit shakedown temperatures which form the shakedown region boundary of the analytically determined Bree diagram shown in Fig. 9. Six cases covering different regions in the cylinder Bree diagram are presented.
Table 5 lists the (σP) values covering different internal pressure ranges on the cylinder Bree diagram. The corresponding (σt) values are chosen to give the three different responses that occur upon crossing the shakedown boundary namely; reversed plasticity (RP), ratchetting behaviors (R2), and (R1).
Table 5: Pressure and temperature values input to the elastic-plastic
analyses of the six cases
Case σP σt P(MPa) ∆T (o )
C
1 0 2.3 0.0 374.44
2 0.1 2.3 1.54 374.44 3 0.3 2.3 4.62 374.44
4 0.5 2.5 7.70 407.0
5 0.75 1.5 11.54 244.2
6 0.9 1.0 13.85 162.8
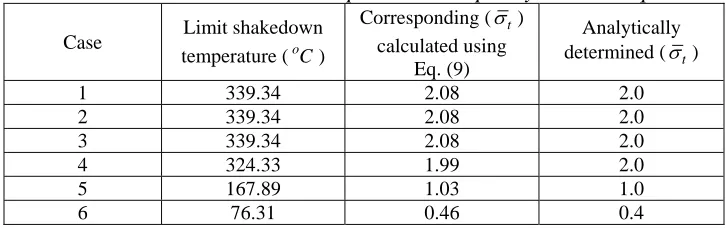
The residual stresses are calculated at the integration points of the twenty elements meshing the cylinder thickness. Table 6 lists the limit shakedown temperatures output by the technique for the six cases presented and their corresponding (σt) values calculated using Eq. (9). Table 6 also lists the analytically determined (σt) values using the Bree diagram of the cylinder. The results output by the technique, the (σt), listed in Table 6 are plotted on the Bree diagram of the Bree cylinder shown in Fig. 9 for convenience.
Table 6: Limit shakedown temperatures output by the technique
Case Limit shakedown temperature (oC)
Corresponding (σt)
calculated using Eq. (9)
Analytically determined (σt)
1 339.34 2.08 2.0
2 339.34 2.08 2.0
3 339.34 2.08 2.0
4 324.33 1.99 2.0
5 167.89 1.03 1.0
6 76.31 0.46 0.4
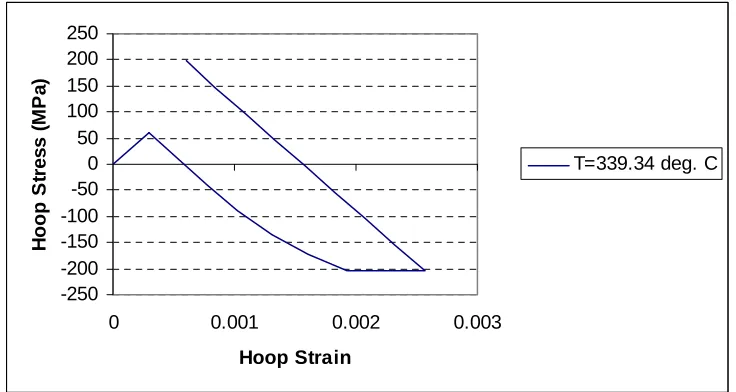
drop across the thickness having a maximum value (T =339.34 oC) at the cylinder inner wall. The temperature cyclic loading follows the cyclic loading pattern shown in Fig. 1.
-250 -200 -150 -100 -50 0 50 100 150 200 250
0 0.001 0.002 0.003
Hoop Strain
H
oop S
tr
e
s
s
(
M
P
a
)
T=339.34 deg. C
Figure 10 (a): Shakedown behavior of the cylinder (case-3) at cylinder outer face
-250 -200 -150 -100 -50 0 50 100 150 200 250
0 0.001 0.002 0.003
Hoop Strain
H
oop S
tr
e
s
s
(
M
P
a
)
T=339.34 deg. C
Figure 10 (b): Shakedown behavior of the cylinder (case-3) at cylinder inner face
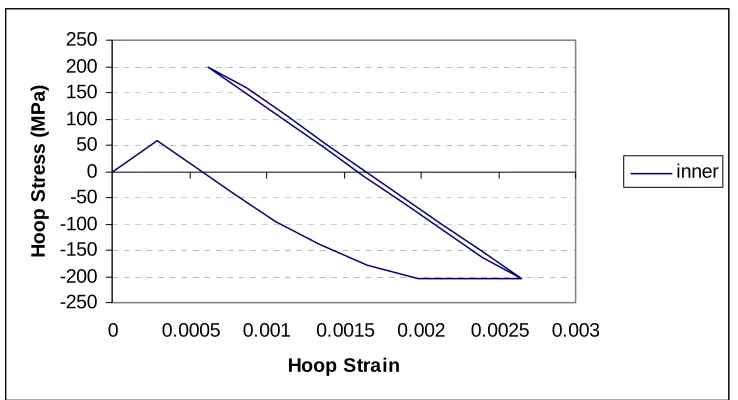
Reversed plasticity behavior ( ) occurs when cyclically loading the cylinder with a temperature value exceeding the limit shakedown temperature, listed in Table 6, for case-3. Figure 11 shows reversed plasticity behavior of case-3 when cyclically loading the cylinder with a linear temperature distribution across the thickness exceeding the limit shakedown temperature of (T
RP
339.34
= o
-250 -200 -150 -100 -50 0 50 100 150 200 250
0 0.0005 0.001 0.0015 0.002 0.0025 0.003
Hoop Strain
H
oop S
tr
e
s
s
(
M
P
a
)
inner
Figure 11: Reversed plasticity behavior (RP) for (case-3) at cylinder inner face
Ratchetting behavior ( ) occurs upon cyclically loading the cylinder with a temperature value exceeding the limit shakedown temperature, listed in Table 6, for case-4. Figure 12 shows ratchetting behavior ( ) of case-4 when cyclically loading the cylinder with a linear temperature distribution across the thickness exceeding the limit shakedown temperature of (T ) at the cylinder inner wall.
2
R
=
2
R
324.33oC
-250 -200 -150 -100 -50 0 50 100 150 200 250
0 0.001 0.002 0.003 0.004 0.005
Hoop Strain
H
oop S
tr
e
s
s
(
M
P
a
)
outer
Figure 12: Ratcheting behavior (R2) for (case-4) at cylinder outer face
Ratchetting behavior ( ) occurs upon cyclically loading the cylinder with a temperature value exceeding the limit shakedown temperature, listed in Table 6, for case-5. Figure 13 shows ratchetting behavior ( ) of case-5 when cyclically loading the cylinder with a linear temperature distribution across the thickness exceeding the limit shakedown temperature of (T ) at the cylinder inner wall.
1
R
=
1
R
-50 0 50 100 150 200 250
0 0.001 0.002 0.003 0.004
Hoop Strain
H
oop S
tr
e
s
s
(
M
P
a
)
outer
Figure 13: Ratcheting behavior (R1) for (case-5) at cylinder outer face
DISCUSSION
The output of the proposed technique for the two-bar structure and the Bree cylinder listed in Table 3 and Table 6 respectively showed very good outcomes compared to the analytical solutions. However, a difference of 15% is noticed for case-6 of the Bree cylinder listed in Table 6. A full elasto-plastic cyclic loading simulation is conducted with a (σ =t 0.5) which exceeds the analytically determined value of (σ =t 0.4) listed in Table 6 for case-6. The result of the cyclic loading simulation gave shakedown behavior and not ratchetting ( ) behavior as should be expected from the Bree diagram of the cylinder shown in Fig. 9. On the other hand, when the cylinder is cyclically loaded with the limit shakedown temperature ( ) of case-6 listed in Table 6, shakedown behavior was noticed. Cyclically loading the cylinder with a temperature distribution exceeding the ( ) temperature results in ratchetting ( ) behavior. The 15% difference of case-6 could be attributed to the proximity of the cylinder internal pressure (90% of the pressure to cause yielding) to the pressure limit load condition.
1
R
o
C
76.31oC
76.31 1
R
Besides determining the limit shakedown load of the two-bar structure and the Bree cylinder, the technique is capable of determining the elastic limit of both structures. This is achieved by using the output of the elastic-plastic analysis only. The elastic limit corresponds to the elastic-plastic solution increment (i−1) prior to increment ( ) at which the output stress equals the material yield strength.
i
Reversed plasticity behavior is checked for the elements output from the technique by performing two steps. First, from the technique output, determine the time increment where the calculated residual stress (
i
r
σ ) equals or exceeds the material yield strength. Second, for the same output element list, locate the same time increment in the elastic-plastic solution and check the corresponding stress. If, for at least one element in the list, the corresponding stress in the elastic-plastic solution equals the yield strength, therefore reversed plasticity occurs.
Similarly, ratchetting behavior is checked for the elements output from the technique by performing two steps. First, determine the time increment where the calculated residual stress (
i
r
σ ) equals or exceeds the material yield strength. Second, locate the same time increment in the elastic-plastic solution and check the corresponding stress. If the corresponding stress in the elastic–plastic solution is not equal to the yield strength and other integration point of another element is yielding in unloading, therefore ratchetting occurs.
CONCLUSION
A simplified technique to determine the limit shakedown load for a structure or a component is presented and applied to the two-bar structure and the Bree cylinder problem. The results of the technique showed very good correlation with the analytically determined Bree diagram of both structures.
The limit shakedown load magnitudes output by the technique were cyclically applied on both structures to verify the technique. Shakedown behavior is noticed upon cycling both structures with the load magnitudes output by the technique. Reversed plasticity or ratchetting behaviors were observed upon cyclically loading both structures with load magnitudes exceeding the ones output by the technique depending upon the axial force magnitudes in the two-bar structure and the applied internal pressure magnitudes in the Bree cylinder problem.
the elastic limit through the elastic-plastic analysis only. Moreover, the technique is capable of determining the reversed plasticity and ratchetting behaviors without the need to perform lengthy full cyclic loading elasto-plastic analyses.
ACKNOWLEDGMENTS
The American University in Cairo is greatly acknowledged for the use of a licensed version of ABAQUS/Standard v6.4-1 through the CAD-Lab.
REFERENCES
A.I.Mohamed, M.M.Megahed, L.S.Bayoumi, M.Y.A.Younan, (1999), Applications of Iterative Elastic Techniques for Elastic-Plastic Analysis of Pressure Vessels, Jrnl. of Pressure Vessels Technology, Vol.121, pp.1-6.
A.K.Dhalla, (1987), A Simplified Procedure to Classify Stresses for Elevated Temperature Service, Trans. ASME-PVP, Vol.120, pp.367-387.
D.L.Marriott, (1988), Evaluation of Deformation or Load Control of Stress under Inelastic Conditions Using Finite Elements Stress Analysis, ASME-PVP Conference, Vol.136, pp.3-9.
D.Mackenzie, J.T.Boyle, (1993), A Simple Method for Estimating Shakedown Load for Complex Structures, Jrnl. of Pressure Vessels Technology, Vol.265, pp.89-94.
E.Melan, (1938), Der Spannungszustand eines Mises-Henckyschen Kontinuums bei veraenderlicher Belastung, Sitzber. Akad. Wiss., 147, pp.73-78.
E.Melan, (1938), Zur Plastizitaet des reumlichen Kontinuums, Ing. Arch., 8, pp.116-126.
E.W.Parkes, (1964), Structural Effects of Repeated Thermal Loading, Thermal Stress (Edited by Benham et al.), Pitman, London.
F.A.Leckie, M.P.Ranaweera, (1980), The Theoretical Assessment of Deformation and Damage of a High Temperature Component, ORNL-Subcontract No. 7689.
F.A.Leckie, R.K.Penny, (1967), Shakedown Pressure for Radial Nozzles in Spherical Pressure Vessels, Int. Jrnl. of Solids and Structures, Vol.3, pp.743-755.
Hibbitt, Karlsson and Sorensen, Inc., “ABAQUS/Standard User’s Manual”, Providence, R. I., 2004.
J.Bree, (1967), Elastic-Plastic Behaviour of Thin Tubes Subjected to Internal Pressure and Intermittent High Heat Fluxes with Application to Fast Nuclear Reactor Fuel Elements, Jrnl. of Strain Analysis, Vol.2, pp.226-238.
J.Zarka, F.C.Arnaudeau, J.Casier, G.Baylac, (1978), A Practical Method to Determine Elastic or Plastic Shakedown of Structures, Trans. ASME Pressure Vessel and Piping Conference, Montreal.
M.M.Megahed, (1981), Influence of Hardening Rule on the Elasto-Plastic Behaviour of a Simple Structure under Cyclic Loading, Int. Jrnl. Mech. Sci., Vol.23, pp.169-182.
M.M.Megahed, (1978), Kinematic Hardening Analysis of the Modes of Deformation of Thin Tubes, unpublished report.
M.Muscat, D.Mackenzie. (2003), Elastic-Shakedown Analysis of Axisymmetric Nozzles, Jrnl. Of Pressure Vessel Technology, Vol.125,pp.365-370.
P.R.Miller, (1959), Thermal Stress Ratchet Mechanism in Pressure Vessels, Jrnl. Basic Engng, Trans. ASME, Series D 81(2), pp.190-196.
R.Seshadri, (1991), The Generalized Local Stress Strain (GLOSS) Analysis-Theory and Applications, Jrnl. of Pressure Vessel Technology, Vol.113, pp.219-227.
T.M.Mulcahy, (1976), Thermal Ratchetting of a Beam Element Having an Idealized Bauschinger Effect, Jrnl. Eng. Materials and Technology, Trans. ASME, Vol.98, pp.264-271.