A Technique based on Image Processing for Measuring Cracks in the Surface of
Concrete Structures
Bang Yeon Lee1), Jin-Keun Kim1), Yun Yong Kim2) and Seong-Tae Yi3)
1) Department of Civil & Environmental Engineering, Korea Advanced Institute of Science and Technology (KAIST), South Korea
2) Department of Civil Engineering, Chungnam National University, South Korea 3) Department of Civil Engineering, Chung Cheong University, South Korea
ABSTRACT
This paper proposes a technique for detecting and analyzing cracks in the surface of concrete. Based on digital image processing, the technique automates the measurement of features such as the width, length, and direction of cracks. The proposed algorithm has a new way of determining the unit pixel length, it applies a morphological technique for shading corrections, it uses enhanced binarization and shape analysis for better detection, and it suggest algorithms for calculating the width, length, and direction of cracks. A MATLAB code was developed for the proposed algorithm and, to determine the effectiveness of the algorithm, testing was performed on crack images taken with a digital camera. Within limited testing, the accuracy of the detection and analysis of cracks is better with the proposed method than with conventional methods. This paper presents a preliminary study for commercial development.
INTRODUCTION
Efforts are presently being made to minimize the impact of cracks on the safety, durability, and serviceability of concrete structures. In this regard, it is necessary to accurately measure the width, length, and direction of the cracks, and to establish a database of such features under crack-control. However, because inspectors generally measure cracks manually, a great deal of time and energy is required to take measurements and to compile relevant data. In efforts to develop a faster and more efficient method of measuring the cracks in concrete, many researchers have adopted an image processing technique comprised of two steps: crack detection and crack analysis. Crack detection refers to the detection of cracks shown on an image of a concrete surface. This method, however, has not been fully developed for the following reasons: first, the mathematical modeling of cracks has not yet been realized because of the random shape of cracks; and, second, there is too much noise on the surface of the concrete because of the structure’s exposure to the environment.
The objective of this paper is to develop an automatic image processing technique that detects cracks and calculates the crack features on images taken with a digital camera. The basic procedure of our technique is similar to that developed in previous studies[1-4]. Using enhanced binarization and shape analysis, the proposed approach focuses on improving detection performance. In addition, a morphological technique for shade correction is applied, and a detailed algorithm for calculating the width, length, and direction of cracks is proposed.
The crack problem considered in this study is also significant to a reinforced concrete (RC) member of nuclear power plant (NPP) structures. In NPP structures, cracks shall not occur. Namely, when considering the specialty (i.e., radiation leakage and durability deterioration etc.) of NPP structures, engineers (more specifically, the nuclear engineer) shall consider crack problems as major issues.
DEVELOPMENT OF THE CRACK DETECTION ALGORITHM
Fig. 1 shows the procedure of the proposed technique. The crack image taken with a digital camera contains 256 possible gray levels, ranging from 0 for black to 255 for white. After correcting for shade in an image, binarization and shape analysis are used to detect the cracks. The crack features are calculated through preprocessing, which includes boundary, thinning, and labeling processes. Real values are finally calculated by multiplying the values of the features obtained in the previous step by unit pixel length, which is determined in the step of image acquisition.
Image Acquisition
To obtain images of the surface of the concrete, a Nicon (D1X) camera having a CCD size of 23.7 mm × 15.6 mm and equipped with a commercial NIKKOR AF-S 28 mm to 70 mm lens was used. It is assumed that the lens was parallel to the surface of the concrete, and that it produced no optical errors.
Detection of Cracks
The background brightness of an image is generally not uniform because the quantity of light on the concrete surface differs with location. Therefore, the initial step in detecting cracks is to normalize the brightness of the background (that is, shade correction), and then to conduct binarization. In order to obtain a shade-corrected image, a morphology based on erosion, dilation, openness, and close operations were applied[5]. An image with a uniform background can be obtained by subtraction followed by openness, which consists of dilation followed by erosion. This is defined according to the following equation:
((
)
)
C
= ⋅ − =
A B
A
A
⊕
B
B
−
A
(1)where A is the original image and B is the structuring element (that is, in this study, a circle with a 15 pixel radius).
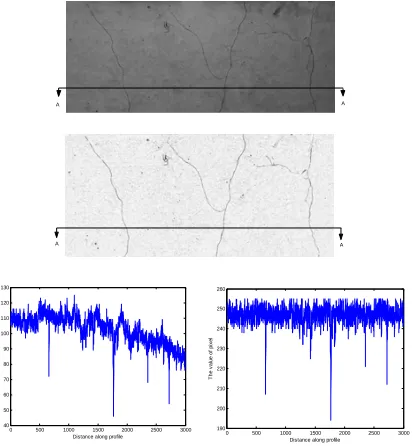
Fig. 2 illustrates an example of an image before and after shading correction. As shown in Fig. 2(d), the pixel value profile obtained from the corrected image exhibits significantly more uniformed background brightness than the original image (Fig. 2(c)). This difference indicates that the morphology-based normalization successfully processes the shade correction and facilitates the next step of binarization—that is, the conversion of the gray image into a binary image. In order to distinguish cracks from the background and from meaningless objects, an algorithm based on the binarization technique and shape analysis was developed. Fig. 1 shows the algorithm. In a binary image, all pixels are assigned a value of 1 or 0 and these values represent an object that is based on a set threshold value. Determining the threshold value is therefore the most critical operation. Following a series of preliminary numerical tests, the discriminant method proposed by Otsu was adopted[6]. This method was further improved by adding several crucial processes such as noise reduction, local binarization, and a double extraction process (as in the first and second extraction in Fig. 1). This enhancement makes it possible to obtain a more accurate binarized image. The noise reduction operation sets a pixel to 1 if five or more pixels in its three-by-three neighborhood have a value of 1; otherwise, it sets the pixel to 0. This operation aims to eliminate noise and to reduce the total operation time.
A A
A A
0 500 1000 1500 2000 2500 3000 190
200 210 220 230 240 250 260
Distance along profile
T
h
e v
a
lu
e o
f
p
ix
e
l
130
Following these successive operations, objects were extracted from the image, as shown in Fig. 3(a). However, only fairly accurate discrimination between a real object and an extracted object is possible, because global binarization is performed on the entire image. The next step is local binarization, which is performed in small areas near the boundaries of the objects extracted by the global binarization process. The size of each area was 11 by 11 pixels, and the number of iterations was five. Fig. 3 shows an example of local binarization. The results indicate that better extraction of objects is realized with local binarization following global binarization (black) than with global binarization alone (white).
The second extraction process aims to detect meaningful objects (cracks) that were undetected in the first extraction process. These objects resemble the background in terms of pixel values. They are also located out of the local binarization
Fig. 1 Flow chart of crack detection and analysis algorithm
Fig. 2 Shading correction using morphology; (a) original image, (b) corrected image, (c) before shading, and (d) after shading correction
0 500 1000 1500 2000 2500 3000 40
50 60 70 80 90 100 110 120
Distance along profile
T
he
v
al
u
e of
pi
x
el
area, as the local binarization is performed according to the boundaries of the objects already detected by the global binarization. The second process uses the same binarization technique as the first extraction process but with a different image; in this image, the objects extracted during the first process have been completely eliminated.
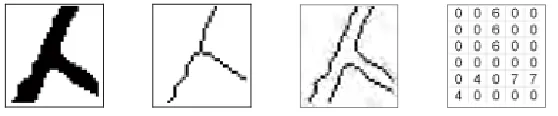
Despite performing shade correction and binarization of the image, the cracks are still indistinguishable from meaningless objects, mainly due to the failure to consider shape. Therefore, a modified shape factor as was considered a secondary criterion of crack detection. Initially a packing density index was adopted[7]. The packing density index is defined as the division of an object’s area by that of the object’s circumscribed circle. As shown in Fig. 4, this value can then be modified by using the circumscribed circle of the rectangle that circumscribes the object instead of the circumscribed circle of the object itself. Through this modification, efficient calculation of the area of the circumscribed circle could be realized. The modified packing density Fcr is expressed as follows in the form of Eq. (2):
ob cr
mcc
A
F
A
=
(2)where Aob is the area of the object and Amcc is the area of the circumscribed circle of the rectangle that circumscribes the
object.
Fig. 4 Modified packing density; (a) crack shape, and (b) non-crack shape
Fig. 3 Local binarization; (a) local area, and (b) its result
The value for Fcr tends toward 0 for an extremely elongated object, such as the one shown in Fig. 4(a), or 1 for a circular
object (Fig. 4(b)). On the basis of extensive numerical tests, the threshold for distinguishing cracks from other objects, Fcr,
was denoted as Fcr,th and empirically optimized to be 0.12.
DEVELOPMENT OF THE CRACK ANALYSIS ALGORITHM
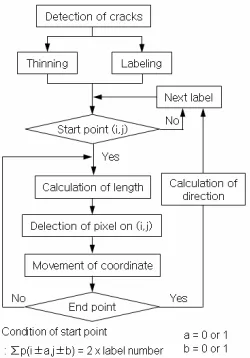
In order to calculate the features of detected cracks, a series of preprocessing steps was performed to obtain the thinned, boundary, and labeled[8] images shown in Fig. 5. A thinning algorithm developed by Zhang was also used[9]. The basis of this algorithm is to thin an object to a center line by removing the exterior pixels in a stepwise manner. As a result, an object without holes shrinks to a minimally connected stroke (Fig. 5(b)). The boundary process removes the interior pixels. It sets a pixel to 1 if all of its four connected neighbors are 0, thus leaving only the boundary pixels (Fig. 5(c)). The labeling process assigns a label to an eight-connected object (Fig. 5(d)).
Fig. 5 Preprocess for crack analysis; (a) original image, (b) thinned image, (c) boundary image, and (d) labeled image
A B
C D
A B
C D
A B
C D
Fig. 6 Description of calculation procedure for crack width; (a) flow chart, (b) diagram for crack width, and (c) distance filter
Fig. 6(a) shows the procedure for determining the crack width. After preprocessing, the thinned and boundary images of the cracks are incorporated, as shown in Fig. 6(b). The crack width is defined as the sum of the minimum distances from the center pixel to both boundary pixels, and was calculated by applying the incorporated crack image to four distance filters (Fig. 6(c)). The four minimum distances from each filter, A, B, C, and D, were then obtained. Among these four values, two were chosen on the basis of the direction of the crack. In the example shown in Fig. 6, the values of filters B and C were chosen. Finally, the real values were calculated by multiplying these by the unit pixel length.
Fig. 7 shows the procedure for determining the length and direction of a crack. After preprocessing, the crack width was reduced to the size of one pixel, as in the labeled image of Fig. 5(d). On the basis of this labeled image, an iterative process was used to calculate the length of the crack. First, the starting point is determined. Then, depending on the location of the next pixel, the unit pixel length is multiplied by 1.0 or 2 , and this value is added to the previous value (the initial value was equal to zero for the first step). By moving the position to the next labeled pixel, the iterative process continues until the end point is detected. The direction of the crack, which is simply calculated by using the coordinate relation between the starting point and the end point, is expressed by Eq. (3) as follows:
Fig. 7 Flow chart of crack length and direction algorithm
180 1 '( ) ( )
( ) tan
'( ) ( ) y i y i i
x i x i
π
− ⎛ −
∠ = × ⎜
−
⎝ ⎠
⎞
⎟ (3)
VERIFICATION AND DISCUSSION
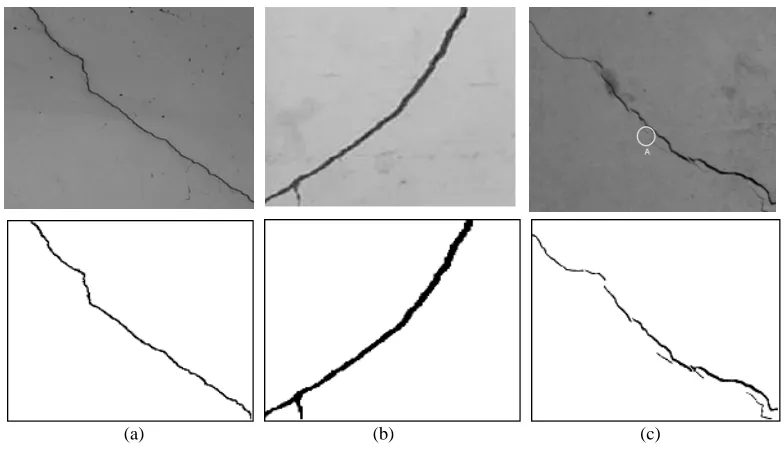
During the development of this technique, a MATLAB code was developed for the proposed algorithm, and several tests were performed on crack images taken with a digital camera to demonstrate the validity of the proposed algorithms. Fig. 8 shows three crack images and the resulting detected crack images: Fig. 8(a) shows numerous meaningless objects; Fig. 8(b) shows a branch-shaped crack; and Fig. 8(c) shows several small cracks along a main crack. Through a comparison of the original crack images with the results obtained by the proposed technique, the validity of the proposed technique is confirmed by the accurately detected crack images. Fig. 8(a) shows that the cracks are clearly distinguishable from meaningless objects (such as small holes). The branch-shaped crack in Fig. 8(b) is also very distinct. Overall, the detected image of Fig. 8(c) indicates satisfactory performance of the proposed algorithm as several narrow and randomly short cracks along the main crack are exhibited. The second extraction process enabled these cracks to be detected. In contrast, a small crack in the circled part of ‘A’ was not clearly detected because the crack’s modified packing density, Fcr, was greater than the Fcr,th threshold of
0.12. While this crack could have potentially been detected by employing an increased Fcr,th value, such an increase might
have led to a greater incidence of meaningless objects or noise being falsely detected as cracks. Furthermore, in practice, small cracks such as those in part ‘A’ are not critical or meaningful to users such as concrete engineers.
A test was performed on the crack width in order to verify the performance of the developed technique under the conditions at image acquisition. Table 1 shows the test results obtained for five measurement points under three different camera focal lengths and distances between the camera and concrete surface. The standard deviation of crack width calculated under the test conditions was 0.027~0.047 and the average was 0.035. The difference in the values of the crack width calculated at the same point under the conditions at image acquisition is attributed to the difference in resolution (i.e. unit pixel length). Generally, the accuracy of a measuring technique using image processing and a relevant device depends on the resolution, which is determined at image acquisition. While this tendency also was reflected in the results of the present tests, there was little difference in the test conditions. Table 2 provides comparisons between the crack widths calculated by the proposed technique and the values measured by an optical crack microscope (resolution: 0.1 mm). The results yielded very close numerical values. The errors between the two widths were defined by the following Eq. (4) and are in the range of 0.67 % to 5.9 % (average: 3.8 %).
|
|
|
|
c m
m
w
w
Relative difference
w
−
=
. (4)where wcis the crack width calculated by the proposed technique and wm is the crack width measured by the optical crack
(a) (b) (c)
Fig. 8 The results of crack detection tests
Table 1. Effect of focal length of camera and distance between camera and concrete surface
Measurement point Distance between camera
and cracks (mm) Focal length (mm)
Unit pixel length
(mm/pixel) 1 2 3 4 5
865 28 0.209 1.05 1.49 0.89 - -
865 50 0.119 - 1.48 0.84 0.84 -
865 70 0.085 - - 0.82 - -
1200 28 0.299 1.02 1.57 0.90 0.90 1.02
1200 50 0.171 - 1.55 0.83 0.86 1.07
1200 70 0.124 - 1.48 0.82 0.87
1915 50 0.286 1.10 1.50 0.86 0.86 0.98
1915 70 0.207 - - 0.83 0.83 -
Average (mm) 1.05 1.51 0.85 0.86 1.02
Standard deviation (mm) 0.037 0.036 0.030 0.024 0.047
Table 2. Comparison of crack width
Measurement point
1 2 3 4 5 wc: width calculated by
proposed technique (mm) 1.05 1.51 0.85 0.86 1.02
wm: width measured by crack
microscope (mm) 1.0 1.5 0.8 0.9 1.0
Relative difference (%) 5.5 0.67 5.9 4.7 2.3
Table 3. Comparison of crack length
Measurement point
1 2 3 4 5 6 7 8 lc: length calculated by
proposed technique (mm) 680.6 312.3 614.4 561.5 112.6 121.3 539.7 130.3 lm: length measured by ruler (mm) 630 300 580 540 100 100 500 116
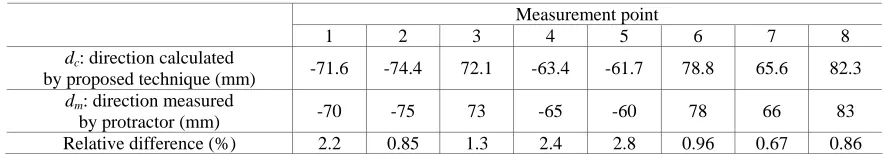
Table 4. Comparison of crack direction
Measurement point
1 2 3 4 5 6 7 8 dc: direction calculated
by proposed technique (mm) -71.6 -74.4 72.1 -63.4 -61.7 78.8 65.6 82.3 dm: direction measured
by protractor (mm) -70 -75 73 -65 -60 78 66 83
Relative difference (%) 2.2 0.85 1.3 2.4 2.8 0.96 0.67 0.86
Table 3 and table 4 show comparisons between the crack lengths (lc) and crack directions (dc) calculated by the proposed
technique and the values (lm) measured by a ruler (resolution: 1 mm) and values (dm) measured by a protractor (resolution: 1°),
respectively. The errors between the two values were also defined by Eq. (4). A large amount of error was incorporated in the measured crack length due to the use of a straight ruler, which necessitates dividing the crack length into several segments.
It cannot be concluded that these results reflect the accuracy of the proposed technique owing simply to the errors in the measured data. However, at a minimum, the present results suggest that the proposed technique can provide sufficient accuracy for analyzing the widths of surface cracks in practical problems.
CONCLUSION
This paper has introduced an advanced image processing technique that automatically detects and analyzes cracks in concrete structures. The following conclusions have been drawn: (1) because of the nonuniformity of lighting, a morphological technique was applied to correct the nonuniformity of the background brightness of images. The validity of the applied morphological approach was established by comparing the pixel value profile of the original image with that of the corrected image; (2) in order to enhance the accuracy of crack detection, a local binarization process and an extraction process were implemented. Furthermore, by using a packing density index, which was modified to distinguish cracks from other objects, the calculation was simplified relative to the original calculation of the packing density index. A comparison of the original crack images with the results obtained by the proposed technique shows that the proposed technique can accurately detect crack images; (3) this paper proposed detailed algorithms to calculate the width, length, and direction of cracks in images taken in the crack detection process. A comparison of measurements calculated by the proposed technique with those of the conventional technique validates the proposed algorithms and the overall technique.
ACKNOWLEDGEMENTS
This study has been a part of a research project supported by Korea Ministry of Construction and Transportation (MOCT) via the Infra-Structures Assessment Research Center. The authors wish to express their gratitude for the financial support that made this study possible.
REFERENCES
1. Ito, A., Aoki, Y., and Hashimoto, S., “Accurate Extraction and Measurement of Fine Cracks from Concrete Block Surface Image,” IEEE Industrial Electronics Society, Vol.3, 2002, pp. 2202-2207.
2. Kaseko. M.S., and Ritchie, S.G., “A Neural Network Based Methodology for Pavement Crack Detection and Classification,” Transportation Research. Part C, Emerging Technologies, Vol. 1, No. 4, 1993,pp. 275- 291.
3. Schutter, G.D., “Advanced Monitoring of Cracked Structures Using Video Microscope and Automated Image Analysis,” NDT & E International: Independent Nondestructive Testing and Evaluation, Vol. 35, No.4, 2002, pp. 209-212.
4. Sohn, H.G., Lim, Y.M, Yun, K.H., and Kim, G.H., “Monitoring Crack Changes in Concrete Structures,” Computer-Aided Civil and Infrastructure Engineering, Vol. 20, 2005, pp.52-61.
5. Seul, M., O'Gorman, L., and Sammon, MJ., “Practical Algorithms for Image Analysis,” Cambridge University Press, 2000. 6. Otsu, N.A., “Threshold Selection Method from Gray Level Histogram,” IEEE Transactions on Systems, Vol. SMC-9, No.1,
1979, pp. 62-66.
7. Ammouche, A., Breysse, D., Hornain, H., Didry, O., and Marchand, J., “A New Image Analysis Technique for The Quantitative Assessment of Microcracks in Cement-Based Materials,” Cement and Concrete Research, Vol. 30, No.1, 2000, pp. 25-35.
8. Haralick, R.M, and Linda, G.S., “Computer and Robot Vision,” Volume I, Addison-Wesley, 1992, pp. 28-48.
9. Zhang, T.Y., Suen, C.Y., “A fast parallel algorithm for thinning digital patterns,” Comm. ACM, Vol.27, No.3, 1984, pp. 236-239.