OPTICAL TOMOGRAPHY SYSTEM FOR BUBBLES DETECTION IN LIQUID MEDIUM
JULIZA BINTI JAMALUDIN
A project report submitted in partial fulfilment of the requirements for the award of the degree of
Master of Engineering (Electrical – Mechatronics and Automatic Control)
Faculty of Electrical Engineering Universiti Teknologi Malaysia
iii
Dedicated, in thankful appreciation for support, encouragement and understandings to my beloved mother, Noriah Binti Hj. Maamor, my husband Jemmy @ Mohd Jemmy Bin Mohd Rohani, siblings and in memory of my late father
iv
ACKNOWLEDGEMENT
v
ABSTRACT
vi
ABSTRAK
vii
TABLE OF CONTENTS
CHAPTER TITLE PAGE
DECLARATION ii
DEDICATION iii
ACKNOWLEDGEMENT iv
ABSTRACT v
ABSTRAK vi
TABLE OF CONTENTS vii
LIST OF TABLES x
LIST OF FIGURES xi
1 INTRODUCTION 1
1.1 Background of The Project 1
1.2 Objectives of the Project 3
1.3 Problems Statement 4
1.4 Scope of the Project 4
1.5 Summary of Works 6
1.6 Expected Result 8
2 LITERATURE REVIEW 9
2.1 Tomography 9
viii
2.2.1 Electrical Capacitance Tomography 13
2.2.2 Optical Tomography 14
2.2.2.1 Optical Coherence Tomography 14 2.2.2.2 Optical Projection Tomography 15 2.2.3 Ultrasonic Tomography System 16 2.3 Application of Tomography System 18 2.3.1 Magnetic Resonance in Medical
Application 18
2.3.2 Doppler Ultrasonic Bubble Sensing 19 2.3.3 Optical Micro Bubble Sensor 20 2.3.4 Optical Micro Bubble Sensing Methods 22 2.3.5 Total Internal Reflectance (TIR) Methods 23 2.4 Infrared Laser Diode Sensor 24 2.5 Couple Charge Device Linear Sensor 25
3 METHODOLOGY 26
3.1 Introduction 26
3.2 Hardware Implementation 29
3.2.1 Infrared Laser Diode Sensor 30 3.2.2 Couple Charge Device Linear Sensor 31
3.2.3 Pipeline 34
3.2.4 Microcontroller PIC 16F877A 36 3.2.4.1 Comparing Clock Signal from
Proteus Simulation versus Oscilloscope
43
4 RESULT AND DISCUSSIONS 47
ix
4.2. Total Cost for Hardware Development 48 4.3. Observation from Components Alignment 50
4.4. Experiments 51
4.4.1 Introduction 51
4.4.2 Experiment 1 52
4.4.2.1 Procedure 52 4.4.2.2 Result Experiment 1 55 4.4.2.3 Discussion Experiment 1 56
4.4.3 Experiment 2 60
4.4.3.1 Procedure 60 4.4.3.2 Result Experiment 2 62 4.4.3.3 Discussion Experiment 2 62
5 CONCLUSION AND FUTURE WORKS 64
5.1 Conclusion 64
5.2 Recommendation 65
x
LIST OF TABLES
TABLE NO. TITLE PAGE
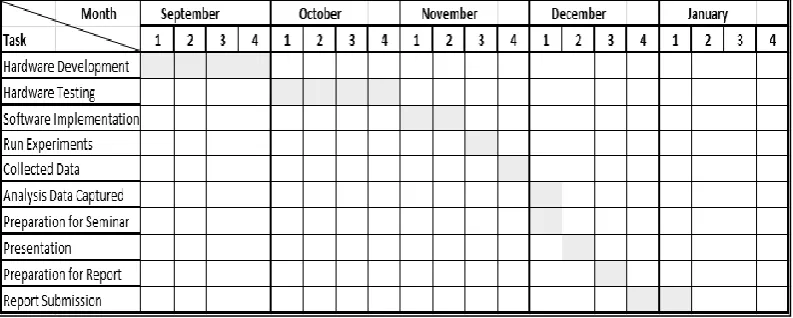
1.1 Gantt Chart for Semester 1 7
1.2 Gantt Chart for Semester 2 7
2.1 Table of Tomogram 12
4.1 Table above show the price for each unit components that had been used
49
4.2 Table that listed the type of liquid medium 54
4.4 Analysis for the result when laser diodes off 57
4.5 Analysis for the result when laser diodes on 58
4.6 This table show the list of sizes of bubble that will be measured its existence
61
4.7 This table show the result that Couple Charge Device Linear sensor that can sense the existence of bubble base on volumetric sizes.
xi
LIST OF FIGURES
FIGURE NO. TITLE PAGE
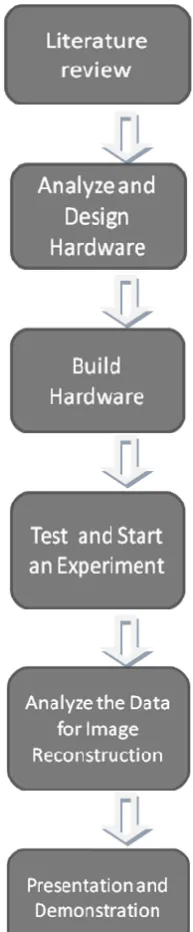
1.1 Flow Chart of Project 6
2.1 Basic block diagram for Process tomography system 10
2.2 Image Reconstruction 11
2.3 Basic Electrical Capacitance Tomography System 13
2.4 Component blocks of an OCT system 15
2.5 A sample is excited using light of an appropriate wavelength 16
2.6 Layout design of ultrasonic tomography 17
2.7 Path modeling of ultrasonic wave 17
2.8 Intermountain Medical Imaging 19
2.9 Ultrasound Transmitter and Receiver 19
2.10 Typical Ultrasound Bubble Sensing Setup 20
2.11 The Principle Design Of Optical Sensor 21
2.12 Im a g e P r o c e s s i n g 21
2.13 Optical Bubbles Sensing Schemes 22
2.14 Total Internal Reflectance Method 23
2.15 Infrared Region of the Electromagnetic Spectrum 24
xii
3.2 Block Diagram for ‘Optical Process Tomography for Bubbles Detection in Liquid
27
3.3 The orientation of transmitter and receiver 28
3.4 Image Reconstruction 29
3.5 Coordination for laser diode at top view of pipeline 30 3.6 The coordination for laser diode and concave lens. 30
3.7 Laser Diode with battery 31
3.8 Variety Type of Lenses 31
3.9 Couple Charge Device (CCD) Linear Sensor 32
3.10 Dimension of Charge Couple Device 32
3.11 Pin Configuration 33
3.12 Schematic Diagram for CCD Linear Sensor 33
3.13 Couple Charge Device Circuit Board 34
3.14 Orientation of pipeline 35
3.15 Acrylic Pipeline 35
3.16 Clock Timing Chart for CCD 36
3.17 Schematic Diagram for CCD Linear Sensor 37
3.18 Real image for SK40C microcontroller board 37
3.19 Clock signal for θ1, θ 2, and RS 38
3.20 Flow chart for microcontroller main programming 39 3.21 SK40C Circuit Board connected with CCD Linear sensor
circuit board
42
3.22 Result get for phase 1 clock signal using (a) Proteus simulation and (b) oscilloscope
43
3.23 Result get for phase 2 clock signal using (a) Proteus simulation and (b) oscilloscope
44
3.24 Result get for RS clock signal using (a) Proteus simulation and (b) oscilloscope
44
3.25 Result get for ROG clock signal using (a) Proteus simulation and (b) oscilloscope
xiii
3.26 Complete Circuit for receiver 46
4.1 Show the top view of final hardware 47
4.2 Show the side view of final hardware 47
4.3 The orientation of transmitter and receiver 50
4.4 Block Diagram of the System 52
4.5 Histogram graph for voltage measurement of different liquid medium when laser diode off
57
4.6 Histogram graph for voltage measurement of different liquid medium when laser diode on
58
4.7 This picture show the fluctuated signal when air pump filter was switch on and produce continues bubbles
59
CHAPTER 1
INTRODUCTION
1.1.
Background of The Project2
This project is entitled ‘Optical Process Tomography System for Bubbler Detector in Liquid Medium’. The main objective of this project is to build a hardware that can detect the flow of gas bubble in liquid medium. Bubble detectors already invented and sell in market at high price. Most of the bubble detector that sold in market implement video camera as their receiver and transmitter and have complexity data transfer and data captured. This situation result for the high cost and high maintenance for this product.
This project will represent a new invention of bubble detector using Couple Charge Device as receiver and laser diode as transmitter. The different in this project compare to the previous researchers is the orientation of sensor and detector. Usually, the concept of tomography system placed the sensor and detector at one straight line. But in this project it will introduce the new orientation of detectors and sensor. This project used principle of laser beam back projection and linear back projection algorithm for image reconstruction. This prototype also will be used for two different experiments which are to detect gas bubbles in transparent liquid (plain water) and gas bubbles or water droplet in opaque liquid (oil). Infrared laser diode will be used as a transmitter base on it high intensity source of light to detect gas bubbles or water droplet in opaque liquid.
3
1.2.
Objective of The ProjectThere are five objectives that this project needs to will achieve. The main objective for this project is to develop an optical tomography system for bubbles detection in liquid medium using couple charge device linear sensor as receiver and infrared laser diode as transmitter.
The second objective for this project is to do an experiment using transparent liquid to detect air bubbles flowing up in the pipeline. Gas bubble will be inject at the bottom of the pipeline that having a flow of transparent liquid (plain water).This second objective also want to prove that air bubbles in transparent liquid is easily can be detected using optical tomography system.
4
1.3.
Problems StatementsAccording to the previous study, bubble detectors already being developed using couple charge device linear sensor as receiver and infrared used variety type of source of light as transmitter. Unfortunately from the study show that this bubbles detector only effective to detect gas bubbles in transparent liquid rather than opaque liquid. Optical process tomography easily can detect gas bubbles flow in transparent liquid but hard to detect gas bubbles or water droplets in opaque liquid such as oil. Oil considered too opaque for visible radiation. The range for visible light wavelength is in between 350 nanometres to 740 nanometres. This range is visible light range for human eyes. Some research show that infrared spectrum have the capability to detect water droplet or gas bubbles in oil. It is because it has high intensity of source of light. This project wants to prove that infrared spectrum is the best choice to apply as transmitter for bubble detector.
There are many types of bubbles detector in today’s market. Unfortunately the price for bubbles detector can reach until RM 20 000.00.This price including data acquisition system and its software. Most of the bubbles detector use video camera and complex circuit for data capture and data transfer signal. This project also aims to produce low cost bubble detector and the performance still can be accepted for industrial stage.
1.4.
Scope of the Project5
The main scope for this project is to analyze and design the hardware. Process tomography consists of four main parts where there are sensor, detector, and circuit for data transfer and computer software for image reconstruction. The design for this prototype is based on the basic block diagram for tomography system. The specification of each component also needs to analyze before implement to avoid any problems occurred in the future.
After the design stage completed, the hardware will be developed based on the idea and the analysis of the design stage. The hardware is developing according to the schematic diagram that had been produce. In this stage all the criteria for all components must be full fill to make sure it can work properly. The orientation of the sensor is the most important part to check because this is the part for detects gas bubbles flow in the pipeline.
Once the hardware is ready to be tested, first experiment will be take place to check the performance of the hardware. The first experiment is to check gas bubbles in plain water. Plain water will be flow through glass pipeline and gas bubbles will be injected at the bottom of the pipeline. The second experiment is to check the capability of infrared laser diode to detect gas bubbles in opaque liquid. In this case oil will be used for the experiment.
6
1.5.
Summary of WorksImplementation and works of the project are summarized into the flow chart as shown in the Figure 1.1 below.
7
The Gantt Chart in Table 1.1 and Table 1.2 show the detail of the works of project that had been schedule for the first semester and incoming this second semester.
Table 1.1: Gantt chart for semester 1
8
1.6 Expected Result
67
REFERENCES
1. http://en.wikipedia.org/wiki/Tomography
2. Abdul Rahim, R and K.S Chan. Optical Process Tomography System for Process Measurement Using Light Emitting Diode as a Light Source. Optical Engineering Vol. 43 No.5 : 2004
3. http://en.wikipedia.org/wiki/Computed_tomography 4. http://en.wikipedia.org/wiki/SPECT
5. http://en.wikipedia.org/wiki/MRI
6. http://en.wikipedia.org/wiki/Electron_tomography 7. http://en.wikipedia.org/wiki/Atom_probe
8. Adie bin Mohd Kafei, Sallehuddin Ibrahim, Mohd Amri Bin Mohd Yunus
.Imaging Concentration Profile Using Laser Based Tomography.
International Conference on Control, Instrumentation and Mechatronic s Engineering :2007
9. http://www.tomography.com/pdf/ecttechov.pdf
10.http://en.wikipedia.org/wiki/Optical_coherence_tomography
11.J.M. Schmitt. Optical Coherence Tomography. IEEE Journal of Selected Topic In Quantum Electronic :1999
12.http://www.biophotonics.uni-hannover.com 13.http://spie.org
14. Ruzairi Abdul Rahim, Ng Wei Nyap, Mohd. Hafiz Fazalul Rahiman.
Hardware Development of Ultrasonic Tomography for Composition Determination of Water and Oil Flow. Sensors & Transducers Journal, Vol.75, Issue 1:January 2007
15.http://www.webmd.com/a-to-z-guides/magnetic-resonance-imaging-mri 16.www.nelsonresearchinc.com/Work-Bubbles
68
18.Y.MD Yunos, Abdul Rahim R, and R.G Green .2008. Initial Result on Measurement of Gas Volumetric Flow Rate in Gas /Liquid Mixtures Using Linear CCD Sensors. Jurnal Teknologi
19.http://science.hq.nasa.gov/kids/imagers/ems/infrared.html 20.http://patentstorm .us/patents
21.Mariani Idroas, Robert Garnett Green and M.Nasir Ibrahim. Optical
Tomography System Using Couple Charge Device Linear Sensor. Journal
of Electrical Engineering University Technology Malaysia: June 2006. 22.Williams,R.A and M.S Beck.. Process Tomography, Principles
,Techniques and Application. Butterworth-Heinemam
23. W.Earnst .Creating A System to Analyze Air Bubbles in Liquid. Joanneum Research,National Instrument.
24.http://patentstorm .us/patents
25.Juliza Binti Jamaludin. Hardware Development Using Couple Charge Device and Linear Sensor Laser Beam Projection. Thesis for Bachelor Degree, Universiti Teknologi Malaysia, Skudai:2008
26.Iovine John. PIC Microcontroller Project Book. 2
nd
Edition Mc Graw-Hill: 2000.