Jurnal Teknologi, 44(C) Jun 2006: 77–88 © Universiti Teknologi Malaysia
OPTIMIZATION OF CE SEPARATION OF ROXARSONE AND SEVERAL ARSENIC COMPOUNDS
JAFARIAH JAAFAR1, RAHMALAN AHAMAD2, NASRULLAH3 & ZILDAWARNI IRWAN4
1,2,3&4
Department of Chemistry, Faculty of Science, Universiti Teknologi Malaysia, 81310 UTM Skudai, Johor, Malaysia
Abstract. Capillary electrophoresis with direct UV detection was used for the separation of arsenite As(III), arsenate As(V), monomethylarsonic acid (MMA), dimethylarsinic acid (DMA), phenylarsonic acid (PAA), ρ-arsanilic acid (ρ-ASA) and roxarsone (3-NHPAA). The separation was achieved in a fused silica capillary using a high sensitivity detection cell with diode array detector. A 15 mM phosphate buffer was used as the background electrolyte. The influence of electrolyte pH, applied voltage and wavelength were investigated in this research where the optimum conditions obtained were at pH 6.0, 25 kV voltage and 191 nm detection wavelength. The optimized method provided a limit of detection of 0.193 mg/L for As(III). Reproducibility of the analytes was in the range of 4.6%-10.5% RSD.
Keywords: Arsenic compound, roxarsone, capillary electrophoresis
Abstrak. Elektroforesis rerambut dengan pengesanan ultralembayung digunakan bagi pemisahan arsenit As(III), arsenat As(V), asid monometilarsonik (MMA), asid dimetilarsinik (DMA), asid fenilarsonik (PAA), asid ρ-arsanilik (ρ-ASA) dan roksarson (3-NHPAA). Pemisahan tercapai menggunakan kapilari silika terlakur dengan sel pengesan berkepekaan tinggi dan pengesan susun atur diod. Larutan penimbal 15 mM fosfat digunakan sebagai elektrolit latarbelakang. Pengaruh pH elektrolit, keupayaan yang dikenakan dan panjang gelombang pengesanan dikaji dengan nilai optimum diperoleh pada pH 6.0, keupayaan 25 kV dan panjang gelombang pengesanan pada 191 nm. Kaedah yang telah dioptimum ini memberi had pengesanan 0.193 mg/L bagi As(III). Kebolehulangan bagi semua analit adalah di antara julat 4.6%-10.5% RSD.
Kata kunci: Sebatian arsenik, roksarson, elektroforesis rerambut
1.0 INTRODUCTION
rapidly excreted unchanged, resulting in elevated concentrations of roxarsone in poultry litter [1-3]. Generally, the litter is used as fertilizer on agricultural fields. Soil amended with arsenic manure could result in a localized arsenic pollution and becomes a source for arsenic contamination of surface and groundwater.
Current interest in the determination of different species of arsenic in the environment is due to the fact that physiological and toxic effects of arsenic are connected with its chemical forms. The toxicity of different arsenic species varies in the order arsenite > arsenate > monomethylarsonate (MMA) > dimethylarsinate (DMA) while organoarsenics are generally considered to be non-toxic. The techniques used for the detection of arsenic species in environmental and biological samples should be sensitive and selective [4-8]. The rapid analysis of samples to prevent species conversion is also important. Inductively coupled plasma-mass spectrometry (ICP-MS) has become a desired technique in arsenic analysis that provides ultra sensitivity, multi element capability and can be combined with a separation technique for speciation analysis [4]. Another common technique used in arsenic speciation is hydride generation-atomic fluorescence spectrometry due to its high sensitivity, low detection limit and high selectivity [5]. However, not all arsenic species form hydrides and decomposition techniques are usually required. A combination of analytical techniques is often necessary to achieve both selectivity and sensitivity. The direct coupling of a separation device to various detection instruments will improve specificity and detection for individual arsenic species. Hyphenated techniques allow for the possible separation of all soluble species in the sample and selective detection at small concentrations.
The purpose of this work is to perform a fast separation of arsenic species in a single CE run by optimizing the pH, voltage and the wavelength for the direct UV detection using an uncoated capillary and a high sensitivity detection cell. The high sensitivity detection cell was used to improve the detection limit. The arsenic compounds studied were the organoarsenic compounds used as animal feed additives and the inorganic arsenic, and the structures are listed in Figure 1.
2.0 EXPERIMENTAL 2.1 Instrumentation
All electrophoresis experiments were performed on an Agilent Technologies HP3D Capillary Electrophoresis instrument (Germany). Separations were performed using a fused silica capillary (Polymicro Technologies, Phoenix, Arizona, USA) 75 µm ID × 80.5 cm (effective length 72 cm) and detected on a high sensitivity detection cell. The column temperature was set at 25°C. On-column UV diode-array detection was used, operated at various wavelength with a bandwidth of 4 nm. Samples were injected hydrodynamically (2.5 × 10³ Pa) for 5 s from the anodic end and the separation
voltage was 15 kV. The pH of all solutions was measured with the aid of Hanna Instrument pH meter. Data were acquired with a Hewlett Packard ChemStation.
NO2
O
OH OH O
H As
O
OH O
H As
O
NH OH O
H As
2
Rosarsone [3-NHPAA]
Phenylarsonic acid [PAA]
p-Arsanilic acid
[p=ASA]
Arsenite [As(III)]
Arsenite [AS(V)]
Monometrhylarsinic acid [MMA]
Dimethylarsinic acid [MMA]
As OH
OH
OH O
O
H As OH
OH
O
O
H As
OH H
C 3
O
O
H As CH3
H
C 3
Before analysis, the capillary was flushed with 0.2 M NaOH for 10 min, followed by deionized water and buffer for 5 min, respectively. Between runs, the capillary was rinsed with buffer and deionized water for 2 min. Thiourea was used as the EOF marker.
2.2 Chemicals
A standard stock solution of 1000 mg As/L As(III) was prepared by dissolving arsenic trioxide, As2O3 in 0.1 M NaOH and then adjusted with 1% HCl to pH 6. Standard stock solutions (1000 mg As/L) of As(V), MMA and DMA were prepared by directly dissolving Na2HAsO4.7H2O, CH3AsO3HNa.1.5H2O and C2H6AsO2Na in deionized water. ρ-ASA, 4-NHPAA and roxarsone were also prepared in deionized water. All of the reagents were of analytical grade. These solutions were stored in the dark at less than 4°C.
Sodium dihydrogen phosphate was used to prepare 15 mM phosphate buffer, which was adjusted with 0.1 M NaOH to the desired pH. The electrolyte solution was prepared weekly. Before use, the buffers were filtered through 0.45 µm filter and degassed by an ultrasonic system. All the solutions were prepared in 18 MΩ water from a Milli-Q system (Millipore, Bedford, MA, USA).
3.0 RESULTS AND DISCUSSION
3.1 Simultaneous Separation of Arsenic Compounds
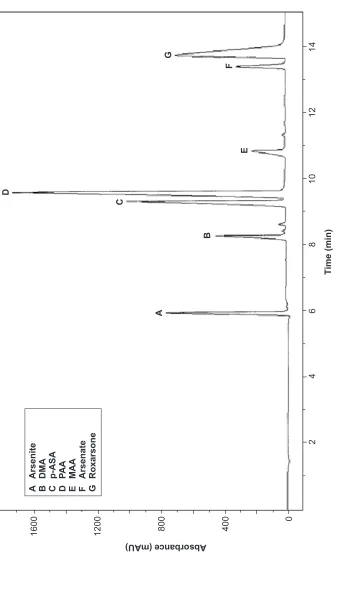
The separation of seven arsenic compounds were investigated in a 15 mM phosphate buffer solution with pH 6.0, 25 kV voltage and 191 nm detection wavelength. Concentration for inorganic and methylated arsenic compounds was 80 mg/L while the concentration for arylarsenic compounds was 40 mg/L. Electropherogram as shown in Figure 2 was recorded where the separation order obtained (arsenite, DMA, p-ASA, PAA, MMA, arsenate and roxarsone) is in good agreement with literature [10].
3.2 Effect of Wavelength
Figure 2
Electropherogram of a mixture of arsenic compounds in 15 mM phosphate at pH 6.0 and voltage 25 kV, concentration 80 mg/ L for inorganic and methylated arsenic (A, B, E, F) and 40 mg/L for organoarsenic compounds (C, D, G)
1600 1200 800 400
0
Absorbance (mAU)
2
Time (min)
10
8
6
41
2
1
4
A
B
C
D
E
F
G
A
Arsenite
B
DMA
C
p-ASA
DP
A
A
E
MAA
F
Arsenate
G
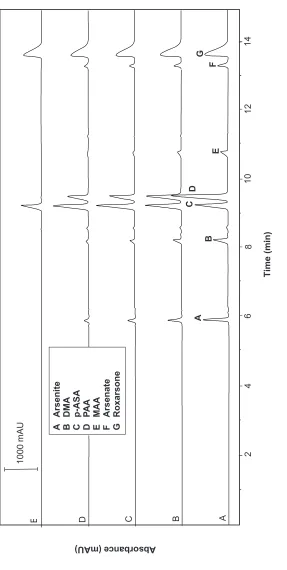
Figure 3
Electropherogram of a mixture of arsenic compounds in different wavelength: (A) 191 nm, (B) 194 nm, (C) 197 nm, (D) 200 nm and (E) 254 nm in 15 mM phosphate, pH 6.0 and voltage 25 kV
Absorbance (mAU)
Time (min)
E
C
D
E
12
14
F
G
10
B
8
A
4
2
C
D B A
1000 mAU
6
A
Arsenite
B
DMA
C
p-ASA
DP
A
A
E
MAA
F
Arsenate
G
wavelength, the detection sensitivity of the peaks were reduced significantly except for the roxarsone and p-ASA compounds as shown in Figure 3. Therefore, 191 nm has been selected as the optimum wavelength for the separation of arsenic compounds.
3.3 Electrophoretic Mobilities of the Analytes at Varying pH
In CZE, pH of the background electrolyte plays an important role in getting the best separation efficiency with shorter migration time. The pH of the electrolyte buffer affects the separation characteristic by influencing the electrophoretic mobility of the arsenic anions as well as the electroosmotic flow (EOF). All of the inorganic and organic arsenic compounds are anionic or neutral depending on the pH of the background electrolyte. The pH of the electrolyte and the pKa values influence the effective charge of the analytes. Deprotonation of the arsenic compounds will increase both the ionic charge and electrophoretic mobilities [10-13].
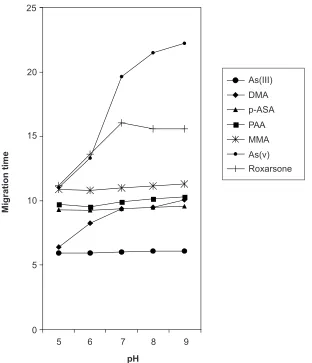
The influence of the pH of the electrolyte buffer on the separation of the seven arsenic species was investigated using a buffer solution of 15 mM phosphate. Over the pH range 5-9 examined, the migration times of each individual arsenic species increased with an increase of the buffer pH due to the increasing electrophoretic mobilities of all the analytes. Table 1 lists the migration time, t and electrophoretic mobilities, µeff of seven arsenic compounds at different pH values. Figure 4 shows the increasing migration times of the target analytes when the phosphate buffer solution changes from pH 5-9.
At pH 5 and 6, As(III) was detected earliest because under this pH, As(III) with pKa value of 9.3 is in a neutral state. The migration towards the cathode was followed by negatively charged DMA (pKa1 = 1.3), MMA (pKa1 = 3.6), p-ASA (pKa1 = 1.9) PAA (pKa1 = 3.6), As(V) with pKa1 value 2.3 and roxarsone (pKa1 = 3.5). These negatively charged analytes move towards the cathode because the EOF of the electrolyte is higher than the electrophoretic mobility. With increasing pH, the electrophoretic mobilities of all arsenic compounds increase and causes the migration times to increase.
Table 1
Separation data for arsenic compounds: migration times, t and electrophoretic mobilities,
µ Compounds pH 5 pH 6 pH 7 pH 8 pH 9 t µµµµµeff ××××× 10 –2 t µµµµµeff ××××× 10 –2 t µµµµµeff ××××× 10 –2 t µµµµµeff ××××× 10 –2 t µµµµµeff ××××× 10 –2 [min][min][min][min][min] [cm[cm[cm[cm[cm 22222 /Vmin]/Vmin]/Vmin]/Vmin]/Vmin] [min][min][min][min][min] [cm[cm[cm[cm[cm 22222 /Vmin]/Vmin]/Vmin]/Vmin]/Vmin] [min][min][min][min][min] [cm[cm[cm[cm[cm 22222 /Vmin]/Vmin]/Vmin]/Vmin]/Vmin] [min][min][min][min][min] [cm[cm[cm[cm[cm 22222 /Vmin]/Vmin]/Vmin]/Vmin]/Vmin] [min][min][min][min][min] [cm[cm[cm[cm[cm 22222 /min]/min]/min]/min]/min] EOF 5.865 5.859 5.900 5.890 5.915 As(III) 5.945 0.053 5.935 0.052 6.025 0.081 6.079 0.122 6.112 0.158 D M A 6.402 0.352 8.250 1.147 9.379 1.457 9.492 1.494 10.079 1.628 ρ -ASA 9.292 1.458 9.270 1.456 9.379 1.457 9.492 1.494 9.575 1.499 PA A 9.712 1.566 9.544 1.528 9.902 1.588 10.142 1.650 10.289 1.667 M M A 10.872 1.821 10.797 1.810 11.009 1.823 11.152 1.857 11.285 1.866 As(V) 11.029 1.851 13.310 2.255 19.639 2.748 21.482 2.857 22.205 2.580 Roxarsone 11.172 1.878 13.637 2.257 16.039 2.484 15.605 2.450 15.575 2.421 µapp
= total capillary length
×
effective capillary length / voltage
3.4 Effect of Applied Voltage
The applied voltage determines the migration time and separation efficiencies of the analytes. Figure 5 depicts the effect of applied voltage on migration time and separation efficiencies of the arsenic compounds in the voltage range from 10-25 kV at pH 6.0. Increasing the voltage resulted in shorter migration times, but also increased the baseline noise, resulting in poorer detection. It was found that the application of high voltages can result in higher Joule heating, which directly affected the separation efficiency [9]. Lower separation voltages, however, would increase the analysis time which in turn could cause peak broadening. Therefore, a voltage of 25 kV was found to be a good voltage to achieve high separation efficiency and short analysis time.
25
20
15
10
5
0
Migration time
5 6 7 8 9
pH
As(III)
DMA
p-ASA
PAA
MMA
As(v)
Roxarsone
Figure 4 Dependence of migration times of arsenic compounds from pH of background electrolyte
Figure 5
Electropherogram of a mixture of arsenic compounds at different voltage: (1) 15 kV, (2) 20 kV and (3) 25 kV (15 mM phosphate, temperature 25
°
C)
A
A
A
B
B
B
C
C
C
D
D
D
E
E
E
F
3
F
F
1
2
A
Arsenite
B
DMA
C
ρρρρρ
-ASA
DP
A
A
E
MAA
F
Roxarsone
30
25
20
15
10
5
Absorbance (mAU)
Time (min
)
3.5 Characteristic of Quantitative Analysis 3.5.1 Detection Limit
The detection limit of As(III) was determined by plotting the current responses (mAU) versus concentration (mg/L). From the calibration plot, the detection limit of As(III) obtained is 0.193 mg/L with a linear regression of 0.96. Only the detection limit of As(III) was determined because this is the most toxic species among the arsenic compounds, and the form that is most commonly found in contaminated water bodies. The detection limits of the other six arsenic compounds were not determined at this time.
3.5.2 Reproducibility
The reproducibility of peak areas and migration times were determined by injecting a standard solution of a mixture of seven arsenic compounds into the system under the optimum conditions. The relative standard deviations (RSD) of peak areas were in the range of 4.55-10.46% RSD. The results are shown in Table 2. The high reproducibility indicates that this method would be suitable for analysis of real samples [9,14,15].
Table 2 Reproducibilities of migration times and peak areas
Component R.S.D. of migration times R.S.D of peak areas (%)
Arsenite As(III) 3.04 4.55
Dimethylarsinic acid (DMA) 3.60 8.82
ρ-arsanilic acid (ρ-ASA) 4.28 5.65
Phenylarsonic acid (PAA) 4.42 6.90
Monomethylarsonic acid (MMA) 4.88 4.69
Arsenate As(V) 5.55 10.46
Roxarsone (3-NHPAA) 5.76 5.25
4.0 CONCLUSIONS
The optimized conditions for this CZE will be applied for the future analysis of real samples which is mainly poultry litters and agricultural soils amended with roxarsone manure.
ACKNOWLEDGEMENTS
The authors acknowledged the financial support from the Ministry of Science, Technology and Innovation Malaysia (IRPA RM 8 No 09-02-06-0037 EA 160).
REFERENCES
[1] Mandal, B. K., and K. T. Suzuki. 2002. Arsenic Round the World: A Review. Talanta. 58: 201-235. [2] Rutherford, D. W., A. J. Bednar, J. R. Garbarino, R. Needham, K. W. Staver, and R. L. Wershaw. 2003.
Environmental Fate of Roxarsone in Poultry Litter. Part II. Mobility of Arsenic in Soils Amended with Poultry Litter. Environ. Sci. Technol. 37: 1515-1520.
[3] Bednar, A. J., J. R. Garbarino, I. Ferrer, D. W. Rutherford, R. L. Wershaw, J. F. Ranville, and T. R. Wildeman. 2003. Photodegradation of Roxarsone in Poultry Litter Leachates. Science of the Total Environment. 302: 237-245.
[4] Jain, C. K., and I. Ali. 2000. Arsenic: Occurrence, Toxicity and Speciation Techniques. Water Res. 34: 4304-4312.
[5] Yin, X. -B., X. -P. Yan, Y. Jiang, and X. -W. He. 2002. On-line Coupling of Capillary Electrophoresis to Hydride Generation Atomic Fluorescence Spectrometry for Arsenic Speciation Analysis. Anal. Chem. 74: 3720-3725.
[6] Bednar, A. J., J. R. Garbarino, M. R. Burkhardt, J. F. Ranville, and T. R. Wildeman. 2004. Field and Laboratory Arsenic Speciation Methods and their Application to Natural-water Analysis. Water Res. 38: 355-364.
[7] Gil, E. P., P. Ostapczuk, and H. Emons. 1999. Determination of Arsenic Species by Field Amplified Injection Capillary Electrophoresis after Modification of the Sample Solution with Methanol. Anal. Chim Acta. 389: 9-19.
[8] Gong, Z., X. Lu, M. Ma, C. Watt, and X. C. Le. 2002. Arsenic Speciation Analysis. Talanta. 58: 77-96. [9] Guo, X., Z. Wang, and S. Zhou. 2004. The Separation and Determination of Nitrophenol Isomers by
High-Performance Capillary Zone Electrophoresis. Talanta. 64: 135-139.
[10] Sun, B., M. Macka, and P. R. Haddad. 2002. Separation of Organic and Inorganic Arsenic Species by Capillary Electrophoresis Using Direct Spectrophotometric Detection. Electrophoresis. 23: 2430-2438. [11] Sun, B., M. Macka, and P. R. Haddad. 2004. Speciation of Arsenic and Selenium by Capillary
Electrophoresis. J. Chromatogr. A. 1039: 201-208.
[12] B’Hymer, C., and J. A. Caruso. 2004. Arsenic and its Speciation Analysis using High-Performance Liquid Chromatography and Inductively Coupled Plasma Mass Spectrometry. J. Chromatogr. A. 1045: 1-13. [13] Greschonig, H., M. G. Schmid, and G. Gubitz. 1998. Capillary Electrophoretic Separation of Inorganic
and Organic Arsenic Compounds. Fresenius J. Anal. Chem. 362: 218-223.
[14] Canals, I., E. Bosch, and M. Roses. 2002. Prediction of the Separation of Phenols by Capillary Zone Electrophoresis. Anal. Chim. Acta. 458: 355-366.