Transactions of the 17th International Conference on
Structural Mechanics in Reactor Technology (SMiRT 17) Prague, Czech Republic, August 17 –22, 2003
Paper # G02-5
Assessment of Geometry and Size Effects on the J
R-
∆
a Curve with a Continuum
Ductile Damage Model
Michel B.1)
1)DER/SERI/LFEA CEA de Cadarache 13108 St-Paul-lez-Durance France
ABSTRACT
This study concerns defect assessment criteria to prevent plastic instability under a ductile tearing mechanism. For industrial applications defect assessment methods are mainly based on the JR-∆a curve. Geometry and size effects on the JR
-∆a curve have been shown on laboratory specimens and are mainly due to the crack tip stress triaxiality level for ductile tearing. Many authors have quantify the constraint effect with a local approach based on a continuum ductile damage model (like the Gurson model for instance). However, these applications are often limited to laboratory type specimens, and the identification procedure needs complex tests on notched specimens with a high stress triaxiality level.
The aim of this study is to proposed a simplified simulation procedure based on a continuum damage model for an evaluation of the constraint effect. The ductile rupture mechanism is decomposed in three steps : micro voids nucleation, voids growth and voids coalescence. Nucleation is based on an empirical law, where fraction void rate is proportional to plastic strain rate. Voids growth rate is explicitly defined using the Gurson model. Voids coalescence is based on the competition between damage softening and plastic hardening, using the limit load model of Thomason. In our approach, there are only two parameters in the model: one for nucleation rate, and the other one for the undamaged material hardening curve. Then, results of a smooth tensile test specimen are enough for the model identification procedure. In the latter, conventional rupture stress and conventional rupture strain in the minimal section are used as error criteria.
Tearing simulation is based on a Finite Element computation with an explicit coupling between behaviour and damage models. A validation of the proposed approach is presented for CT and tubular specimens made of ferritic steel at 300°C. Geometry and size effects on the simulated JR-∆a curve are in good agreement with experimental results. Finally, tearing
simulations are used as "Numerical Experiments" for a discussion on extrapolated situations like cyclic loading.
KEYWORDS: JR – ∆a curve, CT specimen, tubular specimen, tearing simulations, constraint effect, complex loading, finite
element modeling
INTRODUCTION
This study concerns defect assessment criteria to prevent plastic instability under a ductile tearing mechanism. For industrial applications defect assessment methods are mainly based on the JR-∆a curve. Geometry and size effects on the JR
-∆a curve have been shown on laboratory specimens and are mainly due to the crack tip stress triaxiality level for ductile tearing. Many authors have quantify the constraint effect with a local approach based on a continuum ductile damage model (like the Gurson model for instance). However, these applications are often limited to laboratory type specimens, and the identification procedure needs complex tests on notched specimens with a high stress triaxiality level. The aim of this study is to proposed a simplified simulation procedure based on a continuum damage model for an evaluation of the constraint effect, and also to check the validity of a global criteria under complex loading (mixed mode, cyclic or thermo-mechanical lading).
In a first part, the model formulation and its background are presented. Parameters identification on a smooth tensile test specimen is detailed, and the model capacity to represent necking is discussed. In a second part, tearing simulations at 300°C are proposed for a CT specimen made of ferritic steel. The Finite Element prodecure is presented, and simulated results are compared to experimental ones. Finally, the use of "Numerical Experiments" for defect assessment on extrapolated situations is discussed.
DUCTILE DAMAGE MODEL
includes just nucleated voids and growing voids. One material parameter Vg is introduced in the empirical nucleation law.
Ductile plastic growth rate is derived from the Gurson model [1] without Tveergard's modification [2], as the latter is consistent with the Gurson's yield surface not used in our case. Equation (2) is based on the limit load model of Thomason [3]. Damage rate in equation (1) is not derived from the yield surface (2), and can not be considered as the first invariant of the plastic strain tensor as it is the case for ductile plastic growth rate associated to the Gurson yield surface. In order to simplify the yield surface equation we don't use a self consistent approach, as we believe that it has a second order effect on mechanical fields computation for tearing simulation. A second parameter n is introduced in the undamaged material hardening curve with equation (3). The latter is defined for plastic strain greater than 1%, as damage softening effect is considered as negligible for lower strain levels. The rupture is defined as f=1 using equation (2); for practical application a critical value of 0.9 is used to avoid numerical problems for tearing simulation.
(1) p
eq m p
g
.
).
d
2
3
sinh(
.
f.
2
3
d
.
V
df
ε
σ
σ
+
ε
=
(2)
σ
eq−
(
1
−
f
).
σ
o(
ε
p)
=
0
Where εp is the equivalent plastic strain, f is the damaged void fraction, 3.σm is the first invariant of the stress tensor, σeq
is the Von Mises equivalent stress, Vg is a material parameter and σo(εp) is the hardening curve of the undamaged material.
(3)
σ
o(
ε
p)
=
C
.
ε
p1/nWhere C is computed with rational tensile curve at εp=1% and n is a material parameter.
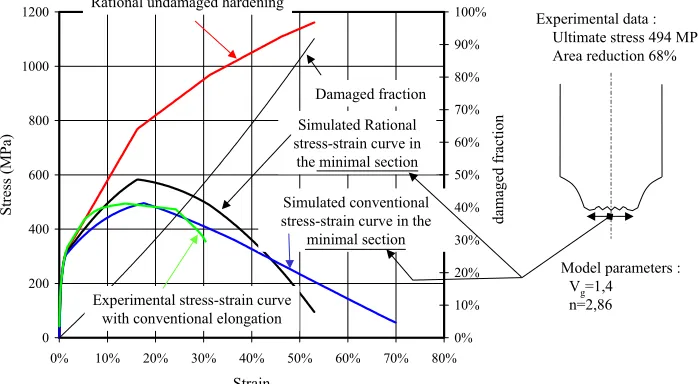
To identify Vg and n the only results of a tensile test on a smooth specimen are needed. These two parameters are fitted with a numerical integration of equations (1) and (2) versus plastic strain. The optimisation process is based on an error criterion using the ultimate tensile stress and the conventional area reduction in the rupture plane. Identification results for a ferritic steel at 300°C are detailed on Fig. 1. As presented on the latter, a set of parameters (Vg=1,4 ; n=2,86) lead to a conventional simulated stress-strain curve, for the minimal section, with an ultimate stress of 494 MPa and an area reduction of 68%. Discrepancies between simulated and experimental conventional curves are due to the fact that the former is based on mean strain in the minimal section, as the latter is based on specimen elongation. As far as elongation includes a geometry effect due to necking, a direct comparison is not possible. However, the ratio between experimental elongation and simulated area reduction, for the same stress level, is in good agreement with strain localisation phenomenon due to necking.
200 400 600 800 1000 1200
Stress (MPa)
20% 30% 40% 50% 60% 70% 80% 90% 100%
damaged fraction
Rational undamaged hardening
Simulated Rational stress-strain curve in
the minimal section
Simulated conventional stress-strain curve in the
minimal section Damaged fraction
Experimental data : Ultimate stress 494 MPa Area reduction 68%
Model parameters : Vg=1,4
As presented in equation (1), we don't introduce fitting parameter to accelerate damage rate (see Fig. 1) as proposed in the Tvergaard and Needleman modification [4] of the Gurson's model. This acceleration factor is not physical, because it modifies constitutive equations to fit abrupt failure point, as observed on the conventional stress-strain curve based on elongation, which is in fact linked to a geometrical effect. To simulate strain localisation in a tensile test, we should take into account instabilities due to statistical distribution of nucleation damage rate. However, as presented on Fig. 1, there is no need of a detailed simulation of the necking phenomenon to have a good assessment of maximum load and area reduction in minimal section for a tensile test.
TEARING SIMULATION
The objective is to simulate tearing, using the continuum damage model presented in previous section, in order to validate the numerical assessment of the fracture toughness. The simulation is based on finite element computations, with an explicit coupling of damage and constitutive equations (1) and (2) in order to improve computation times. The mesh characteristic size on the crack path is set at 0.25 mm for the tested ferritic steel at 300°C. Tearing is simulated with softening mechanical properties of cracked element, where the damaged fraction is greater than 0.9.
CT Specimens
Tearing simulations have been achieved for two CT specimens tested in the IPIRG program [5] (Table 1). In both cases material is a ferritic steel at 300°C. For the CT2 specimen, the conventional area reduction after rupture (A%) was not available. Then, a postulated value of 90% was used in order to be consistent with yield stress and ultimate stress when we compare CT1 and CT2 mechanical properties.
Normalized dimensions Yield
strength Ultimatestrength reductionArea Model parameter
Specimen W (mm) Bnet (mm) ao (mm) R0.2% (Mpa) Rm (Mpa) A (%) Vg n
CT1 20.32 5.512 10.68 193 494 68 1.4 2.86
CT2 76.15 28.6 41.2 244 578 90 1 3.75
Table 1 : Geometrical and mechanical properties of CT specimens.
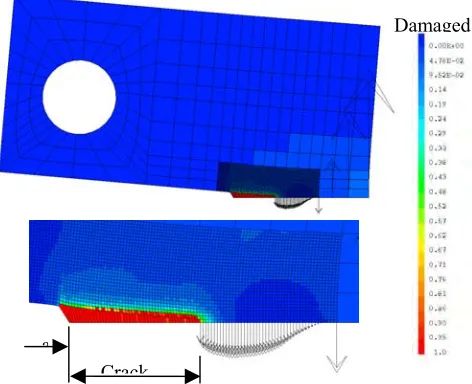
Fig. 2 : Tearing simulation on CT2 specimen with a finite element model a
Crack
Tearing simulation principle using a finite element model is presented on
Fig. 2. On the latter, damaged fraction has reached its maximal value in cracked element, where the absence of nodal forces is due to a softening effect introduced to simulate crack propagation.
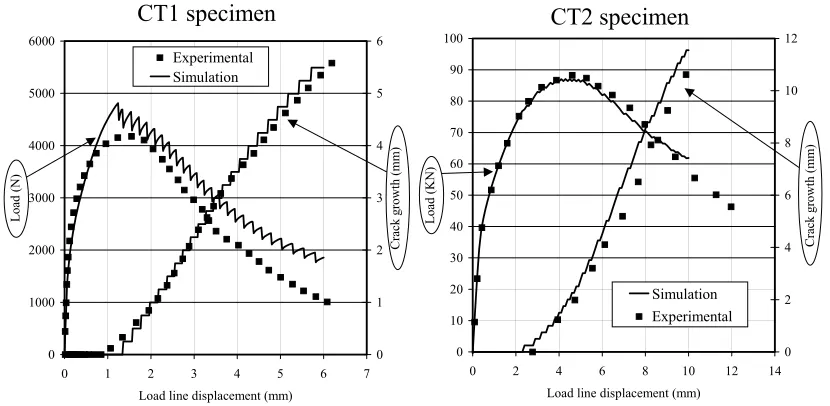
Fig. 3 : Experimental and simulated results for tearing tests of specimens CT1 and CT2
Tearing simulation results are compared to experimental ones on Fig. 3. As presented on the latter, crack growth assessment, versus load line displacement, is in a very good agreement with experimental results. Maximum load assessment is also in good agreement for CT2 specimen, as it's a little bit over estimated (approximately 10%) for CT1 specimen. This lower precision level for the load-displacement curve, is due to the fact the characteristic mesh size (0.25 mm) is more significant compare to the CT1 dimensions. Then, the explicit coupling, between damage and constitutive equations, lead to a less accurate estimation of stress level in the ligament. These results lead us to conclude that the proposed model enabled a detailed assessment of tearing properties for crack initiation and growth on CT specimens, with the only results of a tensile test on smooth specimen. Moreover, the characteristic length, used for refined mesh around the crack tip, is not sensitive to size effects and seems to be an intrinsic material parameter. To check this, tearing assessment on a tubular geometry will be proposed in next section
Through Wall Crack in a Tubular Geometry
In order to check that the proposed model can assess geometry and size effects on fracture toughness properties, a tearing simulation for a through wall crack located in a straight pipe under four point bending is achieved. In this new application, all experimental results are also extracted from the IPIRG program [5] database. Main geometrical characteristics and material properties are described in Table 2.
External
diameter Thickness Initial cracklength R0.2% (Mpa) Rm (Mpa) A (%) Vg n
114.3 mm 8.89 mm 122,5 mm 193 494 68 1.4 2.86
Table 2 : Geometrical and mechanical properties of straight pipe specimen under four point bending.
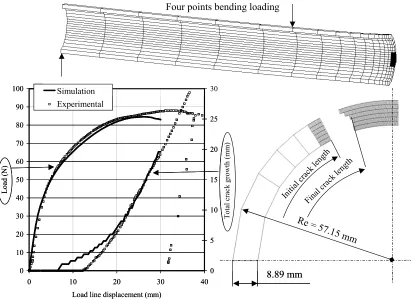
The finite element model, presented on Fig. 4, used a refined mesh around the crack tip with the same characteristic
0 10 20 30 40 50 60 70 80 90 100
0 2 4 6 8 10 12 14
Load line displacement (mm)
Load (KN)
0 2 4 6 8 10 12
Crack growth (mm)
Simulation Experimental
0 1000 2000 3000 4000 5000 6000
0 1 2 3 4 5 6 7
Load line displacement (mm)
Load (N)
0 1 2 3 4 5 6
Crack growth (mm)
Experimental Simulation
Fig. 4 : Experimental and simulated results for tearing test on a straight pipe under four point bending.
Geometry and size effect on the JR-∆a curve
Results of CT1 specimen and straight pipe, made of the same material, are used to quantify the sensitivity of the JR-∆a to
geometry and size effects. J values are respectively computed with equation (4) for CT specimen and tabulated expressions of reference [6] for the straight pipe.
(4)
(
)
a W . B U . W a 1 . 522 . 0 2 J − − + =
Where a is the current crack depth and U the area under the load-displacement curve.
Numerical and experimental JR values computed for CT1 specimen and straight pipe are compared on Fig. 5. There is a
good agreement between simulation and experimental results, unless for crack initiation in the straight pipe specimen. In the latter, discrepancy between J values at 0.2 mm of crack growth is due to the fact that crack initiation occurred sooner in the simulation. The validity of experimental crack initiation displacement is discussed above, and should warn us to be careful how to use tearing initiation experimental results established on a complex geometry. In fact, the much higher experimental JR values for crack initiation in the straight pipe don't seem obvious to explain with a loss of crack tip triaxiality due to large
scale plasticity. On the contrary, a larger crack size will enhanced elastic stress intensification and will promote crack initiation at an early stage of plasticity, where crack tip stress fields are comparables in CT and straight pipe specimens. The interesting point is that simulation enables to assess the sensitivity of the global criterion to geometry and size effects, with for instance a ratio greater than 2 between JR values in straight pipe and CT specimen, for significant crack growth and large
scale plasticity. These results illustrate how simulated experiments could help to improve a global defect assessment method. Four points bending loading
8.89 mm Re = 57.15 mm 0 10 20 30 40 50 60 70 80 90 100
0 10 20 30 40
Load line displacement (mm)
Load (N) 0 5 10 15 20 25 30
Total crack growth (mm)
Simulation Experimental
Initia
l crack
leng th Fina l cra ck le ngth
Four points bending loading
8.89 mm Re = 57.15 mm 0 10 20 30 40 50 60 70 80 90 100
0 10 20 30 40
Load line displacement (mm)
Load (N) 0 5 10 15 20 25 30
Total crack growth (mm)
Simulation Experimental
Initia
l crack
Fig. 5 : Geometry and size effect on the JR-∆a curve.
TEARING UNDER COMPLEX LOADING
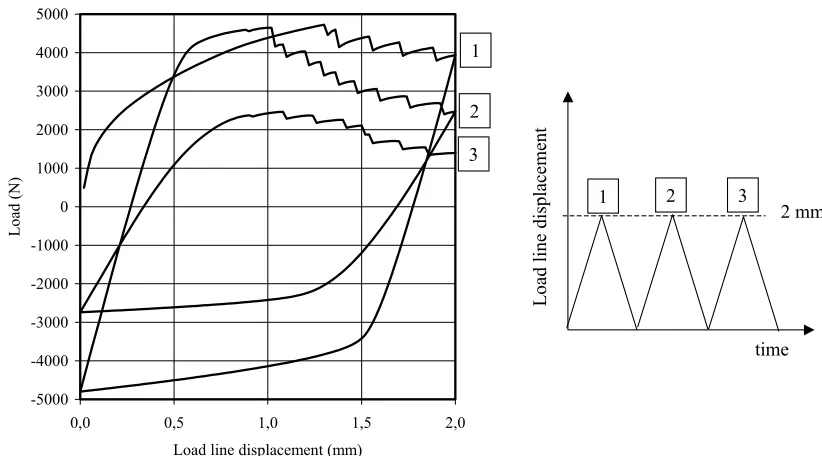
Tearing simulation under cyclic loading is presented on Fig. 6. On the latter, imposed load line displacement is also plotted versus time. As shown on Fig. 6 tearing occurs at each cycle, and tearing initiation displacement level decrease versus the number of cycles. The total amount of crack propagation for 3 cycles of 2 mm is 4.5 mm, as it is 1 mm for the first monotonous displacement. This simulation shows that crack growth would be under estimate if the cyclic loading was replaced by a monotonous one based on the maximal displacement level. This difference is mainly due to plasticity occurring in the reverse loading stage, which leads to an enhancement of plasticity and damage at crack tip during the following opening cycle, without increasing load line displacement level.
1,E+02 1,E+03 1,E+04
0 1 2 3 4 5 6
Crack growth (mm)
JR
(KJ/m
2 )
Experimental CT1 specimen Experimental straight pipe Simulation CT1 specimen Simulation Straight pipe
-2000 -1000 0 1000 2000 3000 4000 5000
Load (N)
Load line
disp
lace
ment
2 mm
1 2 3
1
2
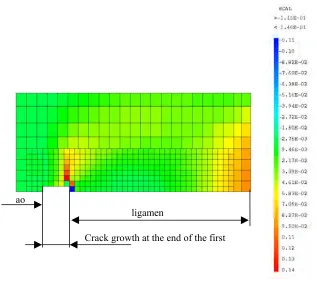
Concerning damage rate under compressive stress state, during reverse loading, the proposed formulation (1) lead to a competition between nucleation rate and void growth rate. The former is steel positive, as it is linked to equivalent plastic strain, when the latter is negative under compressive stress state. The damaged fraction variation during the first reverse cycle is represented on Fig. 7. Compressive stress state leads to a decreasing damage level only in the crack tip element, as damaged fraction increases slightly elsewhere. However, in this case, the more significant effect due to cyclic loading is mainly linked to stress field modification during the reverse cycle, and few to damage variation.
For a quantitative use of the model under complex loading more validation should be achieved, in order to check damage rate assessment under compressive stress state or pure shearing for instance. However, this first application illustrates the capacity of the model to provide "Numerical Experiments" on extrapolated situations.
Fig. 7 : Damaged fraction variation during the first reverse loading stage.
CONCLUSIONS
In this study a tearing simulation procedure using finite element computations has been proposed. It is based on a continuum damage model, where ductile rupture mechanism is decomposed in three steps : micro voids nucleation, voids growth and voids coalescence. The specificity of our approach is to use only two parameters in the model, and to enable identification with the only results of tensile test on a smooth specimen. The triaxility effect is not fitted, but is introduced in physically based equations of the model. The identification procedure has been detailed for a ferritic steel at 300° and lead to a quasi unique set of parameters. After identification the proposed model assesses all the results of a smooth tensile test, such as conventional rupture stress and conventional rupture strain in the minimal section. Moreover, no fitted function is introduced to fit the abrupt failure point observed in a tensile test, and a physical description of the necking phenomenon is proposed.
Tearing simulations, based on a Finite Element computation with an explicit coupling between behaviour and damage, have been presented. An intrinsic characteristic mesh size of 0.25 mm has been defined on one tearing test. Tearing assessments are in a very good agreement with experimental results for CT and straight pipe specimens made of ferritic steel at 300°C. The proposed model enables to assess geometry and size effects on the J -∆a curve, and to estimate material
ligamen ao
toughness with the only results of a smooth tensile test. Finally, the use of tearing simulations to validate defect assessment methods on extrapolated situations has been illustrated in the case of cyclic loading.
REFERENCES :
1. GURSON A.L., "Continuum theory of ductile rupture by void nucleation and growth: part I, yield criteria and flow rules for porous ductile media", J. of Eng. Mat. and Tech., vol. 99, 1977.
2. TVERGAARD V., "Influence of voids on shear band instabilities under plain strain conditions", Int. Journal of Fracture, vol. 17, 1981.
3. THOMASON P.F., "Ductile fracture of metals", Pergamon press, Oxford, UK, 1990.
4. TVERGAARD V. and Needleman A., "Analysis of the cup-cone fracture in a round tensile bar", Acta Metallurgica, Vol 32, 1984.
5. HOPPER A and al., "The Second International Piping Integrity-Research Group (IPIRG-2) Program", NUREG/CR 6452 BMI – 2195, 03-1997.