Analysis of the Effects of External Detonations on Piping Systems
B. No Roy l), George A. Antaki 2)
1) Westinghouse Safety Management Solutions, Aiken, SC 2) Westinghouse Savannah River Company, Aiken, SC ABSTRACT
Nuclear facilities designed to confine explosion blasts and any associated release of radioactive particles must consider not only the integrity of the building structure but also of penetrating pipes, tubing and distribution systems. This is to assure that no unaccounted leak paths leading to release of radioactivity exist. This paper presents a method for analyzing the effects of external detonations on piping, tubing and electrical conduit systems in an old existing facility.
The structural evaluation effort faced quite a few challenges from both analytical and scoping point of view, viz., - Decades old facility, and ensuing difficulties in obtaining baseline or as-built design information.
- Piping/conduits of different sizes, routing, fittings, support designs and material (including PVC, Copper etc.) - High blast peak pressures(in the thousands of psi range) with multiple explosive-to-target distances
- Selection of appropriate failure modes and analysis criteria for components, fittings and supports
Distance dependent blast pressure impulses (shape, duration, peak value) and component (piping/conduits etc.) spans and properties were evaluated to establish load regimes (impulsive, quasi-static, dynamic). Maximum deflection, stress/strain and support loads were computed and compared with limiting capacity (obtained primarily from review of test data on failed components) to determine survivability of components. Failed components and associated leak areas were estimated, and leak area optimization with cost-effective improvements were recommended.
INTRODUCTION
This paper analyzes the effects of blast pressure on wall mounted piping, tubing and conduits and draws conclusions regarding the failure of these systems under the anticipated blast loading conditions in an existing nuclear facility. Piping analyzed includes standard carbon steel pipe, copper tubing, plastic PVC pipe, and steel electrical conduits ranging in size from 3/8" to 2".
M E T H O D O L O G Y M e t h o d s o f A n a l y s i s
From the given the pressure impulse (shape, duration and peak pressure), and known pipe properties, the load regime is established: impulsive (pressure impulse much shorter than natural period), quasi-static (pressure impulse longer than natural period) or dynamic (intermediate between impulsive and quasi-static).
Then utilizing the specific impulse (the area under the pressure time-history curve, see Figure 1) the maximum deflection of pipe spans, the stress/strain, and the reaction load on supports are calculated.
The calculated deflections, stresses/strains and support reactions are then compared to piping and support capacities to determine whether the pipe or supports will fail.
I m p u l s e L o a d R e g i m e i
Piping, represented as a series of beam spans, is dynamically loaded by a pressure impulse from an external blast. The span response will depend on the parameter 03h, the product of the natural pulsation 03 of the span by the blast impulse duration h [1, p.277].
03ti > 40, quasi-static regime [ 1, p. 278]: The dynamic load lasts significantly longer than the natural period of the span. The span has time to deflect while the impulse pressure is applied, and the deflection will reach up to twice the static deflection under the same side pressure.
03h < 0°4, impulsive regime [ 1, po 278]: The blast is applied and removed so quickly that the span has little time to deflect before the blast pressure dissipates. The span deflection is much smaller than the static deflection under the same side pressure.
The natural pulsation of a pipe span of natural frequency f is 03 = 2~f, where
f = - ~ ~ ~ [parameters defined in Nomenclature section]
The applied specific impulse "i" is listed in Table 1-1, based on best estimates of the areas under the pressure time-history curves (Figure-1). A fourth, hypothetical case, for a small pressure impulse, has been added for information.
SMiRT 16, Washington DC, August 2001
Paper # 1946
® ,~,=1
r~ r~
6 0 0 0
5 0 0 0
4 0 0 0
3000
2000
: l O 0 0
0
0.0
I i I I I I 1 I
I
0.2 0 . 4 0 . 6 0 . 8
Time
(ms)
O v e r p r e s s u r e at 3 ft.
(a)
2000 .... i ~ " I i q
-
l , ~-~ ; - - -1 5 0 0
o~.,~ rJ2
1000
r~
5OO
0 I _
0 . 0 0 . 4 0 . 8 !.2 I .6 2 . 0
Time (ms)
O v e r p r e s s u r e at 5 ft.
(b)
2000
1500
ol,,,,i r,~
ID
l o o o
500
0 I o.o 0 . 5
I I I I I I •
t i I
i
i
1 . 5 2 . 0 2 . 5 3 . 0 3 . 5 4 . 0 4 . 5
Time
(ms)
O v e r p r e s s u r e at 10 ft.
(c)
4 O0
3 0 0
200
F
i
i
1
1 0 0 "
t i
0 0
.... ~ I '1 ... I" [ / - I I i
I A = 10 mSec-psi -
A B = 50 mSec-psi
J C = 1 7 5 m S e c - p s i
D - 75 mSec-psi -
c Total = 310 mSec-psi
.B-
- ~
I I I .. . ' i " ~ " . - . ~ . . . ~ A ~
2 3 4 5 6 7 8 9
.19
.,. I 1 I
Time (ms)
O v e r p r e s s u r e at 15 ft.
(a)
Table 1-1 Specific Impulse "i"
Distance Blast source to Pipe
3ft 5 f t 10ft 15ft Hypothetical
Max Duration h (msec) 0 . 8 - 0 . 6 = 0 . 2
1.2 - 0.7 = 0.5
2 . 3 - 1.3 = 1.0 4.5 - 2.6 = 1.9
0.1 Peak (psi) 5100 1750 1500 400 400
i best estimate (psi-sec)
0.34 0.36 0.79 0.31
1/2(0.1)(400)/1000 = 0.02
Figure la lb lc ld
Table 1-2 M a x i m u m Value of P a r a m e t e r (Jot I (with h = 2 msec).
fl0
(Hz)
1 pipe
f5 (Hz)
3/8 tube 2.54 10.16
9.27 37.09
2 pipe 17.37
¾ conduit 5.88 1 conduit 7.30
¾ cu 4.47
1 cu
1.5 cu
5.83 9.76 2.07 3/4 pvc
1 pvc 2.63
69.47 23.53 29.21 17.88 23.34 39.03 8.26 10.52
Omega/10 Omega/5 Omega*ti
(Rad/sec) (Rad/sec) (o)
15.96 63.82 0.13
58.26 233.04 0.47
109.12 436.50 0.87
36.96 147.82 0.30
45.89 183.54 0.37
28.09 112.37 0.22
36.66 146.64 0.29
61.31 245.24 0.49
12.98 16.53 51.93 66.12 0.10 0.13
From Table 1-2, it is apparent that the pipe will respond to the blast mostly in the impulsive regime (coti < 0.4). The load will be applied so quickly relative to the pipe's period that the pipe will deform less than under quasi-static loading.
R E S P O N S E C O M P U T A T I O N
Deflections and Strains
In the impulsive regime, the elastic-plastic deflection of a pipe span under a side-on blast pressure can be obtained from [1, eq.(4-70), p. 323]:
iDL 2
424.576(2)pAEi = w ° From [ 1, Fig.(4-26, p.321)] the maximum strain in the deflected pipe span is:
Dw o woD 4.8woD
Emax = L2Vw'----~ = L 2 (0.2083) = T
The maximum deflections (at center of span) and corresponding strain are presented in Table 2-1, for 0.31 psi-see and the hypothetical 0.02 psi-see impulses (Table 1-1) for 5-ft and 10-ft spans.
Table 2-1 M a x i m u m Deflections and Strains
wo/0.31/5 wo/0.02/5 wo/0.31/10
(in) (in) (in)
3/8 tube 84 5 339**
1 pipe 7 0.5 27
2 pipe 3 0.2 12
3/4 conduit 11 0.7 46
1 conduit 0.5 31
wo/0.02/10 e/0.31/5 e/0.02/5
(in) (%) (%)
22 4.24 0.27
2 1.19 0.08
1 0.95 0.06
1.57 1.34
0.10 0.09
e/0.31/10 e/0.02/10
(%) (%)
4.24 0.27
1.19 0.08
0.95 0.06
1.57 1.34
3/4 cu 1 cu
25
18
98** 74**
2.87 2.77
0.19 0.18
2.87** 0.19
0.18 2.77**
1.5 cu 5 0.3 21 ** 1 1.30 0.08 1.30 0.08
¾ pvc 186 12 743** 48 26.01 1.68 26.01"* 1.68
1 pvc 126 8 503** 32 22.03 1.42 22.03** 1.42
Nomenclature: wo/0.31/5 - maximum deflection Wo, for a 0.31 psi-sec impulse, applied to a 5-ft span. ** Excessive deflections, beyond accuracy of bending equations.
Support Reactions
In practice, the direct blast will cause the supports of pipe runs along the wall to be in compression. However, a reflected blast wave could place the supports in tension, and an upward blast could place higher elevation supports in shear. The support reaction for a uniformly loaded, simply supported beam is
R * = w L / 2 The maximum elastic deflection is:
Wo = 5wL 4 / (384EI)
Therefore, the elastically calculated support reaction due to a span deflection of Wo is R* = ((384 EI) Wo/5La)(L/2) = 38.4 EI Wo/L 3
This support load corresponds well with the detailed analysis presented in Appendix B. Actual support load will be double this value due to added reactions from two adjacent spans.
R = 2R* = 76.8 EI Wo / L 3
Table 2-2 Support Reaction
R/0.31/5 (lb) 3/8 tube 494
1 pipe 6327
2 pipe 21403
¾ conduit 3140 1 conduit 4888
¾ cu 2030
R/0.02/5 (lb)
32
1795
R/0.31/10 (lb)
131
247
409 3163
1384 10701
203 1570
316 2444
1 cu 3406 220 **
1.5 cu 9620 622 **
3/4 pvc 1126 73 **
116 1 pvc
R/0.0.2/10 (lb)
16 204 690 101 158 6 5 i l l 0
310 36 58
Nomenclature: R/0031/5 = support reaction R for a 0.31 psi-sec impulse, 5 ft pipe span. ** Excessive deflections, beyond accuracy of bending equations.
COMPARISON WITH ALLOWABLES
Welded Steel
Welded steel pipe will reach the onset of plastic deformation at 0.2% strain.
The design limit for onset of buckling is 2.4(ffD) 1"6 [2] which corresponds to the 95% lower bound [2].
Table 3-1 Calculated Bending Strain Compared to Buckling Strain, Metallic Pipe and Conduit
e/0°31/5 e/0.02/5 e/0.31/10 e/0,02/10 Buckling Strain
(%)
(%)
(%)
(%)
(%)
3/8 tube 4.24 0.27 4.24 0.27 5.3
1 pipe 1.19 0.08 1.19 0.08 6.14
2 pipe 0.95 0.06 0.95 0.06 3.01
3A conduit 1.57 0.10 1.57 0.10 3.63
Threaded Steel
The 4-point bending of a 6-ft long, 2" sch.40, threaded pipe specimen [3] resulted in leakage through cracked threads at a cross head deflection of 1.4" to 1.8" and separation (break) at a center span deflection of approximately 3". For a symmetrical 4-point bending, the deflection under the load is [ with X = a and L = 3a,]
5Pa 3 A x -
6EI The maximum deflection, at mid-span is
23Pa 3
A m a x - - = ~
24EI Therefore, the maximum deflection at mid span at thread leakage is Ama~ = (23/24)/(5/6) Ax = 1.15 Ax = 1.15 (1.4")= 1.6"
The same rotation angl e at mid-span is reached for a span length L when the mid-span deflection reaches the value WoE = Wo6' (L(in)/72"), or Wos. = 1.6(60/72) = 1.3" and Wol0, = 1.6(120/72) = 2.7", these displacements limits at which the threaded joint will fail are compared to the calculated deflections in Table 3-2. Rupture (separation) of the threaded joint occurs at ws5 = 3(60/72) = 2.5" and Wsl0 = 3(120/72) = 5"
Table 3-2 Comparison of Span Deflections to Limit Deflection at Threaded Joint for Leak (leak) and Rupture
3/8 tube
wo/0.31/5 (in)
1 conduit
84
wo/0.02/5 (in)
wo/0.31/10 (in)
0.5
wo/0.02/10 (in)
Wo5'
leak/rupture (in)
339** 22 1.3 / 2.5
Wol0'
leak/rupture (in) 2 . 7 / 5
¾ pipe 10 1 41 3 1.3 / 2.5 2.7 / 5
1 pipe 7 0.5 27 2 1.3 / 2.5 2.7 / 5
2 pipe 3 0.2 12 1 1.3 / 2.5 2.7 / 5
¾ conduit 11 0.7 46** 3 1.3 / 2.5 2.7 / 5
31"* 2 1.3 / 2.5 2.7 / 5
** Excessive deflections, beyond accuracy of bending equations.
Nomenclature: wo/0.31/5 = maximum deflection Wo, for a 0.31 psi-sec impulse, applied to a 5-ft span.
Copper Tubing
The allowable stress at ambient temperature, for B-88 drawn (temper H) copper tubing is [4] S = 12 ksi, the yield Sy = 30 ksi, and the ultimate = 36 ksi. Therefore, the deflection at yield is
(30,000)L 2
( W o ) m a x =
4.8DE
For example, with L = 6 0 " , D = 1o90" and E = 17E6 psi, the deflection at yield is (Wo)ma x -- 0.70", as reported in Table 3-3 under "CuYield5" for "l.5cu".
Unpublished test results [5] indicate that copper tubing could fail in a groove of the coupling (3 cases) or by crimping (1 case). In the first case, the deflection under load was 2", and therefore the center span deflection was 1.15(2') = 2.3". For the 5-ft span this deflection at rupture corresponds to 2.3(60/72) = 1.9" and for the 10-ft span 2.3(120/72) = 3.8".
Table 3-3 Comparison of Span Deflections Wo to Yield Deflection in Copper Tubing
wo/0.31/5 wo/0.02/5 wo/0.31/10 wo/0.02/10 CuYield5
(in) (in) (in) (in) (in)
¾ cu 25 2 98** 6 1.51
1 cu 18 1 74** 5 1.18
1.5 cu, 5 0.3 21 1 0.70
** Excessive deflections, beyond accuracy of bending equations.
CuYieldl0 (in) 6.05
CuRup5 (in)
1.9
4.71 1.9
2.79 1.9
CuRupl0 (in) 3.8 3.8 3.8
PVC Pipe
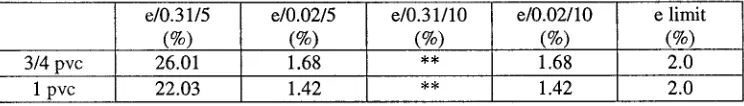
Table 3-4 Maximum Strains in PVC Pipe
e/0.31/5 e/0.02/5 e/0.31/10 e/0.02/10 e limit
(%)
(%)
(%)
(%)
(%)
3/4 pvc 26.01 1.68 ** 1.68 2.0
1 pvc 22.03 1.42 ** 1.42 2.0
Nomenclature: e/0.31/5 = maximum strain, for a 0.31 psi-sec impulse, applied to a 5-ft span. ** Excessive deflections, beyond accuracy of bending equations.
Pipe Supports
6" Unistrut channel P1000, single load (1-5/8" height and width) capacity [8] = 1690 (24"/6")(0.50) = 3380 lb, with a safety factor of 2.4 on ultimate = 3380 (2.4) = 8122 lb. ~ 8000 lb.
48" Unistrut P1000, multiple load capacity [8] = 850 lb., with a safety factor of 2.4 on ultimate = 850 (2.4) = 2040 lb. Conduit clamp design load [P2028, P2030, P2038] = 400 lb for ¾", 600 lb for 1", and 800 lb for 2", with a safety factor of 5 against rupture the ultimate load is 5(600) = 3000 lb and 5(800) = 4000 lb.
The tension capacity of embedded Unistrut inserts is 750 lb for a 6" long insert in 3000 psi concrete, which includes a safety factor of 3 [810 Therefore, at -- 3(750) = 2250 lb the Unistrut would fail.
Anchor bolts are 5/8" across flats (3/8" diameter bolts), unknown make, at 4" spacing. Based on [9], the anchor capacity for 3/8" bolts, unknown make, 4" apart (which is larger than 10diameters), is:
Tension allowable = (1460 lb)(0.5) = 730 lb, with a safety factor of 3 [9] = 2190 lb at rupture. Shear allowable = (1420 lb) (0.75) = 1065 lb, with a safety factor of 3 [9] = 3195 lb at rupture.
Table 3-5 Support Reactions
3/8 tube 1 pipe 2 pipe
R/0.31/5 (lb)
494 6326 21402 3/4 conduit 3140
4888 1 conduit
3/4 cu
1 pvc
2029
R/0.02/5 (lb)
32 409 1383
203 316 131
R/0.31/10 (lb)
247 3163 10701
1570 2444
R/0.0.2/10 (lb)
15 204 690 101 157 65
Channel Ultimate
(lb) 8000 8000 8000 8000 8000 8000
Clamp Ultimate
(lb) 3000 3000 4000 3000 3000 3000
Bolt Ultimate
(lb) 2190 2190 2190 2190 2190 2190
1 cu 3405 220 ** 110 8000 3000 2190
1.5 cu 9620 622 ** 310 8000 3'000 2190
3/4 pvc 1125 72 ** 36 8000 3000 2190
1795 116 ** 57 8000 3000 2190
Nomenclature: R/0.31/5 = support reaction R for a 0.31 psi-sec impulse, 5 flpipe span. ** Excessive deflections, beyond accuracy of bending equations.
RESULTS AND CONCLUSIONS
The following conclusions apply to the actual 0.31 psi-sec pressure impulse for a 15-ft distant source. In parenthesis is the conclusion for a hypothetical 0.02 psi-sec pressure impulse.
1- Welded Steel: The strains are below buckling limits. The welded steel pipes would not fail from the blast pressure impulse. The Unistrut supports would fail, but the resulting longer span of pipe would not fail. (No failure for hypothetical 0.02 psi-sec impulse)° Base metal and welded steel would not fail as a result of the pressure impulse.
3- Copper Tubing and Pipe: The pipe and tubing deflections exceed the measured deflections at rupture of copper joints, and calculated yield and ultimate stress. The support loads would be excessive in all cases, except for the 5-ft span of
¾ tube. Copper tube joints would fail if located close to span center, as a result of the pressure impulse.
4- PVC Pipe: The center span deflection of 5-ft and 10-ft span would exceed the deflection at rupture for PVC pipe. The 5-ft span supports would not fail. (No failure for hypothetical 0.02 psi-sec impulse). PVC pipe will fail, as a result of the pressure impulse.
5- Predicted failure of threaded connections can be avoided by installing supports close to the connections. The supports should be sized to sustain the loads given in Table 3-5.
Welded Pipe
Threaded Pipe/Conduit Copper Tubing PVC Pipe
5 ft span
0.31 psi-sec 0.02 psi-sec
ok ok
No Good ok
No Good ok
No Good ok
0.31 psi-sec ok No Good No Good No Good
10 ft span
0.02 psi-sec ok ok No Good
ok
N O M E N C L A T U R E
A = metal area of cross section D = diameter
E = Young's modulus of material
f = natural frequency of simply supported span
fl0 and f5 = natural frequencies for a 10-ft and a 5-ft simply supported span. i = specific impulse, integral of the pressure-time function
I = moment of inertia of pipe cross section L = span length
m = linear mass P = peak pressure
R = total support reaction from two sides, twice R* R* = support reaction from one side
w = distributed load wo = deflection Z = section modulus
o~ = dimensionless boundary condition parameter p = mass density of pipe material
= dimensionless parameter co = natural pulsation
REFERENCE
[ 1 ] Baker, W.E., et. al., Explosion Hazards and Evaluation, Elsevier Scientific Publishing Co. NY, 1983.
[2] Stephens DoR., at. AI., Pipeline Monitoring - Limit State Criteria, Battelle report NG-18, No 188 for the American Gas Association, September, 1991.
[3] Antaki, G.A. and Guzy, D., Seismic Testing of Grooved and Threaded Fire Protection Joints andCorrelation with NFPA Seismic Design Provisions, ASME PVP Conference, 1995.
[4] ASME B31.3 Process Piping, 1999 edition
[5] Antald, G.A., Bending Strength of Fire Protection Pipe Joints, October 2, 1996, not published.
[6] UniBell, Handbook of PVC Pipe Designa nd Construction, Uni-Bell PVC Pipe Assocaition, Dallas, TX.
[7] Scavuzzo, R.J., et. al., Bending fatigue Tests on Polyvinylchloride (PVC) Pipe Joints, Pressure Vessel Research Council Grant 96-15 and 97-13, The University of Akron, OH, September 28, 1998.
A P P E N D I X A - P I P E S T R A I N U S I N G D I A G R A M [1]
We will calculate the dynamic strain and the support reaction loads for a 10 ft long pipe span of 1" standard (schedule 40) carbon steel pipe, subjected to a 400 psi, triangular pressure pulse of 0.31 psi-sec and 0.02 psi-sec respectively, using the solutions developed in [1 ].
It can be seen that the solutions in [ 1, Fig.4-26 and 4-27] apply to a cylindrical cross section if we set b = h = D the pipe diameter.
Strain Calculation
Applying the elastic-plastic solution of [ 1, Fig.4-26] we first calculate the strain in the pipe due to the blast load. The abscissa of the solution diagram is
where, P = 400 psi D = 1.315" L = 120"
Iltp = 10 [1, Fig.4-26] ov = 35,000 psi Z = 0.1329 in 3
The ordinate of the solution diagram is
PDL 2
~I~pO'v Z
~ = 163
iD,
~i ~ o v Z
= 8 (for 0.31) and 0.5 (for 0.02)
where, D, Z, (yy are as above and i = 0.3 lor 0.02 psi-sec.
E = 30E6 psi for carbon steel I = 0.0874 in n
~i = 0.913 [ 1, Fig. 4-26]
p = mass density of pipe material = (1.679)/[(12)(0.494)(386)] = 0.0007338 lbf/in 3 / (in/sec 2) A = 0.494 in 2
W e enter [ 1, Fig.4-26] with (163,8) and (163,0.5) and read IEema~ / (WeDZoy) of >4.0 and ~ 0.2, which corresponds to emax > 1.2% and = 0.09%, which supports the values calculated in Table 3-1" e/0.31/10 = 1.19% and e/0.02/10 = 0.08%.
A P P E N D I X B - S U P P O R T L O A D U S I N G D I A G R A M [1]
Applying [ 1, Fig.4-27] we calculate the pipe support reactions due to the blast load. The abscissa of the solution diagram is p D 2 L 2
t~pEI
~ = 0.5
where P, D, L, I are as above and O~p = 8 [ 1, Fig.4-27]
E = 30E6 psi for carbon steel
The ordinate of the solution diagram is iD 2
= 1.2E-2 (for 0.31) or 7.7E-4 (for 0.02)
(Z i ~/pEIA where, oq = 1.4610 and rest are as above
For the 0.31 psi-sec impulse, we enter [ 1, Fig.4-26] with (0.5,1.2E-2). The ordinate for an impulse of 0.31 psi-sec, is too large, beyond the range of [ 1, Fig. 4-27].
For the 0.02 psi-sec impulse, we enter [ 1, Fig.4-26] with (0.5,7.7E-4) and read (Omax/E)103 -- 0.7, and