Abstract
Ayres, Jennifer. Characterization of Titanium Alkoxide-Based Sol-Gel Systems and their Behavior in Icephobic Coatings.
(Under the direction of Dr. C.M. Balik)
New coatings have been developed that display resistance to the nucleation
and adhesion of ice and are therefore termed ‘icephobic’. These coatings
are comprised of sub-micron sized phase domains of a hydrophobic matrix
and a multi-component melt-point depressant. The melt-point depresssant
complex consists of a titanium alkoxide-based sol-gel system designed to
facilitate the slow-release of tripropylene glycol (TPG) and glycerol to the
coating surface. The presence of these compounds is necessary for
effective prevention of the nucleation and adhesion of ice; however, their
concentrations are depleted with time and exposure to water. Thus, the
rate at which TPG and glycerol are released to the surface is critical to both
the coating’s performance and its lifetime.
The morphology of the coating was verified using SEM, EDS and AFM
techniques. Mass loss kinetics were studied over the temperature range 30
TPG and glycerol are released to the surface is limited by diffusion through
the coating matrix. Additives can also be used to control the mass loss
behavior in these coatings. Similar studies performed on the isolated
melt-point depressant complex combined with chemical analyses from FT-IR, NMR
and TGA techniques indicate mass loss in the melt-point depressant is
controlled by diffusion of TPG through the sol-gel network. TPG is the only
species released through sol-gel reactions; glycerol remains bound to the
network. The chemistry of the sol-gel network was altered by changing the
reaction conditions. This had only minimal effects on the mass loss kinetics,
which were affected primarily by changes in the diffusion environment
rather than by reaction kinetics.
The original design of this coating was based on the assumption that the
kinetics of the sol-gel reaction would control the rate at which TPG was
released to the coating surface. This study found that the release of TPG is
controlled by diffusion rather than by chemical reaction kinetics.
Nevertheless, this coating was still found to be effective for preventing the
CHARACTERIZATION OF TITANIUM
ALKOXIDE-BASED SOL-GEL SYSTEMS AND THEIR
BEHAVIOR IN ICEPHOBIC COATINGS
by
JENNIFER AYRES
A thesis submitted to the Graduate Faculty of North Carolina State University in partial fulfillment of the requirements for the Degree of
Master of Science
MATERIALS SCIENCE AND ENGINEERING
Raleigh 2004
APPROVED BY:
Biography
Jennifer Ayres grew up in Chapel Hill, N.C. and got a B.S. in Applied Science from UNC-Chapel Hill with a concentration in polymeric materials. She spent two years working in product development for fiber optic assemblies before returning to school as a graduate student at North Carolina State
Acknowledgments
The following people are acknowledged for their contribution to this work: Dr. C.M. Balik, advisor
Dr. Michael Rigsbee, co-chair of advisory committee Dr. Richard Spontak, advisory committee
Dr. William Simendinger and Shawn Miller of Microphase Coatings, Inc., Rich Fiore, AFM technical assistance
Birgit Andersen, FT-IR assistance Dr. Hanna Gracz, NMR assistance
Drs. Cristian and Marianna Rusa, TGA assistance Marcus A. Hunt and Brad Busche
Table of Contents
List of Tables vii
List of Figures viii
1. Introduction 1
1.1 Problem of Ice Adhesion 1
1.2 Proposed Solution 5
1.3 Sol-Gel Chemistry 7
1.4 Applications of Sol-gel Chemistry 17 1.5 Sol-Gel Chemistry Applied to Prevent the Nucleation and
Adhesion of Ice 23
1.6 Objectives 25
2. Experimental 27
3. Coating Morphology, Performance and Practice 31
3.1 Contact Angle 31
3.2 Coating Morphology 33
3.3 Release of Tripropylene Glycol and Glycerol 36 3.4 Coating Morphology after Water Immersion 41
3.5 Coating Performance 43
3.6 Summary and Conclusions 46
4. Mass Loss Depressant in the Coating and the Melt-Point Depressant
Complex 47
4.1 Mass Loss in Coating 48
4.2 Mass Loss in the Melt-Point Depressant 56 4.3 Mass Loss Kinetics for the Melt-Point Depressant 66 4.4 Coating Formulations Compared to the Melt-Point
Depressant 72
5. Chemistry of the Melt-Point Depressant 76 5.1 Fourier Transform-Infrared Spectroscopy 78 5.2 Predictive Model for the Sol-Gel Reaction 88 5.3 Extension of Predictive Model 106
5.4 Verification of Model 113
5.5 Mass Loss Kinetics 133
5.6 Summary and Conclusions 148
6.0 Summary and Conclusions 152
7.0 Future Work 155
References 156
Appendices 159 Appendix 1: Possible Reaction Paths for Sol-Gel System
Synthesized Under Ambient Conditions 160 Appendix 2: Possible Reaction Paths for Sol-Gel System
Synthesized Under Ambient Conditions; Glycerol Added Last 168 Appendix 3: Possible Reaction Paths for Sol-Gel System
Synthesized Under Nitrogen 173
Appendix 4: Possible Reaction Paths for Sol-Gel System
List of Tables
3-1 Contact Angle Measurements for Polymeric Coating Matrix 33 4-1 Additives in Two Coating Formulations 49 4-2 Diffusion Coefficients for Coating Formulations A and B 54 4-3 Diffusion Coefficients for IPA out of the Melt-Point Depressant 67 4-4 Diffusion Coefficients for TPG and Glycerol out of the Melt-Point
Depressant 71
5-1 Reported Vibrational Frequencies for Silica Gels 82 5-2 Partial Charge Calculations for TIP Reacted with Acetic Acid 93
5-3 Reaction of TIP with Acetic Acid 96
5-4 Partial Charge Calculations for Reactants Involved in Sol-Gel
Reaction 98
5-5 Charge Distributions for All Possible Reaction Intermediates of
Sol-Gel System Synthesized in Ambient Conditions 99 5-6 Predicted Reaction Products for Melt-Point Depressant
Synthesized in Ambient Conditions 101
5-7 Predicted Reaction Products for Melt-Point Depressant
Synthesized in Ambient Conditions, Continued 102 5-8 Ionic Components of Bond Energy Approximated Using Pauling’s
Bond Energy Equation 103
5-9 Charge Distribution of Ti(C3H70)3(C3H7O3) 106
5-10 Summary of Reaction Paths for Sol-Gel System Synthesized in
Ambient Conditions, Glycerol Added Last 109 5-11 Summary of Reaction Paths for Sol-Gel System Synthesized
Under Nitrogen 111
5-12 Summary of Reaction Paths for Sol-Gel System Synthesized
Under Nitrogen with Glycerol Added Last 112
5-13 Summary of Predicted Reactions 113
5-14 Signals Expected in Various Systems Analyzed with 1H NMR 130
5-15 Diffusion Coefficients for IPA in Sol-Gel System at 70°C 138 5-16 Diffusion Coefficients for Final Region of Mass Loss in Sol-Gel
System at 70°C 140
5-17 Calculated Mass Percentages for Sol-Gel System
List of Figures
1-1 Schematic of coating design 5
1-2 Hydrolysis of tetraethoxysilane 7
1-3 Alcoxolation of hydrolyzed TEOS 8
1-4 Oxolation of hydrolyzed TEOS 8
1-5 Shrinkage of gel with condensation 9
1-6 TEOS precursor substitution and the resulting reaction rates 12
1-7 Acid catalyzed hydrolysis of TEOS 15
1-8 Base catalyzed hydrolysis of TEOS 15
1-9 Gel structures for acid and base catalyzed reactions 16 1-10 Entrapment of guest molecules in a sol-gel network 18 1-11 Possible structures for organic-inorganic hybrids 19 1-12 Property regimes for organically modified sol-gel 21 1-13 Reaction of TIP with TPG and glycerol 24 1-14 Condensation reaction resulting in slow release of TPG and
glycerol to coating surface 25
3-1 Schematic of contact angle for hydrophobic and hydrophilic
surfaces 32
3-2 Scanning electron microscopy and EDS images of coating 34
3-3 Topographical and Phase AFM Images of Coating, 5µm2 35
3-4 Topographical and Phase AFM Images of Coating, 1 µm2 35
3-5 Mass loss measurements made during water immersion at 30°C 37 3-6 FT-IR spectrum of leachant obtained during water immersion 38 3-7 Optical images of coating taken at room temperature 39 3-8 Mass loss measurements made in an oven at 50°C 40 3-9 SEM images before and after water immersion 42 3-10 AFM images before and after water immersion 42 3-11 Vortex generator after being in the icing wind tunnel for
approximately 20 minutes at -2°C 44
3-12 Vortex generator after being in the icing wind tunnel for only a
few minutes at -9°C 44
3-13 Airfoil after being in the icing wind tunnel for approximately 12
List of Figures (continued)
4-1 Mass loss behavior in coating formulation A 50 4-2 Mass loss behavior in coating formulation B 52 4-3 Diffusion model curve fit for mass loss data collected for
formulation A at 90°C 53
4-4 Arrhenius plots for coating formulations A and B 55 4-5 Mass loss behavior for the melt-point depressant 57 4-6 Three regions of mass loss in a sol-gel 58 4-7 Three regions of mass loss observed for the melt-point
depressant at 70°C 60
4-8 Physical changes in the melt-point depressant during mass loss at
70°C 62
4-9 Three regions of mass loss observed for the melt-point
depressant at 22°C 63
4-10 Physical changes observed for the melt-point depressant at 22°C 64 4-11 TGA scan for the melt-point depressant from 25 to 400°C 66 4-12 Curve fit for diffusion of IPA out of the melt-point depressant
at 70°C 67
4-13 Arrhenius plot for diffusion of IPA out of the melt-point
depressant at 70°C 68
4-14 Curve fit for diffusion of TPG and glycerol out of melt-point
depressant at 70°C 70
4-15 Arrhenius plot for diffusion of TPG and glycerol out of the
point depressant 72
4-16 Arrhenius plots for coating formulations compared to the
isolated melt-point depressant 73
5-1 Reaction of titanium isopropoxide with tripropylene glycol and
glycerol 76
5-2 Sol-gel reaction 77
5-3 FT-IR spectrum of reacted melt-point depressant compared to
the sum of the individual reactants 79 5-4 FT-IR spectrum of the reacted melt-point depressant
compared to IPA and TIP 80
5-5 FT-IR spectra of dried melt-point depressant and hydrolyzed TIP 83 5-6 FT-IR spectrum of the liquid released from the melt-point
List of Figures (continued)
5-7 Chemistry resulting in Ti-O-R-O-Ti infrared band 87
5-8 Reaction of TIP with acetic acid 92
5-9 Flowchart showing reaction of TIP with acetic acid 96 5-10 FT-IR spectra of sol-gel system reacted under different
conditions 114
5-11 FT-IR spectra of dried sol-gel systems reacted under different
conditions 115
5-12 FT-IR spectra of dried MPD reacted under nitrogen for
different time periods 118
5-13 Protons affecting ‘H NMR chemical shifts 121
5-14 ‘H NMR of melt-point depressant 122
5-15 Magnified view of 1H NMR of melt-point depressant 123
5-16 Chemical shift changes expected for ‘H NMR of sol-gel 125 5-17 1H NMR spectra for melt-point depressant synthesized under
different conditions 129
5-18 Chemical shift changes expected for 13C NMR of sol-gel
132 5-19 Mass loss kinetics at 70°C for melt-point depressant synthesized
under different conditions 134
5-20 Physical changes in melt point depressant 136 5-21 Thermogravimetric analysis of melt-point depressant
synthesized under different conditions 144 5-22 Thermogravimetric analysis of melt-point depressant
synthesized under different conditions 148 A1-1 Possible reaction paths for TIP after initial reaction with
glycerol; ambient conditions 160
A1-2 Possible reaction paths for TIP after initial reaction with water;
ambient conditions 161
A1-3 Possible reaction paths for TIP after initial reaction with water
and TPG; ambient conditions 162
A1-4 Possible reaction paths for TIP after initial reaction with water
and two TPG groups; ambient conditions 163 A1-5 Possible reaction paths for TIP After initial reaction with TPG
List of Figures (continued)
A1-6 Possible reaction paths for TIP after initial reaction with TPG
and water; ambient conditions 165
A1-7 Possible reaction paths for sol-gel system TIP after initial reaction with TPG, water and then a second TPG group; ambient
conditions 166
A1-8 Possible reaction paths for TIP after initial reaction with three
TPG groups; ambient conditions 167
A2-1 Possible reaction paths for TIP after initial reaction with water;
ambient conditions, glycerol not yet added 168 A2-2 Possible reaction paths for TIP after initial reaction with water;
ambient conditions, glycerol added to system 169 A2-3 Possible reaction paths for TIP after initial reaction with TPG;
ambient conditions, glycerol not yet added to the system 170 A2-4 Possible reaction paths for Ti(C3H70)(C9H19O4)3 upon addition of
glycerol; ambient conditions 171
A2-5 Possible reaction paths for Ti(C9H19O4)3OHupon addition of
glycerol; ambient conditions 172
A3-1 Possible reaction paths for TIP under nitrogen 173 A3-2 Possible reaction paths for Ti(C9H19O4)3(C3H7O3) and
Ti(C3H7O)2(C9H19O4)(C3H7O3) upon exposure to atmosphere 174
A3-3 Possible reaction paths for Ti(C3H7O)(C9H19O4)2(C3H7O3)
and Ti(C3H7O)(C9H19O4)3 upon exposure to atmosphere 175
A4-1 Possible reaction paths for TIP under nitrogen, glycerol added
last 176
A4-2 Possible reaction paths for system reacted under nitrogen;
1. Introduction
1.1 Problem of Ice Adhesion
Since the dawn of aviation, ice, frost and snow have posed obstacles to flight. Ice build-up on the exterior of an aircraft affects the aerodynamics and consequently the lift capabilities of a plane in addition to causing the
malfunction of individual components. Various techniques have been explored to rectify this problem; mechanical, electrical and chemical methods have been employed both to remove ice and limit its adhesion.1, 2
Ice is commonly removed by mechanical cutting and scraping. These methods are only effective for removing ice while the aircraft is grounded and do not prevent ice from reforming. In addition to ice build-up that occurs on the ground, in flight icing poses a significant threat, especially to small planes which fly at or below cloud level. Supercooled water droplets freeze upon contact with an aircraft in flight. To counter this problem, rubber tubes are placed along the front of many airplane wings.1, 2 These tubes can be periodically
Electrical methods have also been applied to remove ice from aircraft in flight. Ice has been melted using heaters and redirecting heat generated by the
engine. Currently, small engines do not generate sufficient heat for effective ice removal; the development of engines with increased energy efficiency further limits the use of this technique.
Electrodes have also been used to facilitate ice removal. A power supply generates DC current between multiple closely-spaced electrodes on the surface of the aircraft and generates an electric field at the ice-surface interface.3 The electric field initiates electrolysis reactions, which create
bubbles of hydrogen and oxygen gas at the interface. These bubbles reduce the surface area of ice in direct contact with the aircraft, creating cracks and reducing the force required for ice removal to that created by normal
aerodynamic forces while in the air.1, 3 Electric current is also used to facilitate
the mechanical removal of ice. Short bursts of current are applied in opposite directions through two parallel wires. The resulting electromagnetic field creates a force, which pushes the wires apart and cracks the ice.1
Two different chemical approaches have been studied: hydrophobic coatings have been developed to limit the contact area between the ice and the surface of the aircraft, and freezing point (melt-point) depressants have been used to melt ice already the surface.
One of the most commonly used hydrophobic coatings is
polytetrafluoroethylene (PTFE, Teflon®). Recently, comparable hydrophobic properties have been found in polysiloxanes1, and one company found increased
hydrophobicity in a copolymer containing both fluoralkyl and silicon-containing monomer units.4 This composition also included silica particles with an average
particle size less than 5 µm, which increased the smoothness of the surface and improved its hydrophobic capabilities.2, 4
The other chemical approach to removing ice from surfaces involves the use of melt-point depressants, which create a liquid layer on the surface and
consequently limit ice adhesion. The most commonly used melt-point
depressants are mixtures of water and either ethylene glycol or propylene glycol. These solutions are applied to the aircraft while on the ground. Because the adhesive forces between ice and a metal surface are significant5, 6, large
environment. In addition, these low-viscosity fluids quickly run off the surface and do not provide any protection against further ice formation. Many
attempts have been made to thicken solutions of melt-point depressant to increase their viscosity so that they remain on the surface of the aircraft. Both pure polyacrylic acid7 and a hydrophobically modified acrylic acid
copolymer8 have been crosslinked and added to these solutions as thickening
agents. These solutions provide protection against further ice adhesion while the aircraft is grounded; however, the solutions must be removed before flight. Liquids on the exterior of an aircraft can result in appreciable lift loss6, and
therefore must be removed prior to take-off or by shearing action during take off.6-8 Thickened melt-point depressants pose additional challenges in that
they must wet the surface to be effective, they must be stable enough that they do not gel or separate during storage6 and they must be thinned with
another substance, generally an alkanol, so that they can be sprayed.6, 7
Compounds that exhibit all of these properties still only provide protection for a limited amount of time, on the order of hours, while the plane is grounded. Attempts have been reported to mix ethylene glycol with a gelatin that can be painted on a metal surface and subsequently hardened to form a fixed coating.2
1.2 Proposed Solution
This study investigates a long-term solution to the aircraft icing problem which incorporates both a hydrophobic surface and melt-point depressants. This coating, designed to prevent the nucleation and adhesion of ice, consists of heterogeneous, sub-micron sized phase domains of a multi-component melt-point depressant dispersed in a hydrophobic polymer matrix as shown in figure 1-1. The size and distribution of the phase regions ensures that each droplet that comes in contact with the surface will be exposed to both the hydrophobic matrix, which limits the contact area of the droplet, and the melt-point
depressant, which forms a thin layer on the surface and prevents ice formation.
The hydrophobicity of the matrix was achieved through the addition of
poly(diethoxysiloxane) (PDES), which has documented hydrophobic properties.
Si O
O O
n
CH2
CH3
CH2
CH3
Poly(diethoxysiloxane)
The melt-point depressants used in this system are tripropylene glycol (TPG) and glycerol. Like the melt-point depressants described above, these
compounds offer only short term protection. Because of their low viscosity and water-solubility, surface concentrations of these molecules are depleted with both time and exposure to water. This coating is therefore designed to slowly release TPG and glycerol to the surface offering long term protection both on the ground and in flight.
1.3 Sol-Gel Chemistry
The term, ‘sol,’ describes a colloidal suspension in a fluid matrix, and a gel is defined as a two-phase system including a molecular backbone and an interstitial liquid. ‘Sol-gel’ refers to the process of forming metal oxides from metal
alkoxide precursors; both a ‘sol’ and a ‘gel’ are formed in the intermediate stages of this process.
Sol-gel reactions were used to synthesize glasses and ceramics long before the chemistry was understood. The most common sol-gel reaction involves the hydrolysis and condensation of tetraethoxysilane (TEOS) to form silica. The sol consists of TEOS molecules suspended in solution. Upon exposure to water, the TEOS molecules undergo hydrolysis as shown in figure 1-2.
Si O
O O O
CH2
CH3
CH2
CH2
H2C CH3
CH3
H3C Si
O
O OH O
CH2
CH3
CH2 H2C
CH3 H3C
H2O CH
3CH2OH
+
Figure 1-2: Hydrolysis of tetraethoxysilane
with an adjacent ethoxy group to produce ethanol and a siloxane oligomer as shown in figure 1-3.
Si O H2C
H3C
Si OH + Si O Si
+
CH3CH2OHFigure 1-3: Alcoxolation of hydrolyzed TEOS
The hydroxide group can also react with another hydroxide group in the process of oxolation as shown in figure 1-4. This reaction produces water in addition to the siloxane oligomer.
Si HO
Si OH + Si O Si
+
H2OFigure 1-4: Oxolation of hydrolyzed TEOS
The first stage associated with the sol-gel process is, of course, the formation of gel, which consists of growing metal-oxide chains surrounding solvent
molecules. This stage is accompanied by a sharp increase in viscosity. Gelation is succeeded by the formation of additional metal-oxide crosslinks, which pull chains together and result in shrinkage of the gel as shown in figure 1-5. This contraction brings additional –OH groups together, resulting in further
condensation.
Figure 1-5: Shrinkage of gel with condensation
Image was taken from Brickner and Scherer’s book, Sol Gel Science: The Physics and Chemistry of Sol-Gel Processing (reference 10).
Ostwald ripening also occurs during this stage11, 13; small oligomeric metal-oxide
structures migrate towards each other to form larger polymeric structures. The result is phase separation of the solid network from the solvent, and precipitation of solid crystals is often observed. This process is
with minimal migration, yielding a final product with significant cracking and a high concentration of oligomers.
The next stage of the sol-gel process is aging, which involves the loss of water, solvent and any alcohols produced during hydrolysis and condensation.10, 11.
These liquids are first removed through syneresis; a consequence of the gel shrinkage shown in figure 1-5 which expels liquids from the pores. Liquid on the surface of the gel evaporates, creating a concentration gradient that leads to diffusion. Liquid evaporation can also cause pressure gradients and capillary stresses within the network, which are relieved by cracking and the release of additional liquid.10
Once aging is complete, the resulting network can be subjected to thermal treatment; above approximately 1000°C, densification occurs.10 This process
involves additional condensation reactions and structural relaxation which cause shrinkage and produce a dense ceramic.10, 11
yielding the same products.11-12 Sol-gel processes also yield extremely pure
materials. This is due to both the purity of the starting materials, which can be easily distilled, and the fact that lower processing temperatures reduce the risk of contamination and thermal degradation.11-12 However, sol-gel techniques
have not replaced other more traditional methods for preparing glasses and ceramics for several reasons. No glasses have been prepared using sol-gel methods that have not been prepared by other means and metal alkoxide precursors are expensive and moisture-sensitive, which limits large-scale
production. Sol-gel reactions are also complicated, time consuming and difficult to control.
All stages of the sol-gel process require strict kinetic control in order to create a solid network with limited cracking. Many different factors affect the kinetics of sol-gel reactions including the rates of hydrolysis and
condensation.
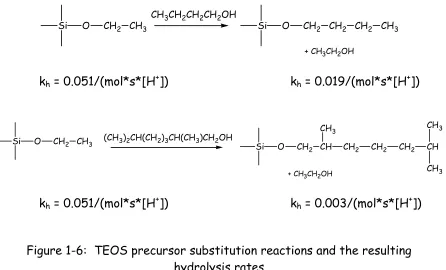
substituent on the alkoxide precursor. Because slow kinetics yield larger networks with limited cracking, alcohol exchange, also known as precursor substitution, reactions are often utilized to increase the length of the alkoxy substituents on the precursor molecules and limit the hydrolysis rate. Figure 1-6 shows two alcohol exchange reactions involving TEOS and indicates their effects on hydrolysis rates. Nucleophilic substitution of butanol decreases the hydrolysis rate by a factor of approximately 2.7 while substitution of 2, 6 dimethyl-heptanol decreases the hydrolysis rate by a factor of 17.10
Si O CH2 CH3CH3CH2CH2CH2OH Si O CH2 CH2 CH2 CH3
+ CH3CH2OH
kh = 0.051/(mol*s*[H+]) kh = 0.019/(mol*s*[H+])
Si O CH2 CH3 (CH3)2CH(CH2)3CH(CH3)CH2OH
Si O CH2 CH CH3
CH2 CH2 CH2 CH CH3
CH3
+ CH3CH2OH
kh = 0.051/(mol*s*[H+]) kh = 0.003/(mol*s*[H+])
Figure 1-6: TEOS precursor substitution reactions and the resulting hydrolysis rates
Precursor substitution reactions are especially important for controlling the hydrolysis rate of transition metal alkoxides. Titanium metal alkoxides exhibit greater hydrolysis rates than siloxanes, because transition metals are more electrophilic (less electronegative) than silicon and consequently more susceptible to nucleophilic attack.
The length of the alkoxy chain affects the rate of condensation as well as hydrolysis reactions. Steric hindrance limits condensation reactions; consequently, precursor substitution yields smaller oligomers.
Another factor that affects both the rate and extent of condensation
observed. When liquid is not expelled at a rate comparable to the rate of
condensation, pressure builds up in the network and causes additional cracking.10
As indicated above, any small change in reaction conditions including precursor chemistry, temperature, pH and solvent can affect not only the rates of
hydrolysis and condensation, but also the structure of the final product. A more specific example of how small changes in reaction rates affect structures is shown in the following example involving the addition of acids and bases to the sol-gel solution. An acid added to a sol-gel system protonates hydroxo ligands and facilitates the departure of water or alcohol in both hydrolysis and condensation reactions. Figure 1-7 shows this for the hydrolysis of TEOS. Protonation increases the rate of hydrolysis by stabilizing the transition state and facilitating the removal of ethanol. The added proton creates a positive charge, which is stabilized by the electron-donating substituents on the
Si O O O O CH2 CH3 CH2 CH2
H2C CH3
CH3
H3C
H acidic proton
Si O O OH O CH2 CH3 CH2
H2C
CH3
H3C
H2O CH
3CH2OH +
Figure 1-7: Acid catalyzed hydrolysis of TEOS
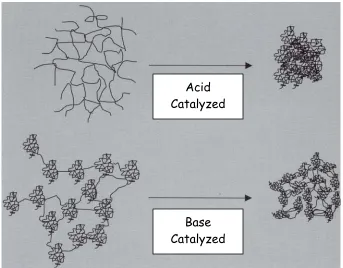
In contrast, a base added to a sol-gel solution deprotonates hydroxyl ligands and creates stronger nucleophiles. The base-catalyzed hydrolysis of TEOS is shown in figure 1-8. In this case, the transition state is negatively charged and becomes increasingly stable as electron-donating groups are removed through successive hydrolysis and condensation. The slow kinetics in the early stage of the condensation process result in highly crosslinked particles. However, as reaction rates increase there is not sufficient time for Ostwald ripening and the resulting structure is extremely porous as shown in figure 1-9.
Si O O O O CH2 CH3 CH2 CH2
H2C CH3
CH3
H3C Si
O O OH O CH2 CH3 CH2 H2C
CH3 H3C
OH CH
3CH2OH
+
Figure 1-9: Gel structures for acid and base catalyzed reactions
Figure was taken from Wright, Nico and Sommerdijk’s book, Sol Gel Materials: Chemistry and Applications (reference 11).
The significant structural differences observed for products of acidic and basic sol-gel solutions are yet another indication that strict control of reaction conditions is required to achieve a desired product. While this is a significant disadvantage in the production of ceramics and glasses, the complexity of the sol-gel process allows for the synthesis of a wide range of new materials not achievable through other methods. The study of sol-gel science is no longer focused on the production of ceramics, but has expanded to a much broader range of applications.
Acid Catalyzed
1.4 Applications of Sol-Gel Chemistry
The complexity of sol-gel systems allows for synthesis of many different
structures and paves the way for the development of a variety of materials for many applications.
While sol-gel techniques are not currently used for bulk glasses, their ability to form extremely pure metal oxides has led to their use for the production of optical components including lenses and optical fibers.12, 13 In addition, the
liquid nature of precursor solutions creates the ability to mold ceramics to unique shapes and, more importantly, thin films. Sol-gel solutions are applied to polymer and glass surfaces using spin or dip coating techniques to create
coatings resistant to heat, abrasion and chemicals. There is also interest in using sol-gel materials for electronic applications. They form extremely pure, transparent, conductive films for coating semi-conductor wafers11 and have
been explored as alternatives to sputtering.13
entrapped and eventually immobilized in the sol-gel network as crosslinks form. The low-temperature processing conditions allow for the addition of organic molecules such as dyes. One study reported the successful incorporation of 1-nitro-2-naphthol into silica sol-gels.13 This molecule detects cobalt ions, and
the sol-gel network immobilizes these molecules in an array. Thin films of these materials can then be used as chemical sensors. A carbon monoxide sensor has been developed similarly by incorporating a rhodium (I) complex into titania and zirconia sol-gel films.13
Figure 1-10: Entrapment of guest molecules in a sol-gel network
Figure was taken from Wright, Nico and Sommerdijk’s book, Sol Gel Materials: Chemistry and Applications (reference 11).
The performance of guest molecules in these systems is limited by their tendency to diffuse out of the gel.10 Porous networks are therefore less
desirable for these applications than high-density gels.
wastewater treatment and gas separations.11, 12 Sol-gel systems inside
size-exclusion chromatography columns have yielded extremely efficient separations.
Of all the possible applications for sol-gel materials, the development of organic-inorganic hybrid materials is possibly the most viable. As mentioned above in reference to figure 1-10, the low processing temperatures associated with sol-gel processes allow for the incorporation of organics. Not only can organics be entrapped within the sol-gel network, but they can be covalently bonded to the network.
A B C
Figure 1-11: Possible structures for organic-inorganic hybrids (A) sol-gel with organic and inorganic modifiers
(B) polymer chains grafted to sol-gel network (C) interpenetrating organic and inorganic networks
Figure 1-11 shows several different structures for organic-inorganic hybrid materials. Organic molecules can be added to the inorganic network to alter its structure or add functionality as shown in figure 1-11-A. Figures 1-11-B and C show polymer chains incorporated into sol-gel networks, both covalently grafted to create a single network and polymerized in situ to create interpenetrating organic and inorganic networks.14
Because most organic-inorganic hybrids are created from silica sol-gels, they have been given various names such as ORMOSILS (Organically Modified Silicates), ORMOCERS (Organically Modified Ceramics) and CERAMERS (Ceramic Polymers). Organic modifiers are often included in metal oxide coatings for added functionality. For instance, the ORMOCER® line includes coatings for corrosion protection, hydrophobic, anti-static and anti-adhesion applications. The inorganic component in these coatings provides long-term stability with resistance to both heat and abrasion.15 Organic modifiers for
hydrophobic coatings consist of long alkyl chains while polyvalent alcohols,
esters and fatty acids provide anti-static properties.15 The addition of Norbloc
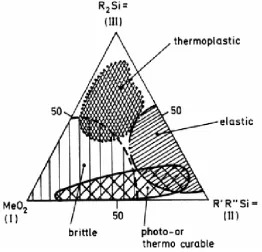
Not only do hybrid materials add functionality to metal oxides, but they create the ability to develop systems with both the hardness and stability of ceramic materials and the flexibility of organics. The properties vary with the relative concentrations of each component. Figure 1-12 shows property regimes
observed in a metal oxide gel and indicates the variation of properties that can be obtained for this single system. MeO2 indicates the pure metal oxide; the
metal is either silicon, titanium or zirconium. SiR2 and SiR’R’’ molecules are
added to control the extent of crosslinking in the system; R = C6H5, R’ = alkyl
chain, R’’ = vinyl group.
MeO2 = metal oxide, Me = Si, Ti, Zr
R = C6H5, R’ = alkyl chain, R’’ = vinyl group
The vinyl group can undergo photo or thermal-initiated polymerization reactions with both alkyl and vinyl substituents in the photo-or thermal curable regime.14
The degree of organic polymerization is another factor that can be optimized to control material properties.
In another example poly(methyl methacrylate) (PMMA) was synthesized in situ with TiO2 obtained from titanium butoxide. Concentrations of TiO2 ranging
from 6.4 to 53.6 % by weight were included in PMMA and resulted in
significantly greater thermal stability than observed for pure PMMA.17 Another
study shows that the ionic and conductive properties of a polyethylene oxide (PEO)-based polymer can be combined with the stability and network-forming capabilities of a titanium sol-gel to create coatings suitable for electrochemical devices.18
1.5 Sol-Gel Chemistry Applied to Prevent the Nucleation and Adhesion of Ice
In all of the examples above, sol-gel chemistry was applied to create an inorganic network. The coating in this work applied sol-gel chemistry to
facilitate the slow release of melt-point depressants, specifically tripropylene glycol (TPG) and glycerol to the coating surface. While an inorganic network is formed, it is not the desired product in this application.
Precursor substitution reactions, such as those shown in figure 1-6, are utilized to limit hydrolysis kinetics. For this application, precursor substitution was not performed for the specific purpose of controlling hydrolysis, but to attach the melt-point depressants, TPG and glycerol. The alkoxide precursor used in this reaction is titanium isopropoxide (TIP), which is reacted with a 3:1
stoichiometric ratio of TPG to glycerol. This ratio was chosen by trial and error; product testing indicates this ratio yielded the best performance. Further explanation for this is provided in subsequent chapters.
reactions is shown in figure 1-14. In this study the term ‘melt-point depressant’ is used to describe the entire sol-gel system.
Ti O O O O CH CH CH3 CH3 CH3
H3C
CH CH3
H3C
CH H3C
H3C
H2
C
O CH CH3
H2C
OH CH CH3 O C H2 HC OH
H3C
Titanium Isopropoxide
3
CH H2C
OH H2C
OH OH Glycerol
+
+
Tripropylene Glycol Ti O O O O H2CCH2
CH2
CH2
CH OH
CH2 OH
H C
H3C O
H2 C CH CH3 O C H2 CH CH3 OH CH CH3 O H2C
C H O
CH3
H2C
HC H3C
OH
HC CH3 O H2C
CH O CH3 CH2 HC CH3 HO CH
H3C OH
CH3
4
+
Isopropanol
Figure 1-13: Reaction of TIP with TPG and glycerol
network. Ti O O O O H2C
CH2
CH2
CH2
CH OH
CH2 OH H
C H3C O
H2 C CH CH3 O C H2 CH CH3 OH CH CH3 O H2C C H O
CH3
H2C
HC H3C
OH
HC CH3 O H2C
CH O CH3 CH2 HC CH3 HO Ti O O O H2C
CH2
CH2
CH OH
CH2 OH
H C H3C O
H2 C CH CH3 O C H2 CH CH3 OH HC CH3 O H2C
CH O CH3 CH2 HC CH3 HO Ti O O O H2C
CH2 CH2
CH OH
CH2 OH CH
CH3 O H2C C H O
CH3
H2C HC H3C
OH
HC CH3 O H2C
CH O CH3 CH2 HC CH3 HO O Ti O O O O H2C
CH2 CH2
CH2
CH OH
CH2 OH H
C H3C O
H2 C CH CH3 O C H2 CH CH3 OH CH CH3 O H2C
C H O
CH3
H2C HC H3C
OH
HC CH3 O H2C
CH O CH3 CH2 HC CH3 HO H2 C
O CH CH3 H2C
OH CH CH3 O C H2 HC OH
H3C
H2O
+
+
2Tripropylene Glycol
Figure 1-14: Condensation reaction resulting in the slow release of TPG and glycerol to the coating surface
1.6 Objectives
2.
Experimental
The techniques used in this work are briefly described below.
Contact Angle Goniometry
Contact angle measurements were made using a Rame-Hart Goniometer, Model 100-100. A 6 µL drop of water was brought into contact with a level coating surface, and an image was captured with the attached optical camera. Contact angle was measured on each side of the drop.
Scanning Electron Microscopy (SEM)
SEM imaging was performed using an Hitachi S-3200N Environmental SEM with an secondary electron detector. Measurements were made at 5-10 kV. The low concentration of carbon black in the coating was sufficient to allow imaging without charging.
Energy Dispersive Spectroscopy (EDS)
EDS measurements were made using an x-ray detector attached to the SEM. X-ray maps and secondary electron images were taken
Atomic Force Microscopy (AFM)
AFM images were performed using a Dimension 3000 Scanning Probe Microscope in tapping mode. Both topographical and phase images were collected.
Fourier-Transform Infrared Spectroscopy (FT-IR)
FT-IR measurements were performed using a Nicolet Nexus 470 Fourier Transform Infrared Spectrometer. Liquid samples were placed on AgCl salt plates and analyzed using transmission FT-IR. Solid samples were analyzed with attenuated reflectance spectroscopy (ATR), using the OMNI SamplerTM accessory. Samples were placed on a rounded Ge crystal and
analyzed via single bounce attenuated total reflectance.
Nuclear Magnetic Resonance (NMR)
1H and 13C NMR measurements were made using a 500 MHz Bruker
Spectrometer. All samples were dissolved in deuterated dimethyl
sulfoxide (DMSO) with the exception of titanium isopropoxide, which was dissolved in deuterated toluene.
Thermogravimetric Analysis (TGA)
Thermogravimetric Analyzer. Samples were heated from room temperature to 400°C at a constant rate of 20°C/minute.
Mass Loss Measurements
Mass loss measurements were performed by weighing samples maintained at a constant temperature as a function of time. Data was then fit to a diffusion model using the hybrid one-term method19 in order to determine diffusion
coefficients.
Materials
All coating samples were prepared by Microphase Coatings, Inc. Details of coating preparation are included in U.S. Patent # 6,702,953.
3. Coating Morphology, Performance and Practice
As described in the introduction, this coating was designed to prevent the nucleation and adhesion of ice. The design consisted of heterogeneous, sub-micron sized phase domains incorporating a multi-component melt-point depressant into a hydrophobic polymer matrix as shown in figure 1-1. The hydrophobic matrix limits the contact area between the surface and a water droplet while the slow-release melt-point depressant forms a thin layer on the surface and prevents ice formation.
3.1 Contact Angle
The hydrophobicity of the matrix was achieved through the addition of
Poly(diethoxysiloxane), which has documented hydrophobic properties, and was characterized using contact angle goniometry. This technique measures the angle between the surface and the water droplet as shown in figure 3-1.
A contact angle between a surface and a liquid droplet is determined by the thermodynamic balance of three interfacial free energies, γSV, γLV and γSL
interfacial area is minimized resulting in a large contact angle as shown in figure 3-1-A. Conversely, a water droplet on a hydrophilic surface has a much lower γsL, and wets the surface resulting in a smaller contact angle as shown in figure
3-1-B.
Advancing contact angle measurements were made by bringing a 6 µL drop of water in contact with the surface of the polymer matrix. Measurements were made for five areas on each of three samples which exhibited an average contact angle of 99.9 +/- 6.7 degrees and verified the hydrophobic nature of the coating matrix.
Ө
Ө
Figure 3-1: Schematic of contact angle for hydrophobic (A) and hydrophilic (B) surfaces
Table 3-1: Contact Angle Measurements for Polymeric Coating Matrix
Sample 1 Sample 2 Sample 3
Left Right Average Left Right Average Left Right Average
94.1 83.4 88.8 97.2 98.2 97.7 106.8 95.5 101.1 101.5 99.7 97.9 85.8 92.8 89.3 104.6 105.1 104.8 113.1 108.1 110.6 108.4 105.4 106.9 101.7 106.3 104 105.1 102.3 99.5 95.0 91.7 93.3 94.8 102 98.4 108.4 113.4 110.9 98.8 98.7 98.8 97.7 96 96.9
Average 101.5 Average 97.2 Average 101.0
Average Over Three Samples 99.9 +/- 6.7 degrees
3.2 Coating Morphology
Scanning Electron Microscopy (SEM), Energy Dispersive Spectroscopy (EDS) and Atomic Force Microscopy (AFM) techniques were used to analyze the
coating morphology and verify the presence of sub-micron sized phase domains.
Figure 3-2-A shows a strong silicon Kα peak detected wit EDS. The x-ray map in
Figure 3-2: (A) Silicon peak in EDS Spectrum (B) x-ray map of silicon corresponding to (C) scanning electron microscopy image of coating
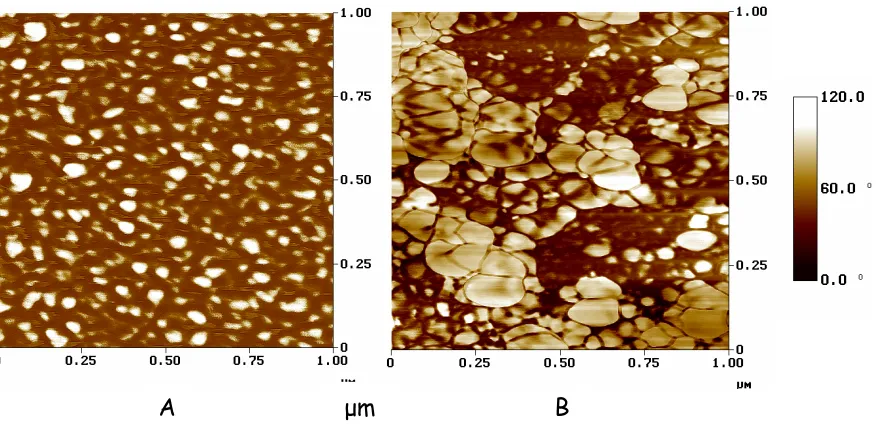
Figures 3-3 and 3-4 show AFM images of much smaller regions of the sample, 5 µm and 1 µm, respectively. In both figures, part (A) is a relatively flat topographical image with root mean squared (rms) roughness values in the
nanometer range. Part (B) is a phase image of the area shown in part (A). Phase images reflect differences in mechanical properties across a surface and are constructed by mapping the phase shift in the probe oscillation which occurs after contact with the surface. Softer, more viscoelastic regions of the coating produce a phase lag in the tip oscillation, producing a greater phase shift. The phase images in figures 3-3 and 3-4 show significant compositional differences within relatively flat areas, supporting the belief that the melt-point depressant and the polymer matrix form sub-micron sized phase domains.
20 µm 20 µm
Figure 3-3: (A) Topographical AFM image of coating, 5 µm2; Z range = 375 nm;
roughness (rms) = 32 nm (B) AFM phase image
Figure 3-4: (A) Topographical AFM image of coating, 1 µm2; Z range = 15 nm;
roughness (rms) = 1.5 nm (B) AFM phase image
A
µm
Bµm
B3.3 Release of Tripropylene Glycol and Glycerol
The coating design relied on the presence of sub-micron sized phase domains of melt-point depressant as shown above. The ‘melt-point depressant’ added to the coating was designed to undergo condensation reactions as shown in figure 1-14, resulting in the slow release of tripropylene glycol (TPG) and glycerol to the coating surface. The chemistry of the melt-point depressant is discussed in more detail in subsequent chapters.
Both TPG and glycerol are water-soluble. Surface concentrations of these molecules are necessary for effective prevention of the nucleation and adhesion of ice; however, these concentrations are depleted upon exposure to water. Therefore, the release of TPG and glycerol to the surface is crucial to the coating lifetime. This process was studied using several different techniques.
Figure 3-5 shows data collected while the coating was immersed in water. The coating was removed from the water, patted dry and weighed at various time intervals. Mass loss is plotted as a function of (time)1/2. After the initial
absorbed an average of 20% of their weight in water and exhibited an average mass loss of 21 weight %. Twenty-two percent of the coating mass consisted of TPG and glycerol prior to water immersion.
-0.04 -0.02 0 0.02 0.04 0.06 0.08
0 100 200 300 400 500 600 700 800
Mass
(g
ra
m
/g
ra
m
)
time1/2 (sec1/2)
Figure 3-5: Mass loss measurements made during water immersion at 30°C; coating absorbed an average of 20 weight % water, lost an average of
21 weight % TPG and glycerol
leaving behind the leachant which was analyzed using FT-IR. Spectra were also obtained for TPG and glycerol. Figure 3-6 shows the leachant spectrum
compared to the spectrum of a 3:1 mixture of TPG and glycerol and confirms that TPG and glycerol leached out of the coating in the presence of water.
0.0 0.2 0.4 0.6 0.8 1.0 1.2 1.4 1.6 1.8 2.0
0 500
1000 1500
2000 2500
3000 3500
4000
Wavenumber (cm-1)
Ab
so
rb
an
ce
Leachant
TPG & Glycerol, 3:1
Figure 3-6: FT-IR spectrum of leachant obtained during water immersion
after the surface had been wiped clean and an image of the same area taken 20 hours later showing small droplets of TPG and glycerol on the surface.
Figure 3-7: Optical images of coating taken at room temperature (A) after the surface was wiped clean and (B) 20 hours later; small droplets of TPG and
glycerol are visible on the coating surface
Subsequently, mass loss measurements were collected for the coating in atmospheric conditions. Figure 3-8 shows mass loss plotted as a function of (time)1/2for a coating sample in an oven at 50°C and again indicates an ultimate
mass loss of 21%. Despite the higher temperature, mass loss in atmospheric conditions took more than twice as long as that measured during water
immersion. This is due to the fact that the sol-gel reaction requires water as indicated in figure 1-14. The sol-gel reaction is therefore dependent on the
2 mm
amount of water available for reaction, which is obviously greater in the water immersion experiments.
Similar mass loss measurements are presented in later chapters for several different coating formulations at several different temperatures; these were used to estimate the length of time required to deplete concentrations of TPG and glycerol. While no direct correlations were made, this value was taken as an indication of the coating’s expected performance lifetime.
0 0.05 0.1 0.15 0.2 0.25
0 200 400 600 800 1000 1200
M
as
s L
oss
(gr
am
/gr
am
)
time1/2 (sec1/2)
3.4 Coating Morphology after Water Immersion
Figure 3-9: SEM images (A) before and (B) after water immersion indicate an increase in surface roughness with the loss of TPG and glycerol
Figure 3-10: AFM images (A) before and (B) after water immersion indicate the presence of sub-micron sized phase domains
1 mm 1 mm
A B
µm
3.5 Coating Performance
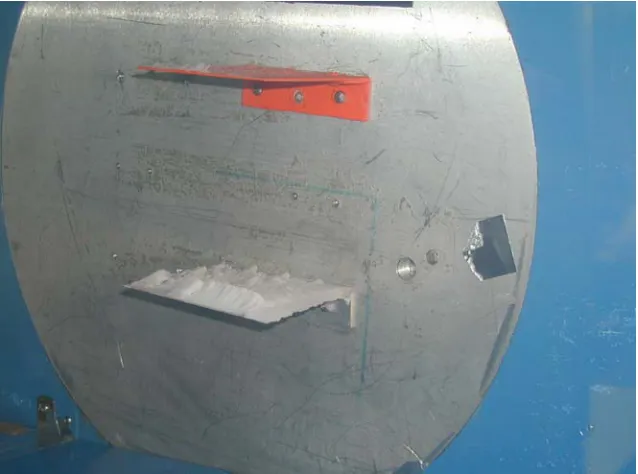
The coating’s ability to prevent the nucleation and adhesion of ice was tested in an icing wind tunnel. These tests were conducted by Microphase Coatings, Inc. Structures were built to emulate vortex generators and an airfoil on the B2 bomber, the aircraft for which the coating was initially designed. Air speed in the tunnel was 150 mph for all of the runs with humidity at 91.4%, a liquid water content of 0.76 g/m3 and a mean droplet size of 18 µm.
Figure 3-11 shows a vortex generator after being in the icing wind tunnel for approximately 20 minutes at -2°C. The uncoated steel surface exhibited
significant ice build-up at the leading edge and on the horizontal surfaces. The coated surface (orange) exhibits only a small amount of ice build up on the leading edge. However, this fell off at the conclusion of the run when the wind speed was reduced.
Figure 3-11: Vortex generator after being in the icing wind tunnel for approximately 20 minutes at -2°C; the coated surface (orange) exhibited
negligible ice build-up relative to the uncoated steel surface
Figure 3-12: Vortex generator after being in the icing wind tunnel for only a few minutes at -9°C; the coated surface (orange) exhibited negligible ice build-up
Figure 3-13 shows an airfoil after being in the icing wind tunnel for
approximately 12 minutes at -15°C. While the image is less clear than those shown in figures 3-11 and 3-12, ice build-up on the coated surface (black) was much less than that observed on the uncoated steel surface. As the airfoil was rotated, ice adhered to the uncoated portion while the coated section shed most of its ice.
Figure 3-13: Airfoil after being in the icing wind tunnel for approximately 12 minutes at -15°C; the coated surface (black) exhibited negligible ice build-up
3.6 Summary and Conclusions
The coating design, consisting of sub-micron sized phase domains of a
hydrophobic matrix and a sol-gel melt-point depressant complex, was verified using contact angle goniometry, SEM, EDS and AFM techniques.
Mass loss measurements made on the coating both in water at 30°C and in an oven at 50°C, optical microscopy and FT-IR analysis confirmed the slow release of TPG and glycerol to the coating surface.
4. Mass Loss Behavior of the Coating and the Melt-Point
Depressant Complex
As described in earlier chapters, the coating incorporates sub-micron sized domains of melt-point depressant within a hydrophobic matrix in order to prevent the nucleation and adhesion of ice. The melt-point depressant complex was synthesized from tripropylene glycol (TPG) and glycerol to form the sol-gel complex shown in figure 1-13. This complex then undergoes a condensation reaction resulting in the slow release of TPG and glycerol to the coating surface. The presence of these molecules on the surface is necessary for effective prevention of the nucleation and adhesion of ice; however, their concentrations are depleted with time and exposure to water. The rate at which TPG and glycerol diffuse to the coating surface affects both the
coating’s performance and its lifetime. This chapter addresses kinetics of mass loss in a few different coating formulations and in the isolated melt-point
depressant complex.
Mass loss in the coating is due to the loss of IPA, TPG and glycerol and is the result of two different processes. IPA is released through precursor
determine the rate at which these molecules are released from the sol-gel complex. Once mobile, these molecules diffuse through the coating to its surface. Mass loss kinetics are therefore dependent on the rates of both
reaction and diffusion. In this study, diffusion was assumed to be the slower of these two processes and therefore rate-determining. Data presented in this chapter and the following chapter support this initial assumption .
4.1 Mass Loss in Coating
Mass loss in the coatings was assumed to be diffusion-limited. Therefore, attempts to control the mass loss kinetics consisted of choosing coating additives that would control the diffusion of TPG and glycerol out of the coating. While no direct correlation has been made between the rate of diffusion and coating performance or lifetime, slower diffusion is expected to increase the time that the coating is effective. However, diffusion should be fast enough that surface concentrations of TPG and glycerol are not depleted faster than they can be replaced.
outlined in table 4-1. Both coating matrices contained both
poly(diethoxysiloxane) (12.8%) for its hydrophobic properties and
3-glycidoxypropyltrimethoxysilane (8.7%), a crosslinked epoxy mixture included for physical hardness. Other details of the coatings are outlined in U.S. Patent # 6,702,953.
Table 4-1: Additives in Two Coating Formulations Formulation Melt-Point
Depressant* Additives
A 26 % 20 µm mica filler (25%)
B 36 %
8 µm hollow glass spheres (3.6%)
polytetrafluroethylene (Teflon®) powder (7.3%) silicone reacted with hexadecane (2.7%) * All percentages were calculated based on weight
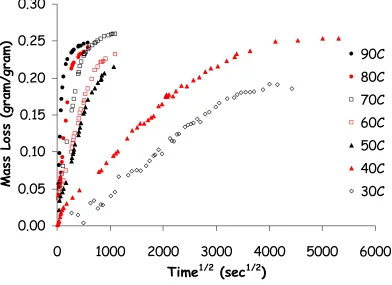
The 20 µm mica flakes were included in formulation A to slow down the diffusion of TPG and glycerol. Figure 3-8 shows mass loss measured for formulation A due to the release of TPG and glycerol under atmospheric
conditions at 50°C. The same experiment, measuring mass as a function of time, was performed at temperatures ranging from 30 to 90°C. The results are
shown in figure 4-1. The coating exhibits typical Fickian diffusion; mass loss increases linearly as a function of (time)1/2 and then levels off as the
that diffusion rates increase drastically with temperature. At 40°C, mass loss levels out at approximately 4000 sec1/2 (~26 weeks) while at 90°C, mass loss
levels out at approximately 250 sec1/2 (~17 hours). Measurements at 30°C may
not have reached equilibrium.
0.00
0.05
0.10
0.15
0.20
0.25
0.30
0
1000
2000
3000
4000
5000
6000
Time
1/2(sec
1/2)
M
ass L
oss (
gra
m
/g
ra
m
)
90C
80C
70C
60C
50C
40C
30C
Figure 4-1: Mass loss behavior for coating formulation A
While limiting diffusion of TPG and glycerol increases the coating lifetime, the release of these chemicals is essential for effective prevention of the
nucleation and adhesion of ice. This coating formulation also contains low molecular-weight silicone pre-reacted with hexadecane. The silicone bonds to the siloxane in the matrix while hexadecane is incompatible with both TPG and glycerol and serves as a driving force for removal of these components from the coating.
Ideally, these variables would have been altered systematically in order to determine the combination of additives that maximizes both coating
0.00 0.05 0.10 0.15 0.20 0.25 0.30 0.35
0 1000 2000 3000 4000 5000 6000
Time1/2 (sec1/2)
Ma
ss
L
os
s (
gr
am/
gr
am
)
90C 80C 70C 60C 50C 40C 30C
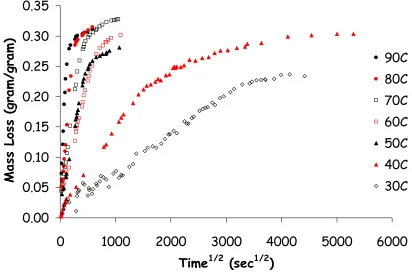
Figure 4-2: Mass loss behavior for coating formulation B
0 0.05 0.1 0.15 0.2 0.25
0 100 200 300 400 500 600
Mas
s Loss
(g
ra
m
/gram
)
Time1/2 (sec1/2)
Figure 4-3: Diffusion model curve fit for mass loss data collected for formulation A at 90°C
Table 4-2 lists the diffusion coefficients for both coating formulations at temperatures between 30 and 90 °C and indicates that diffusion coefficients are greater for formulation B by approximately a factor of two.
Table 4-2: Diffusion Coefficients for Coating Formulations A and B
Formulation A Formulation B
Temperature
(°C) 1011 * D
(cm2/sec) (gram/gram) Mass Loss 10
11 * D
(cm2/sec) (gram/gram) Mass Loss
30 1.93 0.21 3.29 0.25 40 22.9 0.22 44.5 0.28 50 28.4 0.21 58.6 0.27 60 71.4 0.24 129 0.30 70 304 0.26 692 0.30 80 441 0.24 833 0.31 90 891 0.24 2070 0.27
The temperature dependence of diffusion is described by the Arrhenius equation:
RT -E
0
e
D
D
=
where D0 is a pre-exponential factor and E is the activation energy for
diffusion. This equation can be rearranged to:
RT * 2.3
E )
log(D log(D)= 0 −
so that a plot of log (D) vs. 1/T yields a straight line with a slope of
R * 2.3
E
−
and
an intercept of log(D0). A plot for both formulations is shown in figure 4-4.
-11 -10 -9 -8 -7
0.0027 0.0028 0.0029 0.003 0.0031 0.0032 0.0033 0.0034
1/Temperature (K-1)
log
(
D
)
Formulation A, E = 21.3 kcal/mol Formulation B, E = 22.4 kcal/mol
Figure 4-4: Arrhenius plots for coating formulations A and B
While the diffusion coefficients are greater for formulation B, minimal differences are observed in the activation energies for the two coatings. Formulation B exhibits only a slightly larger activation energy, and deviations from the curve fit create some uncertainty in these values.
4.2 Mass Loss in the Melt-Point Depressant
In order to better understand the mass loss kinetics in the coating, mass loss measurements were made on the neat melt-point depressant system
immediately after mixing. Titanium isopropoxide (TIP) was added to a 3:1 stoichiometric mixture of TPG and glycerol. The heat generated upon the addition of TIP and the odor of isopropyl alcohol (IPA) indicated an immediate reaction occurred. After mixing at high speed for a minute, a measured volume of the reaction mixture was transferred to a Petri dish. The layer of viscous liquid was then treated as a thin film and mass loss measurements were
performed in the same manner described for the coating formulations. Figure 4-5 shows mass loss data for the melt-point depressant collected at
0.0 0.1 0.2 0.3 0.4 0.5 0.6 0.7 0.8 0.9 1.0
0 1000 2000 3000 4000 5000 6000 7000 8000
Time1/2 (sec1/2)
M
ass
L
oss
(gr
am/gram)
90C 80C 70C 60C 50C 40C 30C 22C
Figure 4-5: Mass loss behavior for the melt-point depressant
In contrast to the mass loss data collected for the full coating formulations, which was easily fit to a diffusion model, mass loss does not appear to exhibit simple Fickian diffusion. Mass loss increases sharply before leveling off between ten and fifteen percent and then increases again. This behavior was compared to a general model for mass loss in sol-gel systems. This model is shown in figure 4-6 and then applied to data obtained for the melt-depressant in figure 4-7.
and Sommerdijk attribute the first region of mass loss to the loss of alcohol.11
In this case, isopropyl alcohol (IPA), formed during the reaction of TIP with TPG and glycerol, diffuses out of the gel. Minimal shrinkage is observed in this region, because IPA leaves from pores already present in the gel.
Figure 4-6: Three regions of mass loss in a sol-gel
The second region is attributed to the loss of organics, in particular TPG and glycerol released during condensation reactions. Both weight loss and shrinkage occur in this region. The gel cracks as Ti-O-Ti crosslinks are formed. The extent of cracking depends on the reaction rate, the thermal history and the pore density and size within the gel.
Reaction Coordinate (Time/Temperature)
W
ei
gh
t L
oss (%
)
Vo
lu
m
e L
oss (%
)
Weight Loss %
Fractional Shrinkage %
II
The third region is attributed to structural relaxation within the gel. Pores were formed during condensation reaction and the subsequent release of TPG and glycerol. The sol-gel rearranges to minimize its surface area (Ostwald ripening). As a result, shrinkage is observed with minimal weight loss. The mass loss that occurs in this region is attributed to the release of entrapped
molecules with structural rearrangement.
Figure 4-7 shows mass loss data obtained for the melt-point depressant at 70°C. The letters along the curve correspond to images of the sample displayed in Figure 4-8.
Immediately after mixing, the components of the melt-point depressant
crosslinks had formed as a result of condensation reactions. The many
different phase regions within the gel scattered light and made the gel appear white and opaque as shown in figure 4-8b.
0 0.1 0.2 0.3 0.4 0.5 0.6 0.7 0.8 0.9
0 200 400 600 800 1000
time1/2 (sec1/2)
M as s Lo ss (g ra m/ gr am )
Figure 4-7: Three regions of mass loss observed for the melt-point depressant at 70°C
black data points indicate loss of IPA (region 1)
open red data points indicate slow loss of TPG before crack formation (region 2) closed red data points indicate loss of TPG after crack formation (region 2)
blue data points indicate structural relaxation (region 3)
Mass loss continued as the condensation reactions proceeded, accompanied by the release of TPG and glycerol. Cracks formed as Ti-O-Ti crosslinks increased the density of the gel; this mechanism is represented in figure 1- 5. As cracks
a
b
c
d
e
f
Loss of TPG and Crack Propagation
Loss of TPG and Crack Formation
Diffusion of IPA
Structural Relaxation
formed (figure 4-8c), the rate of diffusion increased. This region is marked with solid red circles in figure 4-7.
a (time = 0) b (time = 35 minutes, 70°C)
c (time = 22 hours, 70°C) d (time = 29 hours, 70°C)
e (time = 2 days, 70°C) f (time = 3 days, 70°C) Figure 4-8: Physical changes in the melt-point depressant
As described earlier, the nature of the cracks formed depends on the rate of reaction. Figure 4-9 shows mass loss data obtained for the melt-point
depressant at 22°C. While the data did not reach equilibrium, the initial regions of mass loss are evident.
0 0.1 0.2 0.3 0.4 0.5
0 1000 2000 3000 4000 5000 6000 7000
time1/2 (sec1/2)
Ma
ss
L
oss
(
gr
am/
gr
am
)
Figure 4-9: Three regions of mass loss observed for the melt-point depressant at 22°C
black data points indicate loss of IPA (region 1)
open red data points indicate slow loss of TPG before crack formation (region 2) closed red data points indicate loss of TPG after crack formation (region 2)
Figure 4-10 shows images corresponding to points (c) and (d) on the mass loss curve. While mass loss occurs more slowly at 22°C than at 70°C, points (c) and (d) in figure 4-9 occur at similar points along the mass loss curve as the
c
d
corresponding points in figure 4-7. Figure 4-10c shows cracks, which have propagated in figure 4-10d. The cracks appear much larger than those observed at 70°C. The slower reaction rate at low temperatures allows for additional Ostwald ripening and structural rearrangement that minimizes the surface area of the gel. As described in the introduction, this process is favored thermodynamically, but limited by kinetics. In addition, the viscosity increase of the pore liquid with temperature is generally not proportional to the increase in reaction rate. This creates a build-up of pressure in the pores of the gel, which leads to additional cracking. Both of these phenomena describe the increased crack density at higher temperatures.
c (32 weeks, 22°C) d (49 weeks, 22°C)
The mass loss of the melt-point depressant was also analyzed using
thermogravimetric analysis (TGA), a technique capable of separating mass loss due to IPA, TPG and glycerol. A TGA scan from 25 to 400°C is shown in figure 4-11. In contrast to the isothermal measurements which track mass loss, TGA scans track the mass remaining at each temperature during the scan. The second axis shows the derivative of mass loss, which indicates the rate of mass loss at each temperature. The first region is again attributed to the loss of IPA. The derivative plot supports this, showing a maximum rate of mass loss occurs at approximately 72°C, slightly below the boiling point for IPA (82°C). The second region of mass loss is due to the loss of TPG and glycerol released during condensation reactions. The derivative curve shows two peaks in this region at 200 and 245°C, respectively for TPG and glycerol. These regions of mass loss were identified by the size of each peak and their proximity to the boiling points for each species, 273 and 290°C, respectively for TPG and glycerol.