Charge and the dry-strength performance of polyampholytes. Part 1: Handsheet properties and polymer solution viscosity
21
0
0
Full text
(2) work is intended to clarify the relationship between such strength gains and the charged nature of these polymers. Any discussion of dry strength effects of papermaking wet-end additives needs to begin with consideration of bond formation between fibers [5]. Work by Howard and Jowsey [6] showed that effects of cationic starch, the most widely used dry-strength additive, are consistent with increased joint strength per unit bonded area. McKenzie [7] and Pelton et al. [8] described dry strength development in terms of a three-dimensional solubilization of the bonding agent with wood-derived macromolecules extending from fiber surfaces. The subject of joint strength and the role of bonding agents has been reviewed recently [9]. Based on recent work, inter-fiber bond strength is expected to increase with increasing molecular mass of a dry-strength additive [10]. Evidence suggests that the initial adsorbed conformations are random coils, similar to the situation in bulk solution, and that the macromolecules subsequently rearrange themselves onto the substrate surfaces [11-12]. Due to the relatively short processing times in the wet end of a paper machine, one cannot assume that adsorbed conformations reach an equilibrium state. The degree to which the polymer adopts a flattened adsorbed conformation, or otherwise rearranges itself, is expected to depend on time, molecular mass, the charge density of the polymer, the strength of interactions between molecular segments and the substrate, the degree of solubility of the polymer in the solution, the existence of branching or crosslinking within the polymer, and the ionic strength of the solution [13-15]. The molecular extension of polyampholytes is expected to depend on the same factors, and also on the ratio of monomeric charged groups of each sign [16-19]. The adsorption of.
(3) polyampholytes also has been considered by others [20-21]. Viscosity tests have been found to be a convenient way to study factors that affect molecular extension [16,22-24]. Soluble aluminum compounds have been of great interest to paper technologists [25], as well as to scientists investigating the ionic speciation [26-27] or optimization of aluminum compounds for coagulation of suspensions [28-31]. Complexation can be expected when aluminum compounds are added to solutions of anionic polyelectrolytes [25,32-33]. Recent results suggest that certain ionic species of aluminum can maximize interactions with anionic polyelectrolytes [34], as well as coagulation of suspensions of negatively charged particles [31]. The present work is aimed at elucidating the effect of polyampholyte overall charge density and charge ratio on the development of dry strength and the synergies that occur in the presence of aluminum ions. The experimental approach employed in the present work involved treatment of bleached kraft fiber slurries with a series of acrylamide-based polyampholytes, all having similar molecular mass, but with a wide range of charge density. In an effort to achieve efficient retention of the polymers onto the weakly negative fiber surfaces, the ratio of basic to acidic groups was 5:4. This ratio caused the polyampholytes to have a weak net positive charge under neutral to positive pH conditions. After treatment of the polyampholytes, certain slurry samples were subsequently treated with poly-aluminum chloride (PAC). The order of addition was selected to give the greatest opportunity for interaction of transient highly cationic aluminum ions [26-27] with carboxylate groups on both the polyampholytes and on the fiber surfaces. Parallel tests were carried out with polyelectrolyte samples (single charge), making it possible to distinguish behaviors unique to polyampholytes..
(4) EXPERIMENTAL Experiments were conducted in deionized water prepared with an ion-exchange system from Pureflow, Inc. The poly-aluminum chloride (PAC) was Compozil Eka ATC 8210 from Eka Chemicals, Paper Chemicals Div. The product was added on an asreceived basis. Other inorganic chemicals all were of reagent grade.. Polymer Preparation and Characterization Polyampholyte and polyelectrolyte samples were prepared by free-radical polymerization, following the molar content of charged monomers indicated in Table 1. The cationic monomer was N-[3-(N’,N’-dimethylamino)propyl]acrylamide (DMAPAA), a tertiary amine. The anionic monomer was a dicarboxylic acid, itaconic acid (IA). In each case a sufficient amount of neutral acrylamide monomer was added to adjust the total molar content to a fixed value and the mole ratio of cationic to anionic groups was also kept constant (5:4 for samples A through D). The mol % of DMAPAA and IA was corroborated by 1H and 13C nuclear magnetic resonance (NMR). Solution viscosities, as shown, were obtained with a Brookfield Model B8L viscometer (Tokimec, Inc.) at approximately 15% solids at 25 oC, with pH=4, and with electrical conductivities as indicated in Table 1. Table 1. Synthesis of acrylamide-based polyampholytes (A-D) and simple copolymers (F-G) Polymer DMAPAA IA Viscosity* Mw ** Electrical Sample 6 type (mol %) (mol %) (10 cond. *** (mPa⋅s) Daltons) (mS/cm) Ampho2.5 1 5300 2.95 5.5 A teic 5 2 4900 2.85 7.9 B 10 4 4000 2.90 12 C 20 8 2400 2.93 19 D.
(5) Cationic 5 0 3600 2.98 F Anionic 0 2 5300 3.23 G o -1 * 25 C and 100 s . ** SEC-LALLS-VIS (TDA-302, Viscotek). *** 13-16 oC. 6.2 4.4. Handsheet Preparation Tests involving handsheets were carried out with bleached hardwood kraft fibers that had been beaten with a laboratory Hollander refiner (Valley Machinery Co., Appleton, WI) to a Canadian Standard Freeness value (TAPPI Test T227) of 440 ml. The refined fibers were then placed in a 200-mesh screen chamber of a Bauer-McNett classifier apparatus (see TAPPI Method T233). The classifier was run for 15 minutes, per batch, to substantially remove fiber fines from the suspension, a process that is sometimes called “decrilling.” The decrilling procedure was carried out to simplify interpretation of results to be presented later, since any polymer becoming adsorbed onto fibers is to be retained in the final paper. The decrilled suspension had a freeness of approximately 600 ml CSF. The fibers then were resuspended as a 0.5% slurry in 10-4 M sodium bicarbonate solution, to which sufficient sodium sulfate had been added to reach an electrical conductivity of 1000 µS/cm at 23 oC. Polyampholyte solutions were added at selected levels, as will be noted later, and with constant stirring to the fiber suspension. Stirring was continued 60s before preparation of handsheets. In order to maintain the same salt concentration during formation of the paper, sufficient sodium sulfate solution to achieve an electrical conductivity of 1000 µS/cm was added to the a British sheet mold just before fiber slurry was added to make the handsheets, following TAPPI Method T205. In the case of tests involving PAC addition, the pH was initially adjusted with NaOH or H2SO4. The polyampholyte or polyelectrolyte solution was added first,.
(6) followed by PAC addition. The pH of the fiber slurry was pre-adjusted in such a way that the suspension’s pH reached the reported value upon addition of PAC. Sufficient sodium sulfate and either NaOH or H2SO4 were added to the handsheet mold so that the same pH and electrical conductivity were maintained throughout the forming process. The reason for adding the PAC last was in order to allow immediate interaction of aluminum ions with carboxylate groups in the system, including those on the polymers. A different order of addition, in which PAC was added first to the suspension, though it would favor interaction of the aluminum ions with fiber surfaces, also would allow a greater proportion of Al(OH)3 in suspension before the ions even have a chance to interact with the charged polymers, which are the main focus of the present work.. Viscosity Tests Viscosities of 0.1% solids aqueous polymer solutions were measured with an Ubbelohde viscometer in a thermostated water bath at 25.0 oC with the addition of sufficient NaCl so that the resulting ionic strength at different pH values remained at 0.01 moles per liter. The pH was adjusted with HCl or NaOH. RESULTS AND DISCUSSION Figure 1 compares the tensile breaking length results for handsheets prepared at the 1% level of polymer treatment, as further outlined in Experimental. Results labeled as “A” through “G” correspond to the employed polymers (see Table 1). As shown, treatment with the polyampholytes (samples A through D) generally resulted in strength gains that were far superior to those achieved by the simple polyelectrolytes (samples F and G)..
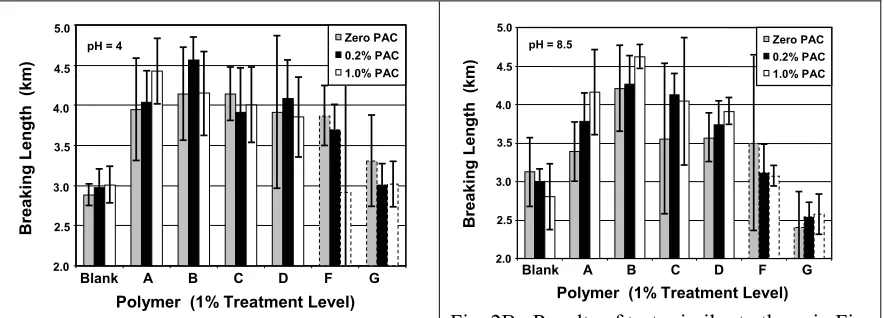
(7) Results shown in Fig. 1 raise various questions involving effects of electrical charges. For example, why, in the absence of PAC, was the highest strength achieved at an intermediate charge density of the polyampholyte, sample C, which had a molar content of 10% tertiary amine groups and 8% carboxyl groups? And why was the highest strength achieved when a small amount of the highly cationic aluminum-based additive PAC was added to the polyampholyte sample having the lowest density of ionizable groups (sample A)?. 5.0. Zero PAC. Breaking Length (km). pH = 5. 0.2% PAC. 4.5. 1.0% PAC. 4.0 3.5 3.0 2.5 2.0. Blank. A. B. C. D. F. G. Polymer (1% Treatment Level) Fig. 1. Tensile test resulting from treatment of a slurry (pH 5) of bleached hardwood kraft at the levels of PAC as shown following treatment with polymer samples (see Table 1) at the 1% level. The limit bars in Figs. 1-3 show 90% confidence intervals. Dashed outlines indicate simple polyelectrolytes.. Further questions related to how polyampholytes function as dry-strength agents arise from the results of tests at different pH values, as shown in Fig. 2. Comparing the results obtained at pH 4 (Fig. 2A) vs. pH 8.5 (Fig. 2B), it is apparent that the PAC.
(8) addition promoted the dry-strengthening effect with all of the polyampholytes at the higher pH of 8.5, but such treatment with PAC had less benefit to strength at pH=4. Also, it is worth questioning why the dry-strength performance of the cationic polyelectrolyte F was reduced by PAC addition.. 5.0. 1.0% PAC. 4.0 3.5 3.0 2.5. A. B. C. D. F. G. Polymer (1% Treatment Level). Fig. 2A. Results of tests similar to those in Fig. 1, except that the final pH of the slurry, before sheet forming, was 4.0.. 0.2% PAC. 4.5. 1.0% PAC. 4.0 3.5 3.0 2.5 2.0. Blank. Zero PAC. pH = 8.5. Breaking Length (km). Breaking Length (km). 0.2% PAC. 4.5. 2.0. 5.0. Zero PAC. pH = 4. Blank. A. B. C. D. F. G. Polymer (1% Treatment Level). Fig. 2B. Results of tests similar to those in Fig. 1, except that the final pH of the slurry, before sheet forming, was 8.5.. Taken individually, most of the effects of PAC treatment on breaking length, in cases where the fibers had been treated with polyampholytes, were not statistically significant at the 90% confidence levels. What is notable is that PAC treatment, especially at the intermediate level of 0.2% on fiber solids, increased the mean value of breaking length in a large majority of cases. A possible explanation, to be considered in follow-up work, involves an expected complexation reaction of aluminum ions with one or more carboxyl groups. Complexation involving multivalent aluminum ions and carboxylate ions on the fiber surfaces would provide a likely anchoring site for interaction with the carboxylate groups on polyampholytes, increasing the efficiency of adsorption. Likewise, one aluminum ion, especially if it is of the oligomeric type mentioned earlier [26-27], might serve to cross-link carboxylate groups on two adjacent.
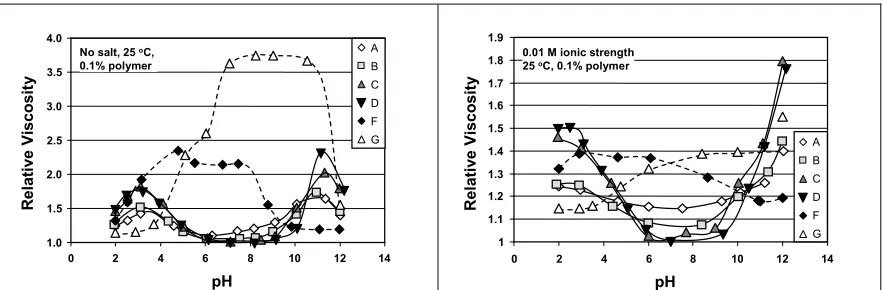
(9) polyampholyte molecules. The combined effects may explain the enhanced efficiency with which polyampholytes contributed to inter-fiber bonding following treatment with PAC. Another explanation, to be considered in follow-up work, involves the effects of PAC on charge characteristics of the polyampholytes and the fiber surfaces. Interaction of an aluminum ion with either an individual carboxylate ions, or perhaps with a pair of such ions, in the case of a dissociated itaconic acid unit in the polyampholytes, would be expected to make the polyampholyte less negative or more positive in net charge. These issues will be dealt with in a companion article. Viscosity Analysis To account for the tensile strength results presented above, a series of experiments was carried out to evaluate the bulk properties of the polymer solutions. As shown in Fig. 3A, the relative viscosity of each of the polymer solutions was strongly affected by pH in the absence of salt. First considering the polyampholytes, samples A through D, there was a broad minimum in relative viscosity centered at about 6<pH<7. The viscosity of the polyampholytes generally increased with increasing difference in pH relative to neutrality, except that the viscosity fell again at the extremes of pH, below about pH=3 and above about pH=11. The initial increase in viscosity with increasing difference of pH relative to the neutral region is consistent with an expected increase in net ionic charge of the polymers, noting that the degree of dissociation of both the acidic and the basic groups on the polyampholytes will be a function of pH [16,35]. An increase in net charge is expected to increase the degree of expansion of the molecular conformations in solution [13,36-37]. The subsequent decreases in viscosity of.
(10) polyampholyte solutions as the extreme values of pH are approached are consistent with the increase in ionic strength of solution resulting from addition of large amounts of acid or base. In these cases the counterions screen the electrostatic and osmotic forces, collapsing the charged polymers. Though the family of viscosity curves corresponding to the polyampholytes A through D share a strong similarity, some subtle effects of charge density are apparent. Viscosity increased with increasing charge density in the neighborhoods of both pH=3 and pH=11. These results, once again, are consistent with increasing molecular expansion with increasing amounts of fixed ionic charge on a macromolecule. Another hypothesis to explain the results corresponding to polyampholytes in Fig. 3A can be tested. According to this hypothesis inter-macromolecular associations can lead to an effective increase in molecular mass, thus increasing the measured viscosity. The observations do not support this hypothesis. In the case of randomly polymerized polyampholytes, such as those considered in the present work, interactions between adjacent macromolecules are expected to be maximized under conditions of charge neutrality. Supplementary tests showed that the polyampholytes had close to zero zeta potential near to pH=7, the region in which viscosity values were minimized. The results in Fig. 3A can be further interpreted by considering the reactivity ratios of the monomers which can be calculated as follows, r1 = k11 / k12 = (Q1 / Q2) exp[-e1 (e1 – e2)]. (1). r2 = k22 / k21 = (Q2 / Q1) exp[-e2 (e2 – e1)]. (2).
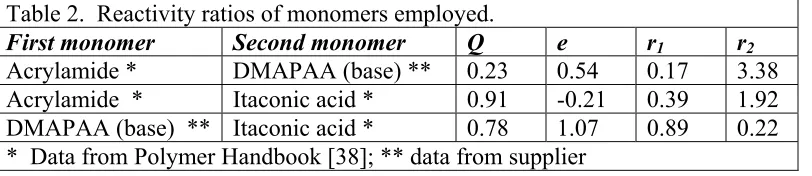
(11) where Q is a measure of the resonance stabilization of the growing radical and the monomer and, e, a measure of their polarities [38 ]. The respective reaction constants (k11, k12, k21 and k22) correspond to the following free-radical reactions, M1* + M1 → M1 M1* (rate const. = k11). (3). M1* + M2 → M1 M2* (rate const. = k12). (4). M2* + M2 → M2 M2* (rate const. = k22). (5). M2* + M1 → M2 M1* (rate const. = k21). (6). The reactivity ratios for pairs of monomers involved in our system were calculated according to the equations presented before and are shown in Table 2: Table 2. Reactivity ratios of monomers employed. First monomer Second monomer Q e Acrylamide * DMAPAA (base) ** 0.23 0.54 Acrylamide * Itaconic acid * 0.91 -0.21 DMAPAA (base) ** Itaconic acid * 0.78 1.07 * Data from Polymer Handbook [38]; ** data from supplier. r1 0.17 0.39 0.89. r2 3.38 1.92 0.22. While admitting the approximate nature of these estimated reactivities (the Alfrey-Price parameters available for the three monomers considered in this work do not take into account steric effects nor ionic interactions), one can conclude that both of the ionic monomer groups (DMAPAA and itaconic acid) will tend to be consumed earlier by freeradical polymerization, compared to the consumption of uncharged acrylamide monomers. In addition, it is reasonable, based on the values in Table 2, to expect a higher frequency of reactions between base monomer groups, relative to purely random polymerization. Such considerations imply a greater contribution of associations.
(12) between net-negative segments and net-positive segments, both for intra-molecular and inter-molecular interactions [39]. Results corresponding to the polyelectrolyte samples F and G in Fig. 3 can be accounted for in a similar manner. Separate pH titrations showed that the cationic polyelectrolyte F had a pKb value of 9.8, and that the anionic polyelectrolyte G had pKa values of 4.1 and 6.8 for the two adjacent carboxyl groups [40]. Thus, one would expect the molecules in sample F to have a relatively expanded conformation at relatively low pH values corresponding to the charged, protonated form of the tertiary amine groups. Then, with increasing pH above a value of 8 it is reasonable to expect a drop in viscosity, consistent with a reduced molecular extension. Considerations in the case of the anionic polymer G are similar, except that decreasing the pH is expected to increase the proportion of protonated, uncharged carboxylic acid groups relative to charged carboxylate groups on the polymer. Results shown in Fig. 3B, corresponding to an electrical conductivity of 1000 µS/cm, generally show lower values of relative viscosity, consistent with screening of electrical charge interactions within the macromolecular chain. The general pattern of the results, however, was similar to what was observed in the absence of salt. One effect that becomes more evident in Fig. 3B is the differentiation between sample A, the lowestcharge polyampholyte, vs. those of higher density of ionic groups. Near to neutral pH, the solution of sample A was considerably more viscous than the other polyampholyte samples. This observation suggests that the macromolecules in sample A did not have a sufficient density of oppositely charged ionic groups in order to contract the molecules to the same extent as the other polyampholyte solutions at pH=7..
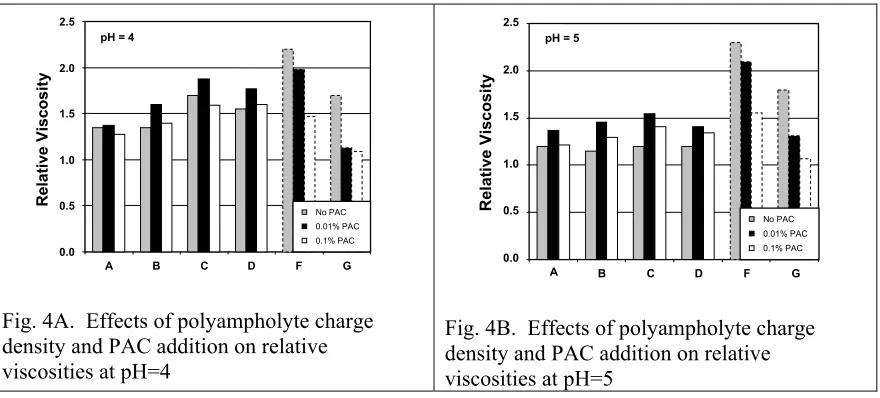
(13) 3.5. 1.9. A. No salt, 25 oC, 0.1% polymer. C D. 3.0. F G. 2.5 2.0 1.5. 0.01 M ionic strength 25 oC, 0.1% polymer. 1.8. B. Relative Viscosity. Relative Viscosity. 4.0. 1.7 1.6 1.5 A. 1.4. B. 1.3. C. 1.2. D. 1.1. F G. 1. 1.0 0. 2. 4. 6. 8. 10. 12. 14. 0. pH. Fig. 3A. Relative viscosity of 0.1% polymer solutions in water as a function of pH in the absence of added salt. Dashed curves indicate simple polyelectrolytes.. 2. 4. 6. 8. 10. 12. 14. pH. Fig. 3B. Relative viscosity of 0.1% polymer solutions in 0.01 M ionic strength solution as a function of pH.. As shown in Fig. 4A, addition of a low level of PAC (0.01% in solution, on an asreceived basis) consistently increased the relative viscosities of polyampholyte solutions in the absence of added salt, both at pH=4 and pH=5. The opposite was seen in the case of simple polyelectrolytes, for which increasing PAC monotonically decreased relative viscosity. A higher level of PAC (0.1%) was no longer effective in increasing the relative viscosity of the polyampholyte solutions. Though there may be various interpretations to account for the results in Fig. 4, it is apparent, first of all, that there exists a specific interaction between PAC and the polyampholytes. It is proposed that the increase in viscosity upon addition of PAC at the 0.01% level is due to complexation between cationic aluminum ionic species and carboxylate groups on the polyampholytes. Since all of the results in Fig. 4 pertain to pH values below the isoelectric points of the polyampholytes, such complexation would be expected to increase the net positive charge in each case, resulting in a more extended conformation. The reversion of the trend at higher PAC is again consistent with increasing ionic strength of the solution..
(14) 2.5. 2.5 pH = 5. 2.0. 1.5. 1.0. 0.5. No PAC. Relative Viscosity. Relative Viscosity. pH = 4. 2.0. 1.5. 1.0. 0.5. No PAC. 0.01% PAC. 0.01% PAC. 0.1% PAC. 0.0 A. B. C. D. F. G. Fig. 4A. Effects of polyampholyte charge density and PAC addition on relative viscosities at pH=4. 0.1% PAC. 0.0 A. B. C. D. F. G. Fig. 4B. Effects of polyampholyte charge density and PAC addition on relative viscosities at pH=5. As indicated by the present results, the conformation of polyampholytes in bulk solution, in the presence and in absence of PAC, is a key factor to explain the adsorption on fibers and the development in dry strength. This is logical if one considers that the behavior of the macromolecules in the bulk solution has an important impact on the adsorbed state. For example, when the polymer is in a more “contracted” state in solution (lower viscosities) or in cases of lower solvency, the adsorbed amount on fiber surfaces is expected to increase, and better bonding is expected as a result. Support to the foregoing explanation is found in our attempt to answer the first question that was proposed in relation to Fig. 1. At pH 5 sample C, used in the absence of PAC, produced the highest strength. Results for polyampholytes A and B are comparable, especially in the conditions used in Fig 2A for breaking length measured for slurries prepared at pH 4. Nevertheless, it is shown consistently that at pH 4 and 5 the purely cationic polyelectrolyte (sample F) performed more poorly than the polyampholyte counterparts. The explanation to this observation lies in the fact that at lower pH (1) the polyampholyte molecules have a smaller hydrodynamic radius (lower.
(15) viscosity) which allows a more effective diffusion and adsorption on the adsorption sites and, (2) they have a net positive charge, that favors electrostatic interactions with the substrate (better adsorption). This explanation is also supported by direct measurement of polymer adsorbed amount on model cellulose films via quartz crystal microbalance (QCM) (data not shown). In fact, sample C showed the highest adsorbed amount at pH 4. Polyelectrolyte F, which is purely cationic, showed a more extended conformation at pH 4 and 5 due to intra-chain repulsion (see viscosity data in Fig. 4B) and therefore is not expected to adsorb as effectively as polyampholyte B, C, or D . This was also confirmed by measurements of the adsorbed amount on cellulose via QCM. In this condition polyelectrolyte F produced relatively small improvement in fiber bonding. Our results also point to the fact that at low pH the polyampholytes of intermediate cationic charge worked better than the other ones. In fact, electrostatic bridging between the polymer-coated surfaces, which is an important contribution in the development of paper strength, also reaches a maximum value at an intermediate value of charge density [41]. In the present case this optimum situation occurred for sample C. At high pH (pH of 8.5) the addition of polymer G produced paper sheets of low breaking length. This is easily explained by the fact that in this condition the polyelectrolyte is effectively anionic and therefore electrostatic repulsion with cellulose surface charges prevents adsorption. Note that paper formation below the pKa of polyelectrolyte G (suspensions of pH 4 or 5), the breaking length of the sheet was higher than at pH 8. This is as expected, since at low pH the negative charge is suppressed (less dissociation) and the polymer is able to adsorb. In the absence of electrostatic repulsion, entropic effects often favor adsorption of high-molecular-mass substances from solution..
(16) At pH 4 or 5 it is interesting to note the synergetic effect that occurs upon addition of the highly cationic PAC additive to the polyampholyte solutions (A-D) This effect is augmented in the case of polyampholytes of low overall charge density, when the pH is low, while it seems that at higher pH (8.5) this synergy occurs more markedly for polyampholytes of higher charge density. The reason for these effects is not obvious, since PAC and the polyampholytes bear the same sign of net charges. This is evident in the case of purely cationic polyelectrolyte F that produced paper with low breaking length. A plausible phenomenon that could explain the above effects is that PAC interacts with the carboxylate moieties of the polyampholyte chains, rendering a net higher cationic character to the polymer that facilitates adsorption. Experimental evidence supports the observed effects [42-43]. On the other hand, the application of PAC with the anionic polyelectrolyte showed the lowest results, due to the fact that complexation and charge compensation occurs between the anionic polyelectrolyte and PAC and the effective charge (of PAC) is reduced.. CONCLUSIONS 1. Charge effects, pH, and the addition of polyaluminum chloride (PAC) significantly affected the dry strength resulting from treatment of bleached kraft fibers with polymers that contained both positively and negatively charged ionic groups. These polyampholytes yielded higher increases in dry strength, compared to polyelectrolytes having ionic groups with only one sign of charge. PAC addition generally benefited paper strength in cases where the fiber slurry had been treated with polyampholytes, but the opposite was true if the fibers had been treated with either a cationic or an anionic polyelectrolyte..
(17) 2. Results of viscosity tests suggested that multivalent positive ions of aluminum form complexes with the carboxylate groups of polyampholytes, making them more cationic, and thus more expanded in solution. 3. Significant effects of PAC on both viscosity and on strength development also are consistent with a cross-linking effect, in which aluminum ions may serve as bridges between carboxylate groups on different entities, such as two polyampholyte molecules or one such molecule and a fiber surface. 4. Although it was generally the case that dry strength increases were maximized under pH conditions not far from those where the solution viscosities of polyampholytes were minimized, the optimum dry-strength resulted from a combination of various effects, most importantly a minimum molecular extension and an optimization of electrical charge interactions.. ACKNOWLEDGMENTS The authors wish to acknowledge the support of the National Research Initiative of the USDA Cooperative State Research, Education and Extension Service, grant number 2004-35504-14655. In-kind support provided by Harima Chemical Co., Inc. is also gratefully acknowledged for preparation of the polyampholytes..
(18) LITERATURE CITED 1. YOSHIZAWA, J., ISOGAI, A., AND ONABE, F., “Analysis and Retention Behavior of Cationic and Amphoteric Starches on Handsheets,” J. Pulp Paper Sci. 24(7): 213218 (1998). 2. FUKUNAGA, Y., “New Application Method of Dry Strength Agents by Effective Utilization of Amphoteric Polyacrylamide and Aluminum Sulfate,” Proc. Japan TAPPI Ann. Mtg., 349- 357 (1999). 3. YOSHIMOTO, Y., IWASA, Y., and FUJIWARA, T., “Study on the Mechanism of PAMs as Dry Strength Agents,” Proc. 2004(71st) Pulp Paper Res. Conf., pp. 126-129 (2004). 4. SATO, A., OGAWA, M., OGUNI, T., and FUJII, M., “Amphoteric PAMs as Dry Strength Resins,” Proc. TAPPI 2005 Practical Papermakers Conf., digital document, TAPPI Press, Atlanta, 2005. 5. PAGE, D.H., “A Theory for the Tensile Strength of Paper,” Tappi 52(4): 674-681 (1969). 6. HOWARD, R.C., and JOWSEY, C.J., “Effect of Cationic Starch on the Tensile Strength of Paper,” J. Pulp Paper Sci. 15(6): J225-229 (1989). 7. McKENZIE, A.W., “The Structure and Properties of Paper. Part XXI: The Diffusion Theory of Adhesion Applied to Interfiber Bonding,” Appita 37(7): 580-583 (1984). 8. PELTON, R., ZHANG, J., WÅGBERG, L., and RUNDLÖF., M., “The Role of Surface Polymer Compatibility in the Formation of Fiber/Fiber Bonds in Paper,” Nordic Pulp Paper Res. J. 15(5): 400-406 (2000). 9. LINDSTRÖM, T., WÅGBERG, L., and LARSSON, T., “On the Nature of Joint Strength in Paper – A Review of Dry and Wet Strength Resins Used in Paper Manufacturing,” Proc. 13th Fundamental Res. Symp., Cambridge, UK, Sept., 2005, Pira International, Leatherhead, Surrey, UK, pp. 457-562. 10. PELTON, R., ZHANG, J., CHEN, N., and MOGHADDAMZADEH, A., “The Influence of Dextran Molecular Weight on the Dry Strength of Dextran-Impregnated Paper,” Tappi J. 2(4): 15-18 (2003). 11. ÖDBERG, L., TANAKA, H., and SWERIN, A., “Kinetic Aspects of the Adsorption of Polymers on Cellulosic Fibers,” Nordic Pulp Paper Res. J. 8(1): 6-9, 47 (1993). 12. COHEN STUART, M.A., and KLEIJN, J.M., “Kinetics of Polyelectrolyte Adsorption,” in Physical Chemistry of Polyelectrolytes, Radeva, T., Ed., Marcel Dekker, New York, 2001, pp. 281-304. 13. FLEER, G.J., COHEN STUART, M.A., SCHEUTJENS, J.M.H.M., COSGROVE, T., and VINCENT, B., Polymers at Interfaces, Chapman & Hall, London, 1993. 14. WÅGBERG, L., “Polyelectrolyte Adsorption onto Cellulose Fibers – A Review,” Nordic Pulp Paper Res. J. 15(5): 586-597 (2000). 15. ROJAS, O. J., ERNSTSSON, M., NEUMAN, R.D., CLAESSON, P.M. “Effect of Polyelectrolyte Charge Density on the Adsorption and Desorption Behavior on Mica,” Langmuir 18(5): 1604-1612 (2002). 16. BEKTUROV, E.A., KUDAIBERGENOV, S.E., and RAFIKOV, S.R., “Synthetic Polymeric Ampholytes in Solution,” JMS - Rev. Macromol. Chem. Phys. C30(2): 233-303 (1990)..
(19) 17. HIGGS, P.G., and JOANNY, J.-F., “Theory of Polyampholyte Solutions,” J. Chem. Phys. 94(2): 1543-1554 (1991). 18. EVERAERS, R., JOHNER, A., and JOANNY, J-F., “Polyampholytes: From Single Chains to Solutions,” Macromolecules 30(26): 8478-8498 (1997). 19. PENG, X., and SHEN, J., “Studies on Salting Effects of DMC-AM-AA Terpolymers in Aqueous Solution,” Acta Polymerica Sinica 1999(6): 736-740 (1999). 20. DOBRYNIN, A.V., RUBINSTEIN, M., and JOANNY, J.-F., “Adsorption of a Polyampholyte Chain on a Charged Surface,” Macromolecules 30: 4332-4341 (1997). 21. MAHLTIG, B., WALTER, H., HARRATS, C., MÜLLER-BUSCHBAUM, P., JÉRÔME, R., and STAMM, M., “Adsorption of Polyampholyte Copolymers at the Solid/Liquid Interface: The Influence of pH and Salt on the Adsorption Behavior,” Phys. Chem. Chem. Phys. 1: 3853-3856 (1999). 22. ALFREY, T., and MORAWETZ, H., “Amphoteric Polyelectrolytes. I. 2Vinylpyridine-Methacrylic Acid Copolymers,” J. Amer. Chem. Soc. 74(2): 436-441 (1952). 23. ASCOLI, F., and BOTRÉ, C., “Amphoteric Behavior of a Copolymer: N,NDiethylallylamine-Acrylic Acid,” J. Polymer Sci. 62 (174): S56-S59 (1962). 24. KATHMANN, E.E., and McCORMICK, C.L., “Water-Soluble Polymers. 71. pH Responsive Behavior of Terpolymers of Sodium Acrylate, Acrylamide, and the Zwitterionic Monomer 4-(2-Acrylamide-2-Methylpropanedimethylammonio) Butanoate,” J. Polymer Sci. A35 (2): 231-242 (1997). 25. STRAZDINS, E., “Theoretical and Practical Aspects of Alum Use in Papermaking,” Nordic Pulp Paper Res. J. 4(2): 128-134 (1989). 26. AKITT, J.W., GREENWOOD, N.N., KHANDELWAL, B.L., and LESTER, G.D., “27Al Nuclear Magnetic Resonance Studies of the Hydrolysis and Polymerization of the Hexa-Aquo Aluminum(III) Cation,” J. Chem Soc. Dalton Trans. 1972(5) 604-610 (1972). 27. BOTTERO, J.-Y., and FIESSINGER, F., “Aluminum Chemistry in Aqueous Solution,” Nordic Pulp Paper Res. J. 4(2): 81-89 (1989). 28. MATIJEVIĆ, E., and STRYKER, L.J., “Coagulation and Reversal of Charge of Lyophobic Colloids by Hydrolyzed Metal Ions. III. Aluminum Sulfate,” J. Colloid Interface Sci. 22(1): 68-77 (1966). 29. HAYDEN, P.L., and RUBIN, A.J., “Systematic Investigation of the Hydrolysis and Precipitation of Aluminum(III)” in Aqueous-Environmental Chemistry of Metals, Rubin, A.J., Ed., Ann Arbor Science Publ., Ann Arbor, MI, 1974, pp. 317-381. 30. DONNAN, M.B., HEALY, T.W., and NELSON, P.F., “An Electrokinetic Study of Alum Coagulation and Polymer Flocculation of Cellulose Pulp Fines,” Colloids Surf. 2(2): 133-143 (1981). 31. EXALL, K.N., and VANLOON, G.W., “Effects of Raw Water Conditions on Solution-State Aluminum Speciation during Coagulant Dilution,” Water Res. 37(14): 3341-3350 (2003). 32. TRKSAK, R.M., “Aluminum Compounds as Cationic Donors in Alkaline Papermaking Systems,” Proc. TAPPI 1990 Papermakers Conf., 229-237, TAPPI Press, Atlanta (1990)..
(20) 33. PENG, F.F., and DI, P., “Effect of Multivalent Salts – Calcium and Aluminum on the Flocculation of Kaolin Suspension with Anionic Polyacrylamide,” J. Colloid Interface Sci. 164(1): 229-237 (1994). 34. CHEN, J., HUBBE, M.A., HEITMANN, J.A., ARGYROPOULOS, D.S., and ROJAS, O.J., “Dependency of Polyelectrolyte Complex Stoichiometry on the Order of Addition. 2. Aluminum Chloride and Poly-vinylsulfate,” Colloids Surf. A. 246(13): 71-79 (2004). 35. MAZUR, J., SILBERBERG, A., and KATCHALSKY, A., “Potentiometric Behavior of Polyampholytes,” J. Poly. Sci. 35(128): 43-70 (1959). 36. FÖRSTER, S., and SCHMIDT, M., “Polyelectrolytes in Solution,” in Advances in Polymer Sci. (Physical Properties of Polymers) 120: 51-133 (1995). 37. LIN, K.-F., and CHENG, H.-L., “A Simple Method to Estimate Chain Conformations of Polyelectrolytes in the Semidilute Regime,” Macromolecules 33: 4961-4965 (2000). 38. BRANDRUP, J., IMMERGUT, E. H., and GRULKE, E. A., Eds., Polymer Handbook, 4th Ed., John Wiley, New York (1999). 39. KUSAIBERGENOV, S. E., Polyampholytes: Synthesis, Characterization and Application, Kluwer Academic/Plenum Publ., New York (2002). 40. WANG, Y., HUBBE, M.A., SEZAKI, T., WANG, X., ROJAS, O.J., and ARGYROPOULOS, D.S., “The Role of Polyampholyte Charge Density on its Interactions with Cellulose,” Nordic Pulp Paper Res. J., submitted (2006). 41. CLAESSON, P.M., DEDINAITE, A., and ROJAS, O.J., “Polyelectrolytes as Adhesion Modifiers,” Advances in Colloid Interface Sci. 104: 53-74 (2003). 42. MANTILLA, J., SALAZAR, F., BULLÓN, J., and ROJAS, O. J., “Organic and Inorganic Polymers as Retention Aids in Papermaking. Iberoamerican Congress on Pulp and Paper Research 2004 (CIADICYP 2004), November 10-12, Cordoba, Spain, 2004. 43. MACHNITSCH, F. M., ROJAS, O. J., and NEUMAN, R.D., “Proceso de Floculación con PAC,” XIII ACOTEPAC International Pulp and Paper Congress, Cartagena (Colombia), October 30-November 1, 2002.
(21) FIGURE CAPTIONS Fig. 1. Tensile test resulting from treatment of a slurry (pH 5) of bleached hardwood kraft at the levels of PAC as shown following treatment with polymer samples (see Table 1) at the 1% level. Fig. 2A. Results of tests similar to those in Fig. 1, except that the final pH of the slurry, before sheet forming, was 4.0. Fig. 2B. Results of tests similar to those in Fig. 1, except that the final pH of the slurry, before sheet forming, was 8.5. Fig. 3A. Relative viscosity of 0.1% polymer solutions in water as a function of pH in the absence of added salt Fig. 3B. Relative viscosity of 0.1% polymer solutions in 0.01 M ionic strength solution as a function of pH. Fig. 4A. Effects of polyampholyte charge density and PAC addition on relative viscosities at pH=4 Fig. 4B. Effects of polyampholyte charge density and PAC addition on relative viscosities at pH=5. TABLE CAPTIONS Table 1. Synthesis of acrylamide-based polyampholytes (A-D) and simple copolymers (F-G). Table 2. Reactivity ratios of monomers employed..
(22)
Figure

+2
Related documents