for Managing Volumetric Surface
Movement Data in Virtual GIS
Mohd Shafry Mohd Rahim1, Abdul Rashid Mohamed Shariff2, Shattri Mansor2, Ahmad Rodzi Mahmud2, and Daut Daman1
1
Faculty of Computer Science and Information System, University Technology Malaysia, 81310 Skudai, Johor, Malaysia
2
Institute of Advance Technology, University Putra Malaysia, 43400 Serdang, Selangor, Malaysia
[email protected], [email protected]
[email protected], [email protected], [email protected]
Abstract. Virtual GIS have the capability to present geographic fea-tures in three-dimension. This will contribute to increasing user under-standing of phenomena that occurred in certain areas. Virtual GIS need to include temporal element in the system for managing dynamic phe-nomena to simulate real process. Spatiotemporal database system can be used to manage temporal data or spatial data that involve changes. In this paper, we present the database system of a spatiotemporal database prototype for managing volumetric surface movement; Volumetric Sur-face Movement Spatiotemporal Data Model that has the ability to store changes of the surface data of a three dimensional object. Formalization of the surface movement phenomena on the volumetric object were de-fined. This model has been implemented using relational database model which store only the changing points in order to ensure an efficient data management. We have developed a visualization tool with the database system to visualize movement on the surface. The prototype system of this model has been tested and found to be efficient.
Keywords:Spatiotemporal Data Model, Database, Surface Movement, Temporal GIS, Virtual GIS.
1
Introduction
Virtual Geographical Information Systems (VGIS) is generally defined as the use of computer graphic technology to improve the presentation of geograph-ical information. Therefore, Geographgeograph-ical Information Systems (GIS) will be able to become more realistic with real process and presentation precisely as in the real world. In many cases, simply introducing an additional orthogonal axis (Z) is convenient but undeniably insufficient. This is because important spa-tial and temporal characteristics and relationships may be imperceptible in this approach. Although visualization techniques for three or more dimensions have become popular in recent years, data models and formal languages have not yet
O. Gervasi and M. Gavrilova (Eds.): ICCSA 2007, LNCS 4707, Part III, pp. 128–139, 2007. c
fully developed to support advanced spatial and temporal analysis in multiple dimensions [1].
In Virtual Geographical Information Systems (VGIS), data model is the ab-straction of the real world phenomena according to a formalized, conceptual scheme, which is usually, implemented using the geographical primitives of points, lines, and polygons or discredited continuous fields [2]. Data model should define data types, relationships, operations, and rules in order to maintain data-base integrity [2]. In VGIS, data model is also used to enhance the focus on 3D data. Thus, spatiotemporal data model in VGIS is an abstraction of managing 3D spatial with temporal elements. Spatiotemporal data model is very impor-tant in creating a good database system for VGIS which deals with space and time as main factors in the system [3,15].
A variety of spatiotemporal data model were developed previously and for the purpose of this research, we have collected and analyzed 9 data models namely, GEN-STGIS [5], Cell Tuple-based Spatiotemporal Data Model [6], Cube Data Model [7], Activity-based Data Model [8], Object-based Data Model, Data Model for Zoning [9], Object Oriented Spatial Temporal Data Model [10], Multigranular Spatiotemporal Data Model [11] and Feature-Based Temporal Data Model [12]. We agree that in order to create a VGIS with a realistic process, an appealing spatiotemporal data model should focus on the volumetric data and geograph-ical movement behavior. Based on our analysis, an issue which is related to the capability of spatiotemporal data model is the 3D visualization of volu-metric spatiotemporal object. This capability is vital in order to increase user understanding in the geographic phenomena so to create simulations or future predictions. Thus, data model in VGIS must have the capability of user query to visualize information in the form of 3D with movements. This is indeed a very challenging issue. It has also been addressed by [13] that the current develop-ment of techniques and tools are simply unable to cope when expanded to handle additional dimensions. In this paper, we will discuss implementation of our pro-posed data model which is the Volumetric Surface Movement Spatiotemporal Data Model. This model was developed to manage movement of the volumetric object with less data redundancy, and also to retrieve data for visualization. Our discussion will focus on the system architecture in general which includes database development, data retrieval and visualization approach.
2
System Architecture
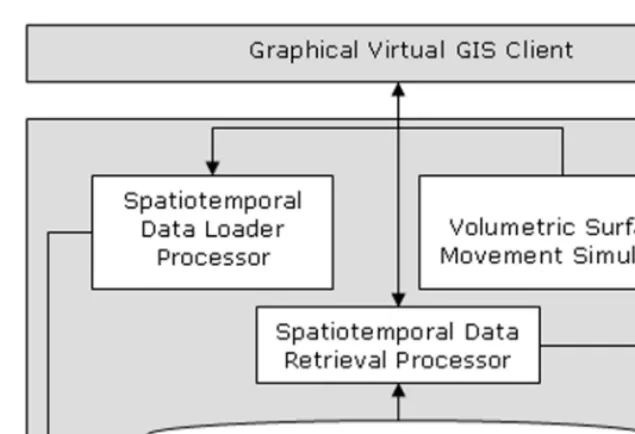
Figure 1 shows the architecture of our prototype system which consists ofData Storage, Spatiotemporal Data Loader Processor, Spatiotemporal Data Retrieval Processorand Volumetric Surface Movement Simulator.
Fig. 1.Architecture of the system
Spatiotemporal Data Retrieval Processorwill retrieve the data from the database based on what the user requires. In this case, the user need to input the area and duration of data. Data that were retrieved will be transferred into our own file for-mat.Volumetric Surface Movement Simulatorwill read the retrieved data set and simulates the volumetric surface movement object.Graphical Virtual GIS Client accepts users queries, and sends it to theSpatiotemporal Data Retrieval Processor, and illustrate the query result in graphical presentation.
3
Volumetric Surface Movements Spatiotemporal Data
Model
Based on the volumetric surface movement formalization by [4] we can see that conceptually the data that were used to define the surface of a volumetric object are actually the points with the value ofx, y,andz. This refers to the location and the coordinate of the points. Whenever there is a change on the surface, these points also change. Therefore time is the utmost important component in efficiently managing the points that forms the surface.
f(mv)t1, t2, ... , tm→ f(v, t1)∪f(v, t2)∪ ...∪f(v, tm) (1)
f(mv)t1, t2, ... , tm→ [{ <x1,y1,z1, t1>,<x2,y2,z2, t1>, ...<xn,yn,zn, t1>,} ∪ {<x1,y1,z1, t2>,<x2,y2,z2, t2>, ...<xn,yn,zn, t2>,}
∪...∪ {<x1,y1,z1, tm>,<x2,y2,z2, tm>, ...<xn,yn,zn, tm>,} ] (2)
In real process, not all of the points in the volumetric surface moves or changes. This raises the question as to whether it is necessary to store all of the points, which will increase the storage usage in the implementation. Therefore, in order to avoid data redundancy, the data model must be able to identify which point that has changed. To identify, data model must have the capability to check every point among version of data and capture the changing point. To perform this task, the formalism that was defined earlier will be used. The conceptual identification is as follows:
Assume Point1 is<x1, y1, z1>at time tn Point2 is Point1 at time tn+1
If Point2 - Point1 = 0 then Point2 = Point1at time tn+1 If Point2 - Point1 =0 then Point2 = Point2 at time tn+1
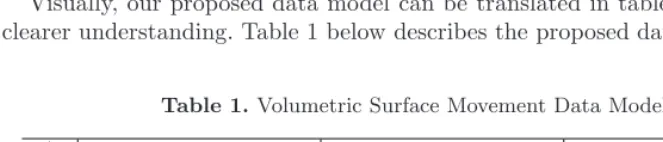
Visually, our proposed data model can be translated in table form to give a clearer understanding. Table 1 below describes the proposed data model.
Table 1.Volumetric Surface Movement Data Model
v/t P1 P2 P3
tn (x1,y1,z1) (x2,y2,z2) (x3,y3,z3) tn+1 (x1,y1,z1)||(x1,y1,z1)’ (x1,y1,z1)||(x1,y1,z1)’ (x1,y1,z1)||(x1,y1,z1)’
. . . .
. . . .
tn+m(x1,y1,z1)”||(x1,y1,z1)”’ (x1,y1,z1)”||(x1,y1,z1)”’ (x1,y1,z1)”||(x1,y1,z1)”’
Each point will go through changes but if there is a change that occurs at time t, not all of the points that form the surface changes. Therefore to store data at time t, a comparison will be done to determine which points actually changes. Thus, the process identification as stated in algorithm above is used. The process is as follows:
P1 (x1,y1,z1,tn) move→P1’ (x1,y1,z1,tn+1) move→...→P1’ (x1,y1,z1,tn+m) If (x1,y1,z1,tn+1) - (x1,y1,z1,tn) = 0
(x1,y1,z1,tn+1) = (x1,y1,z1,tn)
Else if ( (x1,y1,z1,tn+1) - (x1,y1,z1,tn)>0 ) || ((x1,y1,z1,tn+1) - (x1,y1,z1,tn) <0)
Therefore, the next point will be stored in the storage for every point after movement occurs
from tnuntil tn+1→ (x1,y1,z1) ||(x1,y1,z1)’
By executing this process, movement data can be stored more easily while avoiding data redundancy. Hence, changes on a volumetric surface were managed more efficiently.
4
Database System Development
In Volumetric Surface Movement Spatiotemporal Data Model or VSMST Data Model, surface on the volumetric object are represented on a 3D space together with the temporal element which represents the changes or movement. To specify their position in space, this data model uses Cartesian frame for reference. This frame is chosen based on the successful development of the database system in GEN-STGIS by [5]. More specifically, VSMST Data Model uses 3 dimensional Cartesian (x,y,z) coordinate system and it is based on the Euclidean geometry, which concerns the study of points, lines, polygons and other geometric figures that can be formed from it (i.e. polygons, polylines, and arcs) [5] in an Euclidean plane. The VSMST Data Model is based on the linear model of time, where time is represented as a discrete variable. This is based on the definition in the previous section which defines behavior of time that relates to the surface movement. In reality, events are recorded in a discrete manner, hence time can be represented in the data model. The relational approach has been used to design and implement the VSMST Data Model to ensure that it is flexible enough so that this model can be implemented in various database systems in the market. In this section, we will discuss the development of the database to manage and visualize surface movement data in a volumetric surface.
4.1 Database Development
Volumetric Surface object is created by the surface (s), polygon (p), line (l), and point(v). In representing spatiotemporal objects, time (t) is also involved to represent the period of changes and duration of changes. The changes on the surface comes from the points of the object that affects the lines that are joined together to build a triangle or polygon and surface.
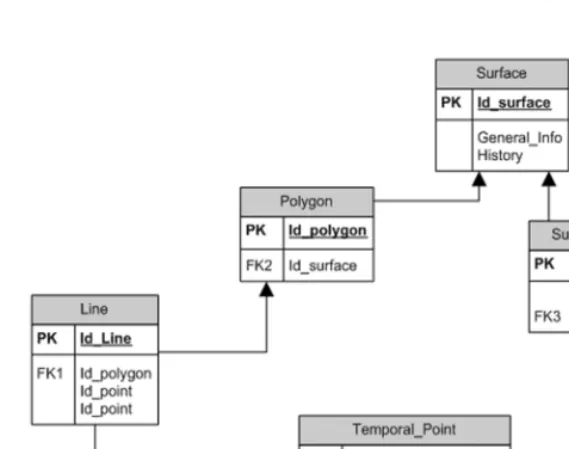
issue with point entity could be raised if time is included in the entity as an at-tribute. For this purpose, point entity were evolved into temporal point entity which contains point data with temporal element. In both entities we create an index as identification in the entity. Here, we produced suitable logical data model, represented in the Entity Relationship Diagram (ERD) in Fig. 2.
Fig. 2.Entity Relationship Diagram for VSMST Data Model
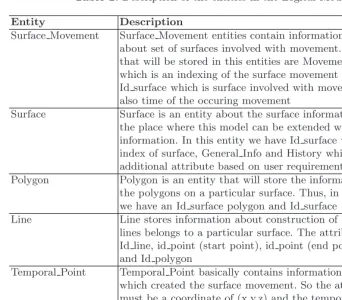
In the ERD for VSMST shown in Fig. 2, there are five entities that need to be created in the database to store and manage volumetric surface movement data. These are Surface Movement, Surface, Polygon, Line and Temporal Point. Every entity has relationships with related attribute. Table 2 shows the description of these entities. Table 3 shows the relationship of these entities with related entity.
4.2 Data Loading Process
Table 2.Description of the entities in the Logical Model
Entity Description
Surface Movement Surface Movement entities contain information
about set of surfaces involved with movement. Attribute that will be stored in this entities are Movement Index which is an indexing of the surface movement object, Id surface which is surface involved with movement and also time of the occuring movement
Surface Surface is an entity about the surface information. This is the place where this model can be extended with other information. In this entity we have Id surface which is index of surface, General Info and History which is an additional attribute based on user requirement
Polygon Polygon is an entity that will store the information about the polygons on a particular surface. Thus, in this entity we have an Id surface polygon and Id surface
Line Line stores information about construction of lines where the lines belongs to a particular surface. The attribute are are Id line, id point (start point), id point (end point) and Id polygon
Temporal Point Temporal Point basically contains information about data which created the surface movement. So the attribute must be a coordinate of (x,y,z) and the temporal component. Temporal element is the same as time involved in the surface movement, so that we just include the Movement Index as one of the entity. However, we have temporal point index to index the data which involved with the movement in the specific surface
Table 3.Description of Relationship in the ERD
Entity Relationship Entity
Surface Movement Has Surface
Polygon Member of Surface
Line Member of Polygon
Line Construct by Temporal Point Temporal Point Movement Surface Movement
be stored. This will avoid data redundancy of the points in the database. The algorithm to perform this operation is given below.
1. Read data from the data source based on time (t) 2. While not end of file
3. read <id vertex, x, y, z>
5. load the data
6. else if id vertex on the database
7. if <x, y, z>=<x, y, z>in database
8. does not involve with changes, do not store the point 9. else store <id vertex, x, y, z>with time (t)
10. end
4.3 Data Retrieval Process
Query process was designed to retrieve data from database by using area identi-fication. A surface entity in the database has a Id Surface with a start time and end time. Thus, results from this query will be a set of points which represents volumetric surface at the start time and end time. Below is the query algorithm that was used.
Data Retrieval Process:
1. Get input from user; Area of the surface (A), Start Time (Ts) and End Time (Te)
2. Select Surface required based on the A and Time in between Ts and Te 3. Select Point based on the coordinate of area A and Time in between
Ts and Te
4. Create surface based on the Time Start (Ts)
5. Calculate number of changes involved in the movement process 6. Identify list of vertex involved with changes based on time between
Ts and Te
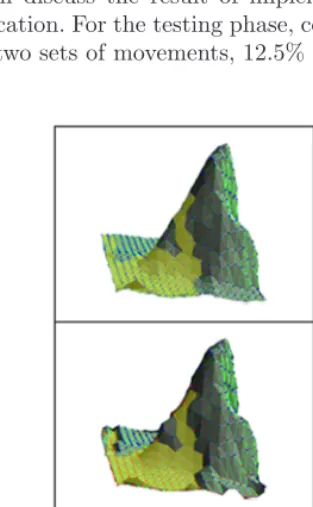
This data will then be transformed into a file format which will be used to visualize the volumetric surface movement interactively by navigation of time. The file format uses data which were constructed from the start time given by the user. Number of changes in the selected area will be stored effective from the reformed start time. Then data (set of points) will follow subsequent changes and continue until the end of changes. Every change will only contain a set of data which were involved during the changes.
5
Data Visualization
is paired with one vertex on targeted object. The interpolation part is solved by using parametric equation. The equation between two values used is:
Mv = Pti +{( Pu+1- Pti) * l}
Whereby l represents value that ranges from (ts) to (te) Mv represents the InBetween value
Ptirepresents point in start time Pu+1represents point in end time.
This formula needs to be applied to every parameter that will vary during the interpolation. For instance, in this simple application, 3 spatial dimensions system is used and those parameters would be x, y and z.
6
Results of Implementation
This section will discuss the result of implementation of the model with the prototype application. For the testing phase, conceptual data were used which is 16 points with two sets of movements, 12.5% percent of the data were involved
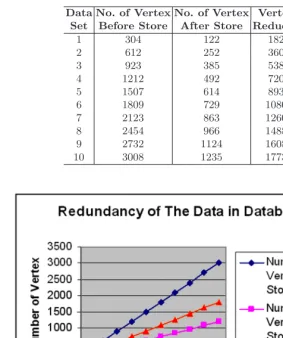
Table 4.Redundancy test before and after loading process
Data No. of Vertex No. of Vertex Vertex Set Before Store After Store Reduced
1 304 122 182
2 612 252 360
3 923 385 538
4 1212 492 720
5 1507 614 893
6 1809 729 1080
7 2123 863 1260
8 2454 966 1488
9 2732 1124 1608
10 3008 1235 1773
Fig. 4.Graph of the Data Redundancy before and after loading data into database
with movement. Before loading, there are 48 points in which only 20 remain after loading process. So, we were able to reduce the data by 58.3% by avoiding data redundancy. Figure 3 shows the simulation of data from the start time (ts) to end time (ts).
7
Conclusion and Future Works
According to [14], a successful VGIS query process should be able to support different user preferences in spatiotemporal scene queries, and do not have a fixed-metric approach where all users are considered equal. This requires a spa-tiotemporal database that can integrate series of data. The Volumetric Surface Movement Spatiotemporal Data Model can be an ideal solution to solve this kind of issue. We have developed a prototype having the ability to reflect surface changes of a volumetric object. We have also included the ability to efficiently compress data not involved in the change. This model has shown to be able to reduce data redundancy by 60%.
As a conclusion, our major contribution in this paper is the implementation of the Volumetric Surface Movement Spatiotemporal Data Model by using the relational database model in a prototype version. The proposed data model can be considered in the development of the related application. In the visualization tool we have used a data format which were generated from the Spatiotem-poral Data Retrieval Processor to load into the Volumetric Surface Movement Simulator. This aids the use in visualizing the result.
Acknowledgments. This research has been sponsored by the Ministry of Sci-ence, Technology and Innovation (MOSTI), Malaysia. Research has been man-aged by Research Management Centre, University Technology Malaysia under research grant 79102. Special thanks to the Institute of Advanced Technology for the advice and guidance given during research.
References
1. Yuan, M., Mark, D.M., Egenhofer, M.J., Peuquet, D.J.: Extensions to Geographic Representations. In: McMaster, R.B., Usery, E.L. (eds.) A Research Agenda for Geographic Information Science, Boca Raton, Florida, ch. 5, pp. 129–156. CRC Press, Boca Raton (2004)
2. Nadi, S., Delavar, M.R.: Spatio-Temporal Modeling of Dynamic Phenomena in GIS. In: Proceeding of ScanGIS 2003, pp. 215–225 (2003)
3. Rahim, M.S.M, Shariff, A.R.M, Mansor, S., Mahmud, A.R.: A Review on Spa-tiotemporal Data Model for Managing Data Movement in Geographical Informa-tion Systems (GIS). Journal of InformaInforma-tion Technology, FSKSM, UTM 1(9), 21–32 (2005)
4. Rahim, M.S.M, Shariff, A.R.M, Mansor, S., Mahmud, A.R.: Volumetric Spatiotem-poral Data Model, Lecture Note in Geoinformation and Cartography, pp. 547–556. Springer, Heidelberg
5. Narciso, F.E.: A Spatiotemporal Data Model for Incorporating Time in Geographi-cal Information Systems (GEN-STGIS), Doctor of Philosophy in Computer Science and Engineering, University of South Florida (April 1999)
7. Moris, K., Hill, D., Moore, A.: Mapping The Environment Through Three-Dimensional Space and Time, Pergamon, Computers. Environment and Urban Systems 24, 435–450 (2000)
8. Donggen, W., Tao, C.: A Spatio-temporal Data Model for ActivityBased Transport Demand Modeling. International Journal of Geographical Information Science 15, 561–585 (2001)
9. Philip, J.U.: A Spatiotemporal Data Model for Zoning, Masters of Science Thesis, Department of Geography, Brigham Young University (2001)
10. Bonan, L.,Guoray, C.: A General Object-Oriented Spatial Temporal Data Model, Symposium on Geospatial Theory, Processing and Applications, Ottawa (March 2002)
11. Elena, C., Michela, B., Elisa, B., Giovanna, G.: A Multigranular Spatiotemporal Data Model. In: GIS’03, New Orleans, Louisiana, USA, November 7-8, 2003, pp. 94–101 (2003)
12. Yanfen, L.: A Feature-Based Temporal Representation and Its Implementation with Object-Relational Schema for Base Geographic Data in Object-Based Form, UCGIS Assembly (2004)
13. Roddick, J.F., Egenhofer, M.J, Hoel, E., Papadias, D.: Spatial, Temporal, and Spatiotemporal Databases. In: SIGMOD Record Web, vol. 33(2) (2004)