JULY 2008
This publication was produced for review by the United States Agency for International
microREPORT #109
A VALUE CHAIN ANALYSIS
ATAULFO MANGO IN
CHIAPAS
ATAULFO MANAGO IN
CHIAPAS
A VALUE CHAIN ANALYSIS
Patrick Hanemann, Farm2 Market Agribusiness Consulting, Inc. Nathanael Bourns, AFIRMA /DAI
Ivana Fertziger, AFIRMA/DAI
The authors’ views expressed in this publication do not necessarily reflect the views of the United States Agency for International Development or the United States Government.
CONTENTS
EXECUTIVE SUMMARY ... IX
INTRODUCTION ... 1
BACKGROUND ... 1
APPROACH AND ORGANIZATION OF THE STUDY ... 1
MANGO CONTEXT AND TRENDS ... 3
WORLD OVERVIEW ... 3
U.S.MANGO MARKET ... 8
U.S.MANGO MARKET ... 8
MANGO PRODUCTION IN MEXICO ... 11
IMPORTANCE OF THE ATAULFO MANGO CHAIN IN CHIAPAS ... 11
VALUE CHAIN DESCRIPTION FOR ATAULFO MANGOES IN CHIAPAS... 13
INPUTS AND NON-FINANCIAL SERVICES ... 15
PRODUCTION ... 15
PACKING ... 20
PROCESSING ... 21
COMMERCIALIZATION ... 21
VALUE DISTRIBUTION ESTIMATES:4CASES ... 25
FORMAL FINANCIAL SERVICES ... 25
SECTORAL ASSESSMENT – ATAULFO MANGOES IN CHIAPAS... 29 STRENGTHS ... 29 WEAKNESSES ... 34 UPGRADING OPPORTUNITIES ... 39 PRODUCTION ... 39 COMMERCIALIZATION ... 40 FINANCE ... 41 POLICY ... 43
TABLES AND FIGURES
TABLE
1 Wholesale Prices of Fresh Mango, Major EU Markets during
5-Year Period of Aggregate Price Declines (1997–2001) ... 5
2 Mango Producers in the Region by Size ... 15
3 Mango Packing Plants in the Soconusco ... 20
4 US Prices, Mexican Mango Imports, by Variety (2002–2007) ... 31
5 Price of Mango Pulp and Juice in European Union (December 2007) ... 40
6 Summary of Upgrading Opportunities and Sector Actions .... 45
FIGURE
1 Worldwide Mango Production (1997–2006) ... 32 Worldwide Mango Exports (1996–2005) ... 3
3 Mango Exports: 10-year Annual Growth Rates (1966–2005) .. 4
4 World Unit Mango Selling Prices (USD/Kg) & Annualized Rates of Increase (1966–2004) ... 5
5 US Mango Imports (MT) and Unit Values (USD/Kg) ... 6
6 Principal Mango Exporting Countries (2005) ... 7
7 Principal Mango Importing Countries (2005) ... 8
8 US Mango Imports by Country (5kg cartons) (1993–2007) ... 9
9 Mexican Mango Exports to the US by Variety, by State / Region (2007) ... 10
10 Mango Exports by Month (2005–2007) ... 10
11 Seasonality of Mexican Mango ... 11
12 Chiapas Ataulfo Mango Value Chain ... 13
13 Formal and Informal Financial Flows in the Chiapas Ataulfo Mango Value Chain ... 14
14 Scenario 1—INIFAP Recommended Inputs, Export &
Domestic Commercialization ... 17 15 Scenario 2—Selective Inputs, Domestic Commercialization,
Local Intermediary ... 18 16 Scenario 3—Certified Organic Production, 70% Organic
Export Channel ... 19 17 Distribution of Commercialization Value, 3 Illustrative
Cases ... 25 18 Example of a FIRA-backed Bank Lending to Growers
through Packing Houses ... 27 19 Ataulfo Exports to the US by State and Fruit Size (2007) ... 30 20 Key Benefits and Drawbacks of Trade Finance Among
Packers And Growers ... 33 21 One Possible Scheme for Using Value Chain Information
EXECUTIVE SUMMARY
This report examines the Ataulfo mango value chain in Chiapas, scanning across the chain and its various actors and market linkages to put observed dynamics in context and identify opportunities. The report pays particular attention to financial flows through the chain which inform other non-financial dynamics and highlight conditions and opportunities where financial services might help address challenges or allow for upgrading. The authors address financial issues within the broader analysis, rather than as a separate issue, or as an input at one level of the chain.
Global mango consumption has grown steadily in recent years, both in producing and importing countries. Mexico has been one of the main producers and consumers of mango, and a leading exporter worldwide. Within an increasingly commoditized environment, the gold-colored Ataulfo mango from Chiapas (unlike the more common red or Florida varieties) has sustained a differentiated identity and a price premium in both domestic and export markets. Although Chiapas occupies a relatively minor place in overall Mexican mango production and exports, it leads both in production and exports of the Ataulfo variety and, as a whole, is well positioned to take advantage of changing market dynamics, such as the growth of supermarket chains in Mexico, as well as a growing market for Ataulfo mangoes abroad. The largest integrated grower/packers are clearly best positioned for these trends.
The Chiapas Ataulfo chain has important strengths upon which to build. The variety enjoys a high degree of market demand accompanied by higher prices, especially in the organic niche which enjoys a 30% premium above conventional Ataulfos. The Ataulfo was first discovered in and is most identified with the Soconusco region in Chiapas, around Tapachula and the Guatemalan border. The region is among the first areas to begin production each cycle precisely when the southern hemisphere competitors are winding down but before other regions in Mexico begin to harvest, permitting fruit to enter the market while stocks are low. The Soconusco also meets phytosanitary requirements for accessing US markets (the world’s largest mango importer), although this requires constant effort and coordination across the sector and cannot be taken for granted. Other strengths include public sector support in the form of programs for supporting credit, irrigation, and organic conversion, among others.
Despite this privileged position, the chain faces a series of challenges. First and foremost is declining productivity, for which basic scientific research is necessary. While any of a range of factors may cause productivity declines under a given set of circumstances, the necessary scientific studies have not yet been conducted and disseminated to improve yields. One result of this uncertainty is a reduced propensity among chain actors, especially producers, to invest in upgrading.
Other challenges also revolve around the need for easy access to better, more timely information. The chain would benefit from improved market information, including regular pre- and post-harvest production estimates and data, regular tracking of flows of fruit from orchards to packing plants to markets, and regular tracking of prices in the main domestic and international markets. Such information would support decision-making based on factual market appraisals, rather than hearsay. The chain also needs an updated set of agricultural practices for the Ataulfo variety in the Soconusco and, in light of growing demand, a new set of agricultural practices for organic Ataulfo.
Once some of these basic needs are met, appetite for investment is likely to increase and the current lack of formal financial services may amount to a major constraint. Conventional credit relationships with private commercial banks are no more common for Soconusco Ataulfo growers or packers than for other agricultural activities in Mexico. The most common variation of formal financial services observed involved government-backed and subsidized (FIRA) lending from commercial banks that tend to concentrate on the largest companies, particularly packing houses which may in some cases on-lend to certain producers. In such cases, financial institutions take very little risk, use none of their own capital, and obtain operational subsidies. A bank’s ability to measure and manage agricultural and business risks and costs is therefore considerably less relevant that its ability to understand and manage the subsidy scheme.
Trade credit, which was found to flow both from suppliers to buyers and vice-versa at different points in the season, has important benefits, including the simple fact that it often exists as an option where services from financial institutions do not. But it also has drawbacks in terms of limiting choices, or sub-optimizing commercialization and other decisions throughout the chain. Liquidity, or lack thereof, often determines the channel into which Ataulfos from the Soconusco are sold. While this is common for capital-constrained producers who access the quick payment terms (but lower prices) of local intermediaries, it was also observed among packers that sometimes base channel strategies more on whether or not they require extending credit to their producers, than whether they are optimal channels, preferring to remain in channels where they don’t need to use their scarce capital to finance the producers, regardless of the market opportunities in that channel. In this sense, understanding trade credit and the flow of information through the chain offered insights into the nature of commercial relationships through the chain, as well as the potential for mutually beneficial improvements.
Upgrading opportunities in the categories of production, commercialization, finance, and policy include:
Production
• Research root causes of productivity declines and mitigation approaches. Based on findings develop and disseminate a set of recommended Ataulfo agricultural practices.
• Develop organic-specific recommended agricultural practices for Ataulfo in Chiapas for producers interested in doing so to obtain benefits of excellent market opportunities for organics.
• Develop certification process for Ataulfo nurseries to mitigate a source of reduced productivity.
• Examine the potential for enhanced irrigation techniques, especially lower cost approaches, in terms of their contribution to productivity, quality, and returns to growers.
• Given the environmental importance of the Soconusco region, work with environmental specialists to evaluate production and identify strategies to address biodiversity threats.
Commercialization
• Given its attractive characteristics for juice and pulp and the lack of such channels in the Soconusco, support chain actors to examine business cases for different investment scenarios.
• Improve information and transparency along the chain, starting with the field-level data and following product flows to market, in terms of pricing, inventories, and competitive conditions.
ATAULFO MANGO IN CHIAPAS xi Finance
• Assist financial institutions to serve this potentially attractive niche, by helping them understand chain dynamics including costs, returns, and risk, in order to design appropriate financial services. Designs should build on lessons learned in value chain finance (e.g. structuring repayment schemes through buyers) and in microfinance (e.g. including household cash flows in credit analyses).
• Help research the feasibility of long-term finance for investment and upgrading for multiple actors in the chain, including growers, packing houses, cooperatives and growers’ associations.
• Assist interested financial institutions to obtain and leverage rich information that packing plants and others have on producers that could support financial decisions.
Public Policy
• Enhance collaboration across public and private sector actors to improve the design and
implementation of public policies and programs, especially in the areas of agricultural extension, finance, irrigation, environmental standards, and phytosanitary compliance.
• Work with stakeholders including government, the phytosanitary board and the producers’ association to ensure coordination across the chain on phytosanitary compliance continues to improve, ensuring continued access to US and other export markets.
INTRODUCTION
BACKGROUND
One goal of the USAID-funded AFIRMA Project is to support upgrading of agricultural value chains in Mexico through, among other means, improved financial services to value chain actors. As part of this goal AFIRMA analyzes potentially competitive agricultural value chains, including chain dynamics and access to financial and other services, and options for upgrading and enhancing competitiveness.
To select value chains to analyze, AFIRMA conducted a quick review of agricultural activities in Mexico and their potential competitiveness, using data bases from the Mexican Secretary of Agriculture
(SAGARPA) and the Food and Agriculture Organization (FAO) as initial filters to obtain a shortlist of chains for further consideration. The team applied four main categories of criteria:
• Current and potential competitiveness of Mexican products in the activity/crop, analyzing global and national trends of supply and demand, and locating Mexico within this context.
• Chain organization and leadership, estimating whether the level of organization within might present opportunities to improve conditions among chain actors, especially producers.
• Social relevance, using secondary sources to estimate the number of participants, to focus analysis on chains with large numbers of small-scale producers (the assumption being that in Mexico size of holding correlates to wealth).
• Relevance for Biodiversity – as an additional cross-cutting theme, AFIRMA seeks to work in activities and areas that have potential to address specific threats to Mexico’s biodiversity.
By applying these categories of criteria, the team identified Ataulfo Mango along the coast of Chiapas in southeastern Mexico as a promising chain for analysis.
APPROACH AND ORGANIZATION OF THE STUDY
This report analyzes the Ataulfo Mango value chain to identify chain upgrading opportunities that would improve livelihoods of chain participants. The study looks across the entire value chain to put dynamics in context and identify opportunities for improvement. In this sense it is similar to value chain studies in other areas. One emphasis of this study, however, is that it takes a holistic view of the current and
potential role of finance, offering analysis of financial flows through chain—formal and informal, current and potential—to highlight conditions and opportunities where financial services might help address challenges or take advantage of opportunities.
In addition to a review of secondary sources, the report is based on interviews with a wide range of actors in the mango business in Chiapas, Nayarit, and Mexico City in spring 2008. The authors hope this report is useful to: stakeholders and decision-makers within the chain and in the public arena; researchers interested in the topic who wish to build on lessons learned or further analyze issues presented here; and financial institutions motivated to understand opportunities and risks in serving the Ataulfo mango chain.
2 ATAULFO MANGO IN CHIAPAS
Following the executive summary and this introduction, the report comprises four main sections. Below is an overview of the context and national and global trends related to mango production and consumption. The following section offers a basic mapping of the Ataulfo mango value chain including trends specific to the Mexican market and findings related to organic mango production and Ataulfo mango. The next section analyzes the chain’s key strengths and weaknesses and the final section offers conclusions and recommendations on upgrading opportunities and actions to be taken.
MANGO CONTEXT AND
TRENDS
FIGURE 1: WORLDWIDE MANGO
WORLD OVERVIEW
Rest of the World
India China Pakistan Mexico Thailand IndonesiaBrazil 0 5,000,000 10,000,000 15,000,000 20,000,000 25,000,000 30,000,000 35,000,000 1997 1998 1999 2000 2001 2002 2003 2004 2005 2006 M e tr ic Tonn e s
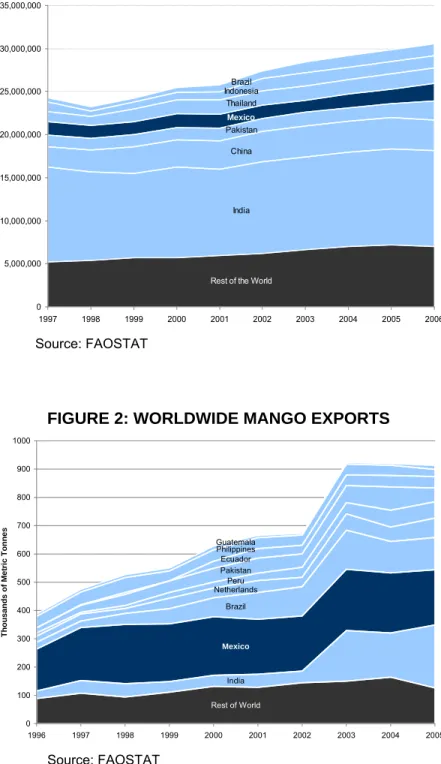
World mango production1 in 2006 stood at just over 30 million metric tons. Figure 1 shows Principal origins contributing to this production and the overall growth trend in mango
production. India remains the dominant world producer, with 36% of global production, followed at a considerable distance by China, with only 12%. The next eight volume leaders combined amount to roughly India’s annual production.
The vast majority of the world’s mangoes are consumed in the country where they are grown. In 2005, only 912,000 metric tons entered global trade channels, representing just 3% of global mango production for that year. Of the 11.1 million metric tons grown in India, for example, 98% of the crop is consumed within its domestic market, although India has increased its
participation in the world export market and in 2005 overtook Mexico as the world’s largest mango exporter in terms of volume. Still, the ranking among world export leaders is distinct from that of production, with greater presence among western hemisphere exporters, as shown in Figure 2.
Source: FAOSTAT
FIGURE 2: WORLDWIDE MANGO EXPORTS
Rest of World India Mexico Brazil NetherlandsPeru Pakistan Ecuador Philippines Guatemala 0 100 200 300 400 500 600 700 800 900 1000 1996 1997 1998 1999 2000 2001 2002 2003 2004 2005 Th ou sand s o f M e tr ic To nn es
Over the past 40 years, the rate of growth in export volumes has been remarkable. From 1966-2005, world mango exports have grown from 7,200 MT to 912,000
Source: FAOSTAT
MT, an annualized growth rate over this 40-year period of 13%. Growth in gross export values has also been impressive. Export revenues over the same period rose from just over US$1 million in 1966, to US$543 million in 2005, a compound annual growth rate of 17%.
FIGURE 3: MANGO EXPORTS: 10-YEAR ANNUAL GROWTH RATES (1966–2005) 0% 5% 10% 15% 20% 25% 1966-1975 1976-1985 1986-1995 1996-2005 C o m pound Annual Gr ow ht R a te Export Volume Export Value
Concealed behind these positive growth numbers, however, are some negative trends over the past ten years that have stripped much of the fun and profit from the export mango business. Figure 3 shows the volume growth trends over the 40-year period from 1966-2005, decade by decade, along side the gross value increases in the global mango trade over the same period.
The decade from 1966-1975 saw compound annual growth of 13% in volume, and of 22% in revenues, leading to an aggregate 9% annual increase in unit revenues received. While volume growth during the decade from 1976-1985 continued to accelerate, reaching 15% per annum, gross value and unit revenue growth slowed to 20% and 5%, respectively. This trend continued through to the current period, with rates of growth in values coming more into line with rates of growth in volumes.
Figure 4 displays the trends in unit selling prices (showing annualized rates over 4 decade-long periods) that have accompanied this growth in the worldwide mango trade. This downward trend in selling prices dates back to 1997 when, after a six-year period when prices per kilo peaked in the $0.86-$0.91 (USD/kg) range, prices per kilo fell off dramatically, settling into the $0.60-$0.65/kg range in recent years.
FIGURE 4: WORLD UNIT MANGO SELLING PRICES (USD/KG) & ANNUALIZED RATES OF INCREASE (1966–2004)
This phenomenon of declining unit prices appears to have affected all major western markets, as can be seen in Table 1. In France, Germany and Great Britain, prices have fallen steadily from 1997 through 2001 (2000 in the case of France).
Source: FAO-Tropical Fruit Statistics, 2003
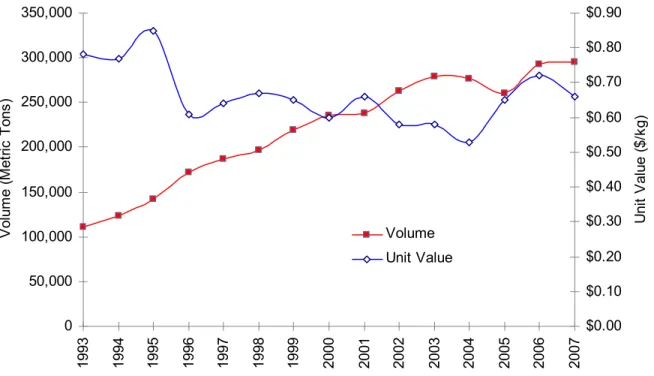
The United States market has been no exception to this trend. As shown in Figure 5 below, the past 15 years have seen US fresh mango imports grow at an annualized rate of 7%, while average unit values have declined at an average rate of 1% per annum. While prices recently have improved somewhat from their low point of $0.53/kg in 2004, they remain well below the peak price of $0.85/kg in 1995.
TABLE 1: WHOLESALE PRICES OF FRESH MANGO, MAJOR EU MARKETS DURING 5-YEAR PERIOD OF AGGREGATE PRICE DECLINES (1997–2001)
1997 1998 1999 2000 2001 5-year % change France (FF/Kg) 11.21 12.04 11.5 10.83 11.03 -0.3% Germany (DM/Kg) 3.22 2.42 2.85 3.3 3.06 -1.0% U.K. (£/Kg) 1.16 1.15 0.96 0.95 0.93 -4.3% $0.00 $0.10 $0.20 $0.30 $0.40 $0.50 $0.60 $0.70 $0.80 $0.90 $1.00 19 6 6 19 6 8 19 7 0 19 7 2 19 7 4 19 7 6 19 7 8 19 8 0 19 8 2 19 8 4 19 8 6 19 8 8 19 9 0 19 9 2 19 9 4 19 9 6 19 9 8 20 0 0 20 0 2 20 0 4 Ma ngo P rice USD/Kg +8% +8% +5% -3% Source: FAOSTAT
As global export volumes have expanded, the market for mangoes has progressively moved beyond its ethnic roots into the mainstream consumer markets. In the process, it has come to be seen as less of an exotic specialty item, and more of an everyday commodity. This commoditization of the fresh mango market has led it to lose the protection it enjoyed in its period as an ethnic commodity, supported by core consumers whose demand was highly inelastic. Instead, it is now fully subject to the same challenges of product loyalty and price competition as any other everyday commodity in the produce arena. Within this context, as with other commodities, success is largely dependent upon large scale, meeting minimum standards, low cost of operation, and product differentiation.
FIGURE 5: US MANGO IMPORTS (MT) AND UNIT VALUES (USD/KG)
0 50,000 100,000 150,000 200,000 250,000 300,000 350,000 199 3 199 4 199 5 199 6 199 7 199 8 199 9 200 0 200 1 200 2 200 3 200 4 200 5 200 6 200 7 V ol um e ( M et ric T ons ) $0.00 $0.10 $0.20 $0.30 $0.40 $0.50 $0.60 $0.70 $0.80 $0.90 U nit V alu e ( $/ kg ) Volume Unit Value
Source: USDA, Foreign Agricultural Service
ell as Indian varieties (Alfonso and Banganapalli, among others) into the United Kingdom, still trade in limited volumes to an audience of ethnic “connoisseurs” who are prepared to recognize a
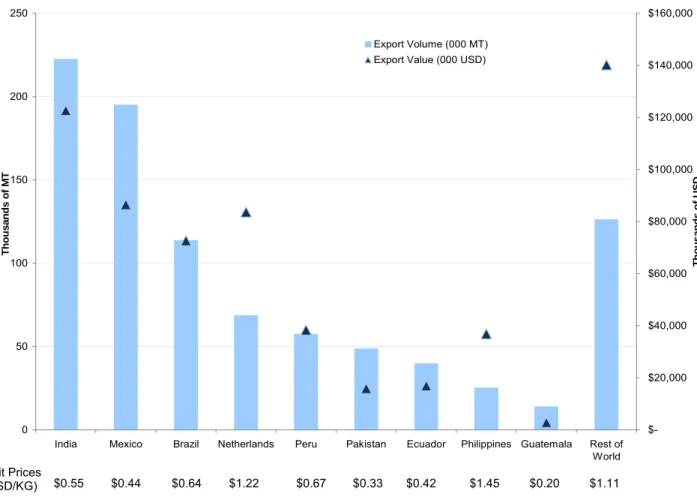
ajority es on, as shown in Figure 6, favors the four main Latin
Within this commoditized environment, there are still variety/origin combinations which have been able to sustain a differentiated identity. The Ataulfo from Chiapas and the Francique from Haiti into the United States market, the Carabao from the Philippines into Japan, the Chaunsa from Pakistan, as w several of the
premium value for a premium organoleptic experience.
This type of intra-sectoral product differentiation does not appear to operate with respect to the ‘mass-market’ Florida mango varieties, such as the Tommy Atkins, Haden, Kent and Keitt varieties, which dominate the markets of the Western Hemisphere. It is these latter varieties which constitute the m of exports from Mexico, Brazil, Peru, Ecuador and South Africa, as well as from the exporting countri of West Africa. The scale of export producti
American exporters (Mexico, Brazil, Peru and Ecuador), which together accounted for 45% of world mango exports in 2005 in terms of volume.
the start or accelerate the end of a given country’s seasons. hile these events can create sharp run-ups in spot prices, they are not predictable, nor do they form the asis for a sustainable market strategy.
FIGURE 6: PRINCIPAL MANGO EXPORTING COUNTRIES (2005)
Source: FAOSTAT. Note: data for Philippines for volume and value s for 2004 (2005 unavailable)
Mexico ships from February through August. Brazil operates from September through November. Peru and Ecuador export from November through February, before handing the baton back to Mexico. Even with the overlapping supply calendars of the Latin American origins, there are occasional openings in Europe and North America when events delay
W b 0 50 100 150 200 250
India Mexico Brazil Netherlands Peru Pakistan Ecuador Philippines Guatemala Rest of World T hou sa n d s of M T $-$20,000 $40,000 $60,000 $80,000 $100,000 $120,000 $140,000 $160,000 Th ou s a nd s o f US D Export Volume (000 MT) Export Value (000 USD)
1.11 Unit
U.S. MANGO MARKET
US mango imports are examined in some depth here because, apart from the fact that there is reliable data available (not the case for the domestic market), Mexico is its main supplier and because exports
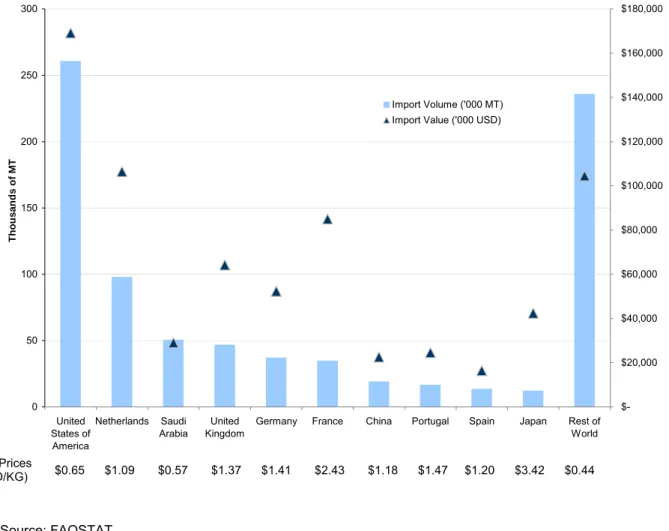
generally represent the highest value attainable to producers from Chiapas. It is worth noting, however, that in interviews, some small producers indicated that they were getting better prices in 2008 selling into the national market. As shown in Error! Not a valid bookmark self-reference., the United States is, by a healthy margin, the major importer of fresh mangoes in the world. In 2003, it accounted for 34% of global import volumes and 27% of global import values.
FIGURE 7: PRINCIPAL MANGO IMPORTING COUNTRIES (2005)
Source: FAOSTAT.
U.S. MANGO MARKET
US mango imports are examined in some depth here because, apart from the fact that there is reliable data available (not the case for the domestic market), Mexico is its main supplier and because exports
generally represent the highest value attainable to producers from Chiapas. It is worth noting, however, that in interviews, some small producers indicated that they were getting better prices in 2008 selling into the national market. As shown in U.S. Mango Market
0 50 United States of America Netherlands Saudi Arabia United Kingdom
Germany France China Portugal Spain Japan Rest of World $-$20,000 100 150 200 250 300 T hou s a nd s o f M T $40,000 $60,000 $80,000 $100,000 $120,000 $140,000 $160,000 $180,000 Th ousands of USD Import Volume ('000 MT) Import Value ('000 USD)
Unit Prices
(USD/KG) $0.65 $1.09 $0.57 $1.37 $1.41 $2.43 $1.18 $1.47 $1.20 $3.42 $0.44
US mango imports are examined in some depth here because, apart from the fact that there is reliable data available (not the case for the domestic market), Mexico is its main supplier and because exports
generally represent the highest value attainable to producers from Chiapas. It is worth noting, however, that in interviews, some small producers indicated that they were getting better prices in 2008 selling into the national market. As shown in Error! Not a valid bookmark self-reference., the United States is, by a healthy margin, the major importer of fresh mangoes in the world. In 2003, it accounted for 34% of global import volumes and 27% of global import values.
Figure 7, the United States is, by a healthy margin, the major importer of fresh mangoes in the world. In 2003, it accounted for 34% of global import volumes and 27% of global import values.
FIGURE 8: US MANGO IMPORTS BY COUNTRY (5KG CARTONS) (1993–2007)
0 200,000 400,000 600,000 800,000 1,000,000 1,200,000 1,400,000 1,600,000 1993-1997 1998-2002 2003-2007 Rest of World Costa Rica Nicaragua Haiti Guatemala Ecuador Brazil Peru Mexico Source: USDA/FAS.
Over the past 15 years, US mango import volumes have grown at an annualized rate of 7.3%, while import values have increased at a rate of 6.1% per annum. The dominant source for mango imports into the United States is Mexico, which accounts for more than 60% of all mangos consumed in the United States. Although Mexican volumes over the past fifteen years have nearly doubled (from 94,000 MT in 1993 to 184,000 MT in 2007), its share of the US mango market has actually declined (Figure 8) over the same period from 85% in 1993 to 62% in 2007, with similar trends on an import value basis.
This decline in market share derives less from any failings on the part of the Mexican mango industry, than from the dramatic growth of counter-seasonal Southern Hemisphere origins (Brazil, Ecuador and
FIGURE 9: MANGO EXPORTS BY MONTH (2005–2007)
Peru) in response to year-round demand from consumers and supermarkets in the USA. While these three countries claimed only a 5% share of the US market on an aggregate volume of 6,000 MT in 1993, their share had risen by 2007 to 29%, on an aggregate volume of 85,000 MT.
Even with this onslaught from the Southern Hemisphere origins, Mexico still supplies the US market with over 60% of its fresh mangoes, dominating the market from March through September (Figure 9). The
varietal distribution, divided by Mexican state of origin, appears in Figure 9. The leading variety is the Tommy Atkins (33% of all shipments), followed by Ataulfo (25%) and Kent (21%), with Keitts, Hadens and Manilas combining to make up the remaining 21% (with Manilas consumed primarily in domestic markets). In terms of states of origin, the two districts of the state of Sinaloa contribute 42% of all exports to the United States, with Michoacán a distant second place at 26%. Six other states (including Chiapas at 7% overall, but leading in Ataulfo exports) combine to make up the remaining 32%.
0 2,000,000 4,000,000 6,000,000 8,000,000 10,000,000
February March April May June July August September October
V olume ( '000 5 kg c art ons ) 12,000,000 2005 2006 2007 Source: EMEX (‘000 ctns, 5-kg)
FIGURE 10: MEXICAN MANGO EXPORTS TO THE US BY VARIETY, BY STATE / REGION (2007) 0 2,000,000 4,000,000 6,000,000 8,000,000 10,000,000 12,000,000 14,000,000
Sinaloa Michoacan Nayarit Norte, Chiapas Oaxaca Jalisco Campeche Guerrero
Vol u m e, ' 000 5-kg c a rt ons Sinaloa Tommy Manila Kent Keitt Haden Ataulfo
MANGO PRODUCTION IN MEXICO
ts est point
estic
ed in countries such as Japan, and the U.S.
heastern state of Chiapas in
ion Further analysis is recommended in Section 6 to understand current and potential impacts on biodiversity.
The national mango chain, for all varieties, involves an estimated 40,000 producers, generating an estimated 90,000 jobs directly and about 300,000 indirectly.2 The main mango producing areas are located on the Pacific regions (Figure 11) and production moves up the coast during the course of the season, which extends from January to September, reaching i highest point during the months of June and July. Prices often hit their high at the beginning of the year, benefiting producers in the states of Chiapas, Campeche, Guerrero and Oaxaca. From May to July, high production levels
FIGURE 11: SEASONALITY OF MEXICAN MANGO
January-February
February-March
March-April
April-May
decrease prices.
Manila is the most produced variety in Mexico, and its main target is the dom market since its shelf life is short, its handling is delicate and unlike the Ataulfo, it does not stand up to hot water treatment requir
Source: Leading Program for Mango Production System, Rural Development Ministry (SDR), SAGARPA, Chiapas. 2004.
IMPORTANCE OF THE ATAULFO MANGO CHAIN IN CHIAPAS
Mango production is the sixth most important agricultural activity in the sout terms of cultivated surface, after corn, beans, coffee, sugar cane and cocoa.
Ataulfo production in Chiapas is concentrated (but not exclusive to) in the Soconusco coastal region in the southeastern part of the state. Although there are no recent verifiable production statistics covering Ataulfo production in Chiapas, producer organizations in the region indicate there are 18,000 hectares of Ataulfo mangoes in production in the state, yielding an average annual production in the neighborhood of 100,000 MT. With an estimated 5,800 growers engaged in Ataulfo production in Chiapas, this leads to an average production area of some 4.5 hectares per grower, within a range of less than 1 Ha to 1,500 Ha. Environmental analyses indicate that the Soconusco region is important for biodiversity, in particular for the biodiversity that its costal system of mangroves supports. The Ataulfo is a native species to the reg and, as a perennial tree crop, can be, although not always is, cultivated at low environmental impact.
2 Secretaría de Desarrollo Rural (SDR) “Plan Rector del Sistema-Producto Mango.” Fomento económico de Chiapas, A. C.
VALUE CHAIN DESCRIPTION
FOR ATAULFO MANGOES IN
CHIAPAS
Figure 12 below illustrates the value chain dynamics observed in the field analysis, which are described in this section. The first chart shows product flows throughout the chain, as well as subsidy flows in green. Thicker arrows indicate higher volume flows through specific channels.
FIGURE 12: CHIAPAS ATAULFO MANGO VALUE CHAIN
Small Producer (~5500) Packer Local Broker Exporter / Broker Foreign Consumer ~20,000 tons Wholesaler / Central Market Distributor National Supermarkets Independent Grocer / local marketplace National Consumer ~60,000 tons Medium to Large Producer (~300) Formal Financial Institutions
Other Federal & State Subsidy Programs Agrochemicals & Fertilizers Extension / Technical Assistance Irrigation Systems Research / Development Nurseries / Varietal Production Processed Fruit Chain ~10,000 tons Medium to Large , Vertically Integrated Producer / Packer / Exporter (~5) Foreign Supermarkets FIRA Product Flow Subsidy Flow
Each part of this section addresses an aspect of the chain, with financial flows addressed within the broader analysis, and with formal financial services addressed in section 0. Figure 13 shows the financial flows observed in the field analysis (red dashed arrows) superimposed over the product flows (light grey) shown in the previous figure. The financial flows include both formal financial services provided by financial institutions (described in Section 4.7) as well as trade finance flows internal to the chain, described throughout Section 4 and synthesized in Section 5.1.5. Again, thicker arrows indicate more prevalent financing schemes observed in the field analysis.
FIGURE 13: FORMAL AND INFORMAL FINANCIAL FLOWS IN THE CHIAPAS ATAULFO MANGO VALUE CHAIN
Small Producer (~5500) Packer Local Broker Exporter / Broker Foreign Consumer ~20,000 tons Wholesaler / Central Market Distributor National Supermarkets Independent Grocer / local marketplace National Consumer ~60,000 tons Medium to Large Producer (~300) Formal Financial Institutions
Other Federal & State Subsidy Programs Agrochemicals & Fertilizers Extension / Technical Assistance Irrigation Systems Research / Development Nurseries / Varietal Production Processed Fruit Chain ~10,000 tons Medium to Large , Vertically Integrated Producer / Packer / Exporter (~5) Foreign Supermarkets FIRA Key Product Flow Finance Flow
INPUTS AND NON-FINANCIAL SERVICES
At the level of production inputs, the Ataulfo mango chain in Chiapas includes suppliers of fertilizers, agrochemicals, tools, machinery, irrigation equipment, packaging materials, as well as nurseries for planting and grafting. The areas visited on the coast of Chiapas have access to inputs near production areas, as well as service providers for harvesting, pruning, spraying fertilizers and pesticides, technical audit services to verify compliance in the campaign against fruit flies, SAGARPA (Agriculture Secretary) approved phytosanitary checkpoints, installation of irrigation systems, and transport. Smaller producers tend to have very limited access to technical assistance, and as discussed below, extension services. Some input suppliers as well as some buyers provide technical assistance to producers as part of commercial transactions (embedded services) that has real value. In other cases “assistance” amounts to an excuse to charge commissions. For larger producers, vendors of fertilizers, crop protection products, nursery stock and cartons, were found to be providing up to P100,000 of trade credit for up to 60 days. Irrigation equipment providers show a general lack of interest in smaller growers as a potential market. Furthermore, there have been no serious efforts to demonstrate the benefit of irrigation to potential customers. One irrigation provider also indicated that local (sate-wide) water sources being unfit for drip systems, at least not with currently available standard filters. Further analysis of this issue may be
warranted, given the appropriateness of drip irrigation for smaller producers, as well as the more efficient use of water through such systems.
Packers access a wider range of service providers, including maintenance staff for hot water treatment equipment, electrical systems, refrigeration, mechanical equipment, pest control professionals, transport, and audits to ensure proper agricultural practices, among others.
PRODUCTION
Although there is a lack of reliable data available on production in general, interviewees provided an approximate distribution for Ataulfo mango producers in Chiapas, outlined in Table 2. Of medium and large producers, at least 5 are vertically
integrated, with three of them managing packing houses as well as stalls in the wholesale market in Mexico City, and at least two extended to mango distribution in the US and Canada.
Despite various problems and uncertainties producers express, particularly related to decreased productivity of Ataulfo trees without a rigorous understanding of what may be
causing the decline (described in further detail in section 1.0 below), most Ataulfo growers in the Soconusco seem to have found ways of operating that permit them to generate sufficient margins to stay in the game. Of all the growers we met, only two spoke seriously of the prospect of losing their farms; in both cases, this was due to unfortunate commercial decisions leading to large uncollectible receivables, and not to production constraints (although declining productivity is a key issue for the sector as discussed below). Estimates of profitability per hectare ranged from a low of P500/ha (which still
TABLE 2: MANGO PRODUCERS IN THE REGION BY SIZE
Producer Size Size of Plot
Estimated Number of Producers
Small Producer <50 hectares 5,500
Medium Producer 51-100 hectares 260
Medium-large Producer
101-500 hectares 30
Large Producer >500 hectares 10
represented a 30% return on sales of only P1,500/ha), to as much as P16,000/ha for the largest and most technologically advanced operations of conventional Ataulfo.
Although access to services through formal financial institutions is restricted in the case of producers, particularly small producers, trade credit options do exist within the chain for some producers. Figure 13 illustrates financial flows, including trade credit flows, between input suppliers and growers, and between buyers and growers in the form of advance payment for goods and services.
To finance orchard preparation and harvest, producers often access loans from packers. In some cases, formal loan contracts are written (sometimes only in English) for such advances whereas in other cases the loan is based on verbal agreement and informal documentation. The team observed loans that had zero nominal interest rate, but that tied the producer to less favorable conditions on sales than they otherwise would have attained. This amounts to an implicit (often high) fee on the loan. Another case had an explicit interest rate and no hidden commissions, with the loan to be paid in fruit at harvest.
Packers may also provide fertilizers or other inputs to producers on credit, after purchasing the inputs in bulk (at lower costs due to volume). In some cases the cost savings are passed on to growers, while in others, packers pocket the difference.
An important characteristic observed in trade credit flows is that they often flow both ways, from producer to packers at one level and from packers to importers and supermarkets at another at different stages during the season. That is to say, buyers demand financing from providers in the form of delayed payment as a sale condition.
THREE PRODUCTION COST / RETURN SCENARIOS
This section outlines three distinct production cost and return scenarios, each with its own assumptions, regarding costs, yields and market returns that are based on cases observed in the field analysis. Clearly, many other combinations of inputs, costs, yields and revenues exist, but these three scenarios illustrate combinations currently practiced in Chiapas for the production of Ataulfo mangoes, and provide a basis for sensitivity analysis of different approaches and yield fluctuations. Data tables and complete detail on assumed costs, prices and returns for each scenario are included in Annex A.
Scenario 1 models a conventional Ataulfo grower using agricultural practices based on the recommendations of INIFAP-Tapachula, and selling 60% of production into export channels (at
P4.50/kg) and 40% into National channels (at an average of P1.10/Kg). Total costs, including harvesting, amount to P12,030/Ha at the 8,000 kg yield level. With this level of pre-harvest costs, a yield of 8 MT/ha would generate a favorable margin of almost P7,650/Ha, while a yield of 2 MT/Ha would generate a loss of P4,110/Ha. The break-even yield for this scenario is 4 MT/Ha.
FIGURE 14: SCENARIO 1—INIFAP RECOMMENDED INPUTS, EXPORT & DOMESTIC COMMERCIALIZATION 0 2,000 4,000 6,000 8,000 10,000 12,000 14,000 16,000 18,000 20,000
Costs @ 2 MT/HA Revenues @ 2 MT/HA
Costs @ 4 MT/HA Revenues @ 4 MT/HA
Costs @ 8 MT/HA Revenues @ 8 MT/HA 3 Different Yield Scenarios
Cost
and
Revenu
es (Mexican Pesos)
Harvest Revenue (Export) Harvest Revenue (Domestic) Harvest Costs @ P0.50/kg Pest/Disease control Propping/Prunning fertilization Weed control +7,560 -4,110
The second scenario is based on data received at the Ejido Alvaro Obregon, and describes costs and revenues for a 13 hectare orchard with irrigation, based on a selective package of inputs and field
practices. Costs here are generally less per hectare than under the first scenario, particularly with regard to weed control, and pest/disease control. In both practices, chemical applications are substantially less, although hand labor practices remain in effect. Since the fruit from this orchard is sold to an intermediary (“coyote”) who pays cash at the farm gate for the entire harvest, any incremental revenue for the export portion of the production is captured by the intermediary, and the grower realizes only the domestic price for the entire harvest. The grower does, however receive payment upfront, without delay so there is a finance cost implicit in other forms of commercialization (especially for export and supermarket channels) that is avoided in this case (opportunity cost of the time value of money to the grower). Total costs, including harvesting, amount to P7,500/Ha at the 8,000 kg yield level. With this level of pre-harvest costs, a yield of 8 MT per ha would generate a favorable margin of almost P 1,400/Ha, while a yield of 2 MT/ha would generate a loss of P2,205/Ha. The break-even yield for this scenario stands at 5.7 MT/Ha.
FIGURE 15: SCENARIO 2—SELECTIVE INPUTS, DOMESTIC COMMERCIALIZATION, LOCAL INTERMEDIARY 0 1,000 2,000 3,000 4,000 5,000 6,000 7,000 8,000 9,000 10,000
Costs @ 2 MT/HA Revenues @ 2 MT/HA
Costs @ 4 MT/HA Revenues @ 4 MT/HA
Costs @ 8 MT/HA Revenues @ 8 MT/HA
3 Different Yield Scenarios
Co s t and Rev e nues (M exic a n Pe sos) Harvest Revenue Harvest Costs @ P0.50/kg Irrigation Pest/Disease control Propping/Prunning fertilization Weed control +1,395 -1 005 -2,205
The third scenario provides the value chain depiction for an organic grower, farming 50 hectares. Since there are very few organic growers in Chiapas, and it would be impossible to ensure confidentiality for the limited number of large-scale organic growers in this type of analysis, we have chosen instead to present figures based on an analogous operation in the state of Nayarit. The values presented here have been reviewed with Chiapas organic growers, and are deemed to be representative for that origin as well. The most striking differences here reside in the export utilization, and in the revenue per kg. Because of the “demand-exceeds-supply” status of organic Ataulfos in the United States, organic growers are able to find export outlets for 70% of their total harvest. Moreover, this export volume is able to command a 30-35% premium over conventional prices.
The net result, in this scenario, is a cost of P9,400/Ha at the 8 MT yield level. With this level of pre-harvest costs, a yield of 8 MT/Ha would generate a favorable margin of almost P26,840/Ha, while a yield of 2 MT per ha would still generate a positive margin of P2,660/Ha. The break-even yield for this
FIGURE 16: SCENARIO 3—CERTIFIED ORGANIC PRODUCTION, 70% ORGANIC EXPORT CHANNEL
While organic Ataulfo production in Chiapas is limited, it is worth mentioning that there is one large grower in Tapachula with about 85 Ha of certified organic production who sells on consignment to a local certified organic packing plant. Some small producers, including 10 members of the local Fruit Producers Association of Mazatán (totaling about 40 hectares), are awaiting certification, another 15 to 20 small producers (with about 50 hectares) are in process of transforming to organic production, and others have shown interest.
The production and commercialization scenarios presented above highlight the importance of yields. Clearly, at high yields, all producers do well, even given the very different agricultural practices and pricing potential. Perhaps even more important than yields in determining returns, however, is access to attractive commercial channels. As scenario three shows, depicting certified organic production sold at a premium into the export market channel, returns can be positive even at very low yields where prices are high, as they are in the organic Ataulfo niche.
+26,840 +10,720 +2,660 0 5,000 10,000 15,000 20,000 25,000 30,000 35,000 40,000
Costs @ 2 MT/HA Revenues @ 2 MT/HA
Costs @ 4 MT/HA Revenues @ 4 MT/HA
Costs @ 8 MT/HA Revenues @ 8 MT/HA 3 Different Yield Scenarios
C o st an d R e ven u es (M e x ic an P e s o s)
Harvest Revenue (Export) Harvest Revenue (Domestic) Harvest Costs @ P0.50/kg Irrigation Pest/Disease control Organic Certification Propping/Prunning fertilization Weed control
PACKING
Packers may be owners of mango plantations, handle third party production from independent producers, purchase fruit already packed, or some combination thereof. To export Ataulfo mango to the markets in the U.S. and Japan, hot water treatment is required for phytosanitary compliance.3
Fruit destined for the US market must come from growing areas certified as having a low density of fruit fly infestation, and must also be subjected to the USDA/APHIS-PPQ protocol for hot water treatment before it can be approved for shipment. For field control procedures, the sector is under the control of the
Junta Local de Sanidad Vegetal de Fruticultores del Soconusco, which is responsible to the Agriculture Ministry’s Departamento General de Sanidad Vegetal for surveillance of pest populations throughout the 18,000 Ha of Ataulfo in Chiapas, and for aerial fumigation as needed. The first hot water treatment facility (at S.P.R. Asake) in the Soconusco entered operations in the late 1980’s. At present there are 11 APHIS-approved facilities operating in the region, with capacity to process in excess of 16,000 MT per campaign.
Size, color, consistency and ripeness standards are important selection criteria for packing plants, although phytosanitary compliance is essential sector-wide to maintain market access. When inspectors find live fruit fly larvae, the fruit is confiscated and destroyed, and (ideally) traced back to the packer and orchard from which it came, assuming tracing data is available. The responsible orchard and/or packer are cut off from access to the US market for a short period. If larvae cannot be traced back to a specific area, or if the process for phytosanitary compliance is compromised, the region risks losing access to the US market. A market closure is unlikely when controls are in place and followed, but if it were to happen, it would cut off a major commercialization channel causing a glut in the domestic market and depressing prices.
Around 85 Ataulfo mango packers operate in the Soconusco region, including packing plants without hot water treatment, as well as packing
with thermal treatment certified for US export. Table 3 shows the approximate breakdown of packing plants in the region, based on field review and interviews.
Export packing plants that the team visited export 50-90% of their volume to foreign buyers in the US, Canada and, to a much lesser extent, Europe. Some buyers provide advances (which is then sometimes on-lent to producers) prior to the
harvest season. Advances are paid off in fruit over the course of the harvest as buyers credit shipped fruit against loans made to packers. Once the balance is paid off, the packer is in effect advancing fruit to the buyer, who pays for the remainder of the fruit after final shipment. Packers reported payment terms on shipped fruit ranging from 21-60 days for export sales, which in most (but not all) cases were replicated with producers.
TABLE 3: MANGO PACKING PLANTS IN THE SOCONUSCO
Type of Packing House
Number of Packing Houses
Export • 11 to US
• 5 to Canada
Domestic distribution
• 20 with formal infrastructure, packing about 65% of domestically distributed Ataulfo from Chiapas
• 50 home-style, packing about 35% of
domestic distribution.
Organic Certified • 1 currently certified and functioning
Payment to producers ranged from 8-15 days for domestic markets and longer, up to 60 days, for packing houses selling into export markets and supermarkets (basically sold on consignment in many cases), often including partial payment upon delivery. While some packers pay producers for the exact number of cases sold (some of whom require “copete” or over-packed cases, while others accept normal packing) others discount fruit (when practiced, 1 in 10 cases is commonly “discounted”).
Occasionally, foreign buyers have provided investment loans to packers to expand operations and increase the volume of fruit to which buyers get preferential access. In one case, after building a long-term commercial relationship, a foreign buyer provided long-long-term capital to upgrade and expand a packing house, with the loan paid off over time in mango exports. Although export packers generally have access to financial services (directly through banks and often backed by the government fund FIRA) these buyer-financed investment loans have filled gaps where bank loans were either unavailable or more costly.
PROCESSING
Processors demand mangoes for production of juices, jams, nectars, canned mangoes, ice creams,
concentrates and dehydrated fruit, among others. They generally require standard consistency, but are less demanding with regard to appearance, and tend to buy fruit that doesn’t necessarily meet standards of export packing plants.
Despite good volumes of production and a high-quality product for processing4, processors have a very limited presence in the region. There are two industrial-scale dehydrating plants in the region, including one organic certified plant, with many more cottage-scale drying facilities also in operation. There are no aseptic or retort juice or pulp facilities in the state.
There are several local craft companies that manufacture candy, liquor and other products with Ataulfo mango, but the scope of these small businesses are limited to the local market.
Some trade finance was found at this level of the value chain, where a foreign buyer provided long-term capital investment for improving organic fruit drying operations in order to meet market demand. Similar to the investment credit offered by an international buyer to a packer mentioned in the preceding section, the team observed one case of a buyer of organic dried mangoes that provided investment loans to expand drying operations.
COMMERCIALIZATION
Based on discussions with growers and packers in the Soconusco region, fresh domestic distribution channels of distribution (sales to packers, intermediaries, wholesalers or retailers within Mexico) account for about 60%-70%, on average, of the sale of conventional Ataulfo mangoes produced in Chiapas. An additional 20% - 30% moves into export channels, almost all of which is sent to the United States and Canada.
4 The Asociacion de Fruticultores del Soconusco had an initial analysis conducted of regional Ataulfos that indicated favorable
measurements in terms of Brix, fiber, and other qualities, as compared to other varieties. And juicing operations have expressed interest in establishing operations in the region.
While the 20%-30% export distribution may serve to describe the state-wide industry as a whole, many of the integrated grower/packer/shipper organizations surpass this average. Indeed, the local INIFAP office indicated to us that a 40% export distribution was typical of many of the export-oriented facilities in the zone. In the case of organic production, moreover, this
percentage could be expected to increase up to a level of 70% of the total crop, with only 30% moving into fresh domestic and processed channels as discussed in the scenario analysis in the preceding section.
Supermarket Trends in Mexico
A recent study lead by Thomas Reardon (Michigan State University) and Julio A. Berdegué (Latin American Center for Rural Development) examines the growth of supermarkets in Mexico. Supermarkets grew slowly in Mexico during the 1980s, began to take off in the 1990s and in recent years have shown rapid sustained growth,
reaching nation-wide coverage and gradually taking market share in the category of fresh fruits and vegetables. The five largest chains in Mexico—Wal-Mart de Mexico, Soriana, Comercial Mexicana, Chedraui and Gigante*—have top-line annual growth of 20%, through a combination of new openings and sales growth through existing stores. Total sales are now roughly equivalent to twice the value of Mexico’s food exports.
Supermarket chains are expanding their presence within large cities in the central and northern regions, while also growing in medium and small cities (with different models and smaller structures), having recently expanded into southeastern Mexico. In addition to differentiated structures, supermarket chains also are differentiating supply, quality, and pricing by branch based on local market characteristics.
In the US and Europe, supermarkets operated for many years before buying fresh fruits and vegetables directly from producers, but Mexican supermarkets are moving more quickly. While in the past supermarkets in Mexico obtained fresh fruits and vegetables mainly from wholesale channels, now they are complementing and gradually replacing that source through combinations of local intermediaries and producers.
Of particular relevance to small producers, the supermarkets are increasingly
centralizing their procurement operations, either through their own distribution centers or by procuring directly from large producers. Although a large portion of fresh fruits and vegetables is still supplied by traditional wholesale markets, domestic and international trends, as well as interviews with warehouse owners in wholesale markets, suggest that this channel is declining in relative importance.
* Soriana purchased Gigante in 2007, converting
One result of the success of Ataulfo exporters from the Soconsco is that much of the best fruit from the region appears to bybass domestic wholesale channels. The team found that in the height of the Chiapas Ataulfo season, the highest quality fruit in the domestic wholesale market in Mexico City markets came from Guerrero. Guerrero does not
yet have hot water treatment plants to export directly, although interviewees in Nayarit indicated that this is being planned.
In addition to the key role in commercialization played by packers, outlined above, the most representative
commercialization channels observed were:
• Local intermediary. The producer sells (either post harvest or on-tree in advance) to the local intermediary, who generally pays cash and delivers it to the main regional and local markets. The itermediary selects and sorts the fruit according to the different requirements of the domestic market, the foreign market or industry. Purchasing criteria include the basic phytosanitary conditions of the orchard and fruit ripeness. In this case, producers’ transaction costs are relatively low, while opportunity costs can be high. An important aspect of this channel is the quick access to cash at a time of the year when producers tend to be highly illiquid. Therefore, liquidity, or lack thereof, can determine the channel into which fruit is sold.
• Warehouse Owners at Traditional Wholesale Markets (Central de Abastos). Warehouse owners buy fruit in large volumes and generally pay in cash. The fruit is channeled to retail markets. Wholesale markets, despite increasing importance of supermarkets, remain important supply centers for supermarkets, and are the main suppliers of public markets (tianguis) and other retailers. Traditional wholesale markets in Mexico’s main metropolitan areas have been ceding influence to various new wholesale markets in secondary cities that previously depended on
the biggest wholesale markets in the largest cities, and especially to supermarkets due to their business strategy to buy through local intermediaries or directly. In the domestic market, the traditional
wholesalers are an important channel to supply fruit vendors, grocery stores, restaurants, supermarkets, hotels, industrialization plants, etc.
• Supermarkets in Mexico are becoming the main point of sale to consumers, increasingly taking control of traditional channels to set conditions and manage domestic channels. Supermarkets are gaining control of the governance of the fresh fruit and vegetable chains, and mango is no exception. Producers that market their fruit through packers linked to supermarket chains may have greater demand for their orchards going forward (if not greater bargaining power) as this channel takes market share from traditional channels. Given the increasing degree of influence supermarkets have on fresh fruit and vegetable chains in Mexico, the box at right offers a brief summary of supermarket trends in Mexico, and further details follow.5
Supermarket trends have important implications for the Ataulfo mango chain in Chiapas. Ataulfo producers that sell into supermarket chains in most cases sell through packing houses and (still) through the traditional wholesale markets, except in the case of the largest integrated grower/packers, a few of which maintain direct agreements with supermarkets (and in many cases may supply supermarkets from their stalls in wholesale markets). Conventional mango is one of Mexico’s highest volume fruits, and Ataulfo is a favorite variety in the domestic market, so the ability to consistently meet volume and quality requirements is mandatory for supplying supermarkets.
One difference in requirements between domestic and international supermarket channels, however, is that (for now) supermarkets operating within Mexico do not require traceability of fruit back to its origin. This allows fruit from a broad range of producers, including small producers, to access this channel (whether they know it or not).
One large producer/packer mentioned that supermarkets take 45-60 days to settle payments, and that the margin earned on purchased, packed fruit sold to supermarkets was around 6-7%. Wal-Mart de Mexico indicated that it pays suppliers in 30 days, and that after six months of experience with a supplier, Wal-Mart may facilitate access to factoring services at a partner bank (including but not exclusive to Banco Wal-Mart) where 80% of the invoiced payment is made in 7 days, and the remaining 20% is paid 30 days later. The cost estimated for factoring (a flat commission charged on the value invoiced) ranged from of 0.8-3.0%, with the higher half of this range seemingly undesirableif the packer’s margins in selling to supermarkets are as tight as mentioned above.
One export packer interviewed that might otherwise be interested in supplying supermarkets, indicated that payment terms eliminate this option since the packing house commits to pay producers in a week, and the packer does not have the liquidity to cover the time between paying producers and the 60 days that would pass between delivering fruit to a supermarket and receiving payment. Again, as was witnessed among producers, illiquidity can determine the commercialization channel accessed.
5 Reardon, Thomas; Berdegue, Julio A.; Echanove, Flavia; Cook, Robert; Tucker, Nancy; Martinez, Anabel; Medina, Ruben;
Aguierre, Marx; Hernandez, Ricardo; Balsevich, Fernando; “Supermarkets and Horticultural Development in México: Synthesis Findings and Recommendations to USAID and GOM.” USAID. August 2007.
International sales to supermarkets almost invariably flow through an import broker, but a couple of the Chiapas-based integrated producers also are established as brokers on the US side of the border.
Supermarkets in the US and Canada prefer to deal with a small group of brokers that can supply their needs for all varieties of mango, year around. Brokers that are also vertically integrated back to
production, tend to source from Mexico throughout much of Mexico’s producing months, moving up the coast as the season advances, and then turning to other sources in South America as Mexico’s production winds down.
According to Reardon, Berdegue, et al. purchasers at supermarkets indicate that small producers or groups of producers might have greater success is in providing niche products where lower volumes are demanded. Organic mangoes represent a niche where domestic demand (although small and limited to higher income areas) appears to be growing slightly faster than the supply that makes it into domestic chains, maintaining a premium similar to that for organic exports examined earlier. One supermarket interviewed showed real interest in expanding purchase of organic Ataulfo mangoes, but skepticism regarding domestic consumer’s willingness to pay a 30% premium. The buyer further indicated that the supermarket would become much more aggressive in marketing organics around a 15% price premium. While smaller producers may have comparative advantages in meeting niche demands, Reardon, Berdegue, et al find that supermarkets in general have no interest in working with large numbers of producers nor with their organizations, preferring to manage fewer relationships in meeting their needs. On the potential role of small producers in supermarket chains, the authors claim:
“In the long run, the rise of supermarkets in Mexico represents a serious challenge to the asset-poor small farmer engaged in horticulture. The bottom line is that the great majority of horticulture is made up of the large-volume products—and the cost and quality and competitive pressures induced by the supermarket revolution will sooner or later bear down on small holder horticulture over the areas of Mexico, first in the north, then the center, and finally the south. However, in the short-medium term, the expanded markets, quality differentiation, and price premiums represent obvious market opportunities.” 6 The emphasis in the above paragraph is added because it suggests a potential role for long-term capital investment loans, which under certain circumstances (when the producer is linked to reliable buyers, for instance) may enable a producer to evolve from being asset-poor to being able to invest in upgrading production practices and conditions, post-harvest handling and infrastructure.7
The supermarket study, focusing on guava producers in the state of Michoacán, found that 12% of households have access to formal financial services, and indicated that fixed capital assets are a primary determinant of access to competitive chains. However, the study found that access to loans per se was not a determining factors to access competitive channels. This suggests that while access to working capital loans from financial institutions may not be a key success factor for small producer success, the lack of access to investment capital is a major constraint because without it producers face difficulty in acquiring fixed assets that are success factors.
6 Reardon, Berdegué, et al. p. 27.
7 See for example: González-Vega, Claudio; Chalmers, Geoffrey; Quiros, Rodolfo; Rodríguez-Meza, Jorge; “Hortifruti in Central
America, A Case Study about the Influence of Supermarkets on the Development and Evolution of Creditworthiness among Small and Medium Agricultural Producers.” The Ohio State University, USAID. April 2006.
FIGURE 17: DISTRIBUTION OF COMMERCIALIZATION VALUE, 3 ILLUSTRATIVE CASES 0.00 5.00 10.00 15.00 20.00 25.00 30.00 35.00
Domestic Chain* Export Chain Organic Export Chain
P e sos pe r K g . M ang o A ta u lfo ( p rim e ra t o p qu ali ty ) US Retailer Import Broker Domestic Retailer Wholesaler Packer Local Intermediary Producer
VALUE DISTRIBUTION ESTIMATES: 4 CASES
Figure 17 below shows 3 distinct cases observed in the field analysis with estimates of the percentage of value to the end consumer that is obtained at different stages in the chain. Given data limitations, especially the near complete lack of reliable data on prices in the domestic market, the calculations are based on a limited set of interviews at one point during the season and are presented here to illustrate cases observed. A more definitive calculation would require a much larger sample size over the course of the season at each level of the chain.
The first case represents a small producer that sells to a local intermediary (at P 1.10/kg), who pays cash and takes on commercialization and distribution risks, as well as costs related to transport. The
intermediary then sells to the traditional wholesale market, which sells to domestic retailers. Larger integrated producer/packers are able to capture more of the final price (they also take on more cost and risk), selling directly to supermarkets. Although these are not representative of the majority of producers, they deserve mention since they sell high volumes of Ataulfo mango. In the two export cases shown, prices paid to producers are considerably higher (P 4.75/kg), with the organic producer realizing a 30% premium (P 6.20/kg) on sales, although payment is generally delayed as discussed above. Data used in this figure is presented in Annex A.
FORMAL FINANCIAL SERVICES
Financial institutions in Chiapas appear to lack a clear sense of the opportunities and risks involved in lending to the Ataulfo mango value chain, despite the fact that this is a growing and competitive chain
with regional importance within Mexico, and despite growing competition among financial institutions that is driving a search for new market niches.
At the risk of over-simplification, formal financial institutions that might be interested in serving the Ataulfo chain can be grouped in four basic categories:
• Banks, which in the past have shown that they will lend to the chain only when they are able to do so without taking risk, nor using their own capital (see Figure 18: ). Banks could lend directly or
indirectly, and could provide access to the payment system and to basic accounts at multiple levels of the value chain.
• Agricultural finance companies, a small (relative to the number of financial institutions in Mexico) but growing group that tends to specialize in financing crops (as opposed to the concept of financing the diverse flows of households or growers) based on scoring models determined by the agricultural lending fund FIRA, but few of these have significant experience to evaluate other flows and expenses, i.e. agricultural household analysis, and few operate outside FIRA schemes.
• Microfinance institutions, the best of which tend to understand rural household financial flows well, and may offer small farmers of various types their standard individual or group loan products (and in a few cases, savings), but generally have limited or no expertise in agriculture, and have products and lending methodologies originally designed for urban or semi-urban traders.
• Credit unions (cajas) which can offer savings products, but tend to be somewhat limited in their ability to measure agricultural cash flows and develop payment schemes around those flows, in stead tending to lend based on multiples of the savings a client holds at the credit union.
Banks and non-bank financial institutions in the main Ataulfo production areas in Chiapas (around Tapachula) maintain good overall presence and offer accessible deposit accounts, although they generally do not lend directly to producers, and what loan products do exist are not currently well adapted to the needs of the mango chain.
Financial institutions operating in the region have not developed the capacity, motivation and
organizational culture to understand and respond to the needs of the chain, especially to the needs of the vast majority of its producers and their households (where business and family cash flows and financial needs mix, with important implications for financial service design). Furthermore, financial institutions in general still need to develop the capacity to measure and manage risk in lending to this chain. As
discussed below, risk has generally been covered by a series of overlapping (mostly public sector) cash guarantees.
Still, despite a track record of near indifference to the needs of the mango value chain, financial institutions are increasingly motivated to serve agricultural chains, including producers. Also, the Mexican financial institutions are increasing their search for new and promising niches, as can be witnessed in the rapid growth in microfinance, and in the increasing number of financial institutions seeking to serve agricultural chains. There appears to be a strong business case for financial institutions to find, understand, and serve actors in potentiallycompetitive chains such as the Ataulfo chain in Chiapas.