Achieving energy efficiency through industrialized building system
for residential buildings in Iraq
Ammar W. Abbood, Karam M. Al-Obaidi
⇑, Hanizam Awang, Abdul Malek Abdul Rahman
School of Housing, Building and Planning, Universiti Sains Malaysia, 11800 Penang, Malaysia
Received 3 June 2014; accepted 2 February 2015
Abstract
Achieving energy efficiency particularly in Iraq is very critical due to continuous energy crisis since the 1990s. One of the major cities, Basra City faced this crisis since 2003 with energy generation declining by 26.4%. The building industry in Iraq represents the largest demand of energy, mainly in residential sector. In fact, most residential buildings depend on conventional construction system. In the past, the traditional system used to provide comfortable conditions during summer and winter. However, because of the increasing effect of global warming and technological advancement, this constructional system is no longer viable. Currently, the Industrial Building System (IBS) represents one of industrialization approaches which aims to enhance building quality and performance. However, the prefabrication construction system is rare and scarce in this country. Based on previous scenarios and researches, this study aims to investigate and compare the level of energy efficiency in the conventional system and IBS. Since it is difficult to collect data because of instability and insufficient provision of energy generation, the study was based on a simulation approach by using the EnergyPlus software to evaluate the actual condition. The study targeted an existing house in Basra (two-stories) with built-up area of 135 m2. The performance was measured on the two systems throughout the year. The findings showed that the annual energy demand for cooling and heating for the conventional system was 19,311.99 kWh while the IBS performed efficiently with 7374.57 kWh. As a result, IBS reduced the annual energy consumption of 37.32% for heating and 65.36% for cooling.
Ó2015 The Gulf Organisation for Research and Development. Production and hosting by Elsevier B.V. All rights reserved.
Keywords: Energy efficiency; Industrialized building system; Residential buildings; Iraq
1. Introduction
According to World Watch Institute Estimations, build-ings are responsible for 40% of the total energy consumption worldwide with greater percentage in the industrialized and
urbanized countries (Graham, 2003; Oldewurtel et al., 2010). In Iraq, the building sector in Baghdad is responsible for 48% residential, 29% industrial, 13% offices, 6% com-mercial and 4% agricultural of energy consumption (Alsammarae, 2005). Most of the energy consumption in Iraq is for cooling and heating that require a great amount of energy loads as compared to lighting and other uses.
Hasan (2012)indicated that 69% of the annual energy use in houses in Baghdad consumes for cooling with 42% and 26% goes for heating.
http://dx.doi.org/10.1016/j.ijsbe.2015.02.002
2212-6090/Ó2015 The Gulf Organisation for Research and Development. Production and hosting by Elsevier B.V. All rights reserved.
⇑ Corresponding author. Tel.: +60 174039378.
E-mail address:karam_arc@yahoo.com(K.M. Al-Obaidi).
Peer review under responsibility of The Gulf Organisation for Research and Development.
Generally, energy generation in Iraq has always been in a continuous crisis because demand exceeds supply since the 1990s due to war situation and the current poli-tical instability (Alaamery, 2008). The economic embargo in Iraq has caused the utmost deterioration of the exist-ing energy generation, causexist-ing shortage of energy supply to building sectors (Al-Ali, 2013). Basra City, as one of the major cities in Iraq, faces this energy crisis since 2003 with energy demand reaching 750 megawatt during the summer of 2004 while hitting 850 MW in 2005, an increase of 12% in one year. This increase in energy demand parallels the improved quality of life after the lifting of the economic embargo in the country (Umran, 2007).
Energy supply in Basra relies completely on fossil fuel resources. There are two types of power plants in this city, the natural gas power plants and the steam power plants. The steam power plants are powered by either oil or diesel (Ministry of Electricity, 2014b), accounting for 60–70% from the overall power generation in Basra and is the major energy provider in the southern Iraqi region. How-ever, energy generation has decreased by 13% in 2010 com-pared to 1990, resulted from the poor maintenance and the sudden shutdown of some of the steam power plants ( Al-Ali, 2013).
The energy problem is a very serious issue not only for the insufficient supply of energy to existing housing units nut also Basra faces inadequate number of housing units to meet current demand of the population. And this supply of housing units needs energy as well. The Institution for Economic Reform in Iraq conducted a seminar in 2009 to discuss the requirements needed to promote the housing sector (IIER, 2009) which mentioned the challenges the residential sector faces as (Al-Shok, 2009; Al-Ansari, 2009) stipulated below:
63% of families out of the total Iraqi population do not own a house.
10% of the current housing stock are overcrowded with 25% of it suffering from over-crowding.
5% of the annual housing degradation i.e. condemned housing units and
The inability of the current housing players to adequate-ly face these challenges.
Therefore, improving the building industry is a key issue in Iraq. Most residential buildings depend on a convention-al construction system for design and implementation. This system is characterized by load bearing walls (brick) and concrete slab roof. In the past, this system used to provide comfortable conditions during the summer and the winter. But, with the gradual effect of global warming and techno-logical advancement, the traditional system is no longer economically viable. Most modern houses require a high amount of energy to operate and maintain (Jasem et al., 2008; Rahman et al., 2013; Al-Obaidi et al., 2013; Al-Obaidi et al., 2014a).
2. Literature review
The term ‘energy efficiency’ specifically referring to heating and cooling in buildings is directly related to two factors during the design stage. First, building envel-ope and second building occupants. Ahmed (2006) dis-cussed the effect of the building envelop on the energy needed for cooling and heating, found a major link between the two factors. In addition, Kharrufa and Adil (2012) studied the building envelope to reduce cooling loads in Iraq by studying a roof pond. Kadury (2010)
indicated that 60–70% of heat gain should be eliminated from building interiors in countries such as Saudi Arabia and Iraq in order to gain energy efficiency. Aktacir et al. (2010) showed that using thermal insulation reduces the cooling loads significantly in the hot-dry climate.
Kadury (2010) found that using thermal insulation and other design procedures can achieve energy efficiency in these buildings by 60%.
The Industrial Building System (IBS) represents one of the industrialization approaches which aims to enhance building quality and performance. This concept can be viewed as a solution to solve the issues of energy efficiency in Iraq. IBS is a total integration of all subsystems and components into overall process completely utilizing indus-trialized production, transportation and assembly. The sys-tem includes balanced combinations of software and hardware components (Thanoon et al., 2003a; Nawi et al., 2007). The software components are represented by the design of the system, which considered a complex pro-cess of studying the establishment of the manufacturing, assembly layout, process, resources, materials allocation and designer conceptual framework. Whereas, the hard-ware components are classified into three groups; the post or frame and beam system, box system and panel system as shown inFig. 1.
There are many terms that overlap with the idea of IBS such as the Off-Site Manufacturing (OSM), Off-Site Pro-duction (OSP), and industrialized building assembly, pre-fabrication and modularization, where the concept is the same. Industrializing the building industry is just like any industrialized product to achieve efficiency in material used and time consumed.
Generally, major shares of IBS originated from the United States, Germany and Australia with market share of 25%, 17% and 17% respectively (Thanoon et al., 2003b). Malaysia as a hot country started to recognize IBS as the ‘best practice’ during late nineties because of the need to supply the people with affordable and quality housing as an alternative for the conventional building system. However, its practices have faced many chal-lenges. IBS Roadmap Review (2007) shows that the per-centages of completed projects using more than 70% of IBS components in the construction project are in the range of 10%. Prefabricated houses in Japan are actually 20% of the overall housing units from 1999 to 2000, as for the systems used in these efforts. The steel framing system
dominated by 73% of the overall IBS market while wood framing had the share of 18% with reinforced concrete came in the last rank with 9% (Nagahama, 2000). In the United States, the first application of the IBS goes back to 1950s. In 1999, prefabricated houses have gained a substantial market share with 30% of all residential buildings (Xu and Zhao, 2010).
However, the prefabrication industry in Iraq is insignif-icant. The local knowledge lacks in many aspects par-ticularly its application. A number of studies have been conducted about building prefabrication such as Mohee and Al-Bity (2011)who studied the structural building per-formance efficiency, and in another study experimented the speed element of the prefabricated modular system (Mohee, 2009). Abod et al. (2011) evaluated the building performance of a prefabricated residential housing unit. Prefabrication companies are rare in this country despite the fact that in 2013 the Iraqi Ministry of Housing and Construction declared that prefabricated system will be the main construction system (Affef, 2013). The first pre-cast concrete plant was opened recently on April 2014 at Bismayah, Baghdad which mainly produces panel system (Bismayah, 2014).
Therefore, based on previous scenarios and researches, this study aims to investigate the approach of energy effi-ciency to achieve the following goals:
(i) Evaluate the performance of existing building system (conventional) and industrialized building system (IBS) in the Iraqi housing construction.
(ii) Estimate the amount of cost saving between two systems.
The study represents one of few studies that aims to evaluate the concept of industrialization in housing sec-tor to the Iraqi building industry. Other few studies have discussed different concepts other than the energy efficiency of the industrialization concepts such as the speed (Mohee, 2009), performance (Mohee and Al-Bity, 2011; Abod et al., 2011) and structural behavior (Wail, 2010).
3. Methodology
This study compared the performance of energy con-sumption between conventional system and the proposed IBS system in the same house model in the city of Basra, Iraq. Since it is difficult to collect actual data because of instability in energy generation and insufficient energy sup-ply, the study was based on a simulation approach by using the EnergyPlus software to evaluate the actual condition. Currently, there are many studies in this field adopting computer simulations to assess building conditions for sav-ing cost and reliability byGranadeiro et al. (2013), Daly et al. (2014)and Al-Obaidi et al. (2014b). As a result, the paper depended on an actual weather climate and data gen-erated from the computer simulation to perform the analysis.
EnergyPlus (8.0.0.008) is a software developed by the U.S Department of Energy – The Office of Energy Efficien-cy and Renewable Energy (EERE, 2014). EnergyPlus is an energy analysis and thermal load simulation program. It calculates heating and cooling loads associated with mechanical and other systems context. EnergyPlus has the ability to simulate a situation close to the real building situation (EERE, 2013). The validation of EnergyPlus was tested by Henninger et al. (2003), Witte et al. (2004),
Tabares-Velasco et al. (2012), Su et al. (2012) and Zhao et al. (2013).
Basically, EnergyPlus requires two main types of data to simulate; weather data and input file. Weather data is a record of many weather variables such as temperature, humility, solar radiation, cloud cover, wind and other vari-ables. These data are gathered hourly according to a stochastic model (Harvey, 2006). Weather Analytics pro-vide this data through many meteorological stations around the world. According to Weather Analytics, the weather data are classified into two types, Typical Meteorological Year Files (TMY) and Actual Meteoro-logical Year Files (AMY). The first type (TMY) is weather data that have been created by looking at 15–30 years of hourly data a given location, it can be considered as the average weather data of this area. The other type is the Figure 1. IBS classification systems (Mian, 2006); (a) frame system, (b) panel system (c) box system.
actual hourly data sets over a year, or a specific period (WA, 2014). For this study, the (AMY) weather data of the year 2013 for Basra City were chosen in order to com-pare the energy performance of each building type under this recent climatic condition.
The other type of data which is the input file represents the description of the building design, materials, HVAC systems and many other variables. It was created by using (IDF Editor) which is part of the EnergyPlus application package and using the Open Studio add-on in SketchUp, this add-on has been provided by The National Renewable Energy Laboratory (NREL), which is compatible with EnergyPlus. In this paper the house model was generated using the Open Studio application while other parameters such as the material and their properties have been entered using the IDF Editor.
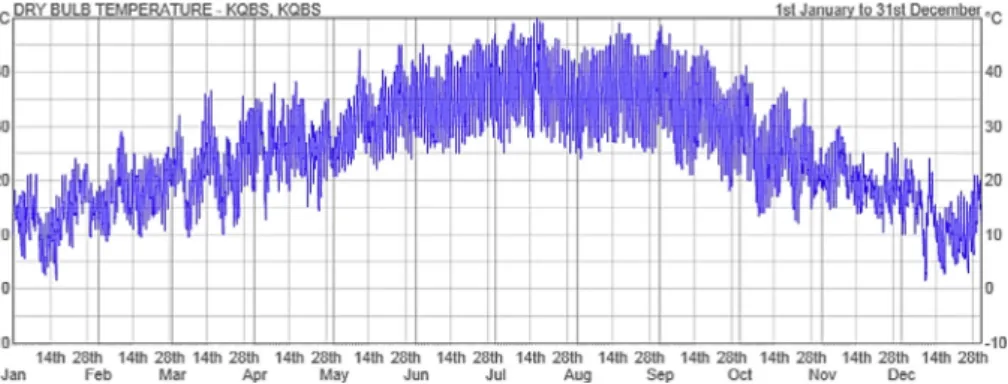
The case study was located in Basra in southeastern part of Iraq. The climate of this region is hot and dry with mostly two seasons, summer which lasts for 8 months and winter with 4 months duration. The coldest month in the year is January, in which its temperature varied from 5 to 10°C, and the hottest month of the year is July, in which its temperature could reach above 45°C, especially in the desert areas of Iraq (Weather Online, 2014) as shown in Fig. 2.
The geographical coordination based on Google Earth is E 47°4904800 and N 30°3005400. The following map shows the location of the house within Basra City as shown inFig. 3.
The house is a two-story building with total built up area of 135 m2as shown inFig. 4.
Actually, not all zones are conditioned, the conditioned zones are: living room, guest room, bed room1, bed room2, bed room3, bed room4 and corridor2 as shown inTable 1. The thermostat set point for cooling and heating was set to 20°C–23.3°C based on the ASHRAE Handbook of Fun-damentals Comfort Model 2005. The device used for the air-conditioning operation for each one of the zones was the packaged terminal air conditioner with automatic switching system. In fact, the limitation of this study was focused only on air-conditioning consumption in (kWh) without any form of lighting, no residents and no other forms of energy consumption.
In the next sections show the details of the construction models for this study which divided into two types as shown below:
3.1. Conventional system
For the conventional design, the following sections and materials were used to perform the analysis. This informa-tion was collected from the actual house construcinforma-tion documents which also represent the typical Iraqi house design. The selected glass type was of normal float 4 mm thick glass with aluminum frame.
The following Tables 2 and 3 show the building envel-ope layers and their thermal prenvel-operties used in the simula-tion (Fig. 5).
3.2. IBS (the proposed model)
For the IBS system, house model was constructed with a steel skeletal structure, prefabricated polyurethane sand-wich panel, and precast concrete hollow core slab as floor-ing material. The selected glass type was normal float 4 mm thick glass with aluminum frame. The details of each ele-ment are shown below:
3.2.1. Sandwich panels
Sandwich panels consist of an insulating material inter-posed between outer and inner layers of thin concrete or steel panels. The insulating layer has no part in the struc-tural strength of the panel. The core material is polyur-ethane. For the connection between these panels, inserts, bolts and welds were used.Fig. 6is an example of the test-ed sandwich panel.
3.2.2. Hollow core slabs
It is a precast floor material with advantages such as the easy and efficient automated production, higher quality, 40–50% reduction in self-weight, material saving, possibility of wide range of depths and void shape, and the ability to cover large spans up to about 16 m (Trikha and Ali, 2004). The shape of the void in the hollow core slab used for this study is rectangle. The hollow core slab
usually manufactured in a width of 1.2 mFig. 7shows typi-cal cross-section of precast hollow core slabs.
In addition, details and layers of the IBS system are shown inFig. 8, andTables 4 and 5.
3.3. Cost comparison
For measuring the energy cost for each structural design, the Iraqi Ministry of Energy calculates the cost Figure 3. House location in Basra city (Google earth).
by multiplying the energy consumption (measured by kilo-watt per house) by a value in Iraqi Dinar. This value depends on the total monthly consumption per kWh
(Ministry of Electricity, 2014a). The value for residential use is shown inTable 6.
4. Results and discussion
4.1. Conventional system
Fig. 9shows the findings of the heating energy for each air-conditioned zone. The figure indicates that energy needed for heating cannot be considered as a primary source of energy demand in this region. Its actual demand can be found in only 3 months, December, January and Table 1
Summary of house specification.
Spaces Area [m2] Conditioned (Y/N) Volume [m3] Gross wall area [m2] Window glass area [m2]
Kitchen 16.38 No 49.14 48.60 2.00
Living room 18.52 Yes 55.57 51.90 1.50
Guest room 25.20 Yes 75.60 48.60 2.25
Bed room1 19.74 Yes 59.22 40.80 2.25
Bed room2 19.74 Yes 59.22 39.30 2.25
Bed room3 16.38 Yes 49.14 48.60 2.25
Bed room4 25.20 Yes 75.60 61.20 2.25
Corridor1 31.38 No 94.15 62.40 0.25 Corridor2 57.97 Yes 173.93 113.34 5.90 Bath1 4.09 No 12.28 18.00 0.25 Bath2 4.09 No 12.28 18.00 0.25 Total 238.71 716.14 550.74 21.40 Conditioned total 182.76 548.28 403.74 18.65 Unconditioned total 55.95 167.86 147.00 2.75 Table 2
Conventional external wall layer properties. Layers Thickness (m) Conductivity (W/m.k) Density (kg/m3) Specific Heat (J/kg.k) R-Value Cement plaster 0.02 0.72 1860 840 0.02 Brick wall 0.24 0.9 1920 800 0.26 Gypsum plaster 0.01 0.38 1120 1090 0.02 Total 0.27 0.30 Table 3
Conventional exterior roof layer properties.
Layers Thickness (m) Conductivity (W/m.k) Density (kg/m3) Specific Heat (J/kg.k) R-Value
Concrete tiles 0.04 0.061 2100 837 0.65 Sand 0.02 0.35 2080 840 0.05 Dirt 0.14 0.064 1500 1260 2.18 Insulation board 0.05 0.035 24 1210 1.42 Asphalt 0.02 0.74 2110 920 0.02 Reinforced concrete 0.20 1.95 2240 900 0.10 Total 0.47 4.42
February. Table 7 presents the annual total energy con-sumption for all zones which was 2434.67 kWh. In fact, the maximum heating energy consumption was in Decem-ber with 1277 kWh total for all zones when this month recorded the lowest outdoor air temperature in the year around. However, from March to November the readings displayed almost zero consumption due to the characteristic
of regional climate.Fig. 9shows that corridor 2 recorded the maximum reading with 301.57 kWh because of its lar-gest space area which is 57.97 m2 and window glass area of 5.90 m2. Whereas, bed room1 was the minimum with 100.5 KWh because of its small area of 19.74 m2with win-dow glass area of 2.25 m2as shown inTable 1above.
On the other hand,Fig. 10 shows the energy consump-tion of cooling which represents the maximum demand of energy during the year not including the months of Decem-ber, January and February.Table 8indicates that the total annual consumption for cooling reached 16442.73 kWh, which is 86% of the total energy demand. The highest consumption was recorded in July with 3551.78 kWh for all conditioned zones. Generally, the weather data showed that in July, the maximum outdoor temperature reached around 50°C.Fig. 10 shows that corridor 2 recorded the maximum reading of energy consumption with 1307 kWh Figure 6. Sandwich panel details (Ruukki, 2014).
Figure 7. Typical Cross-sections of hollow core slabs (Trikha and Ali, 2004).
Figure 8. Graphical models of IBS system; (a) hollow core slab interior ceiling connected to steel structure (b) sandwich panel and steel column connection.
in July due to its largest space area which is 57.97 m2and window glass area of 5.90 m2. Whereas, Bed room 2 was the minimum with 257.68 KWh in July for area of 19.74 m2 and window glass area of 2.25 m2 as shown in
Table 1above. 4.2. IBS
Fig. 11shows the findings of the heating energy for each air-conditioned zone. Table 9 indicates that total energy
demand for heating in the IBS which recorded 1525.83 kWh. Fig. 11 shows that most consumption was in the months of December, January and February. How-ever, other months recorded almost nothing due to region-al climate. The maximum energy consumption was in December with 623 kWh for all conditioned zones. Com-paring this value with conventional system showed a great reduction. In fact,Fig. 11shows that living room recorded the maximum reading of energy consumption with 125.63 kWh in December whereas bed room 4 was 71.06 kWh in December. Actually, comparing these spaces with conventional system, IBS shows that ground floor consumed more energy than 1st floor while with conven-tional 1st floor was the highest. In addition, the total ener-gy demeaned showed that IBS was performing efficiently during winter times.
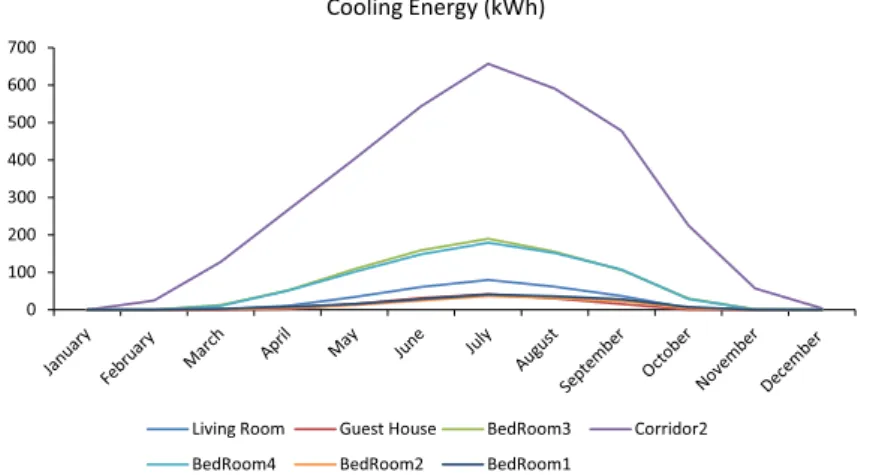
On the other hand,Fig. 12 shows the energy consump-tion of cooling which represents the maximum demand of energy during the year not including the months of Decem-ber, January and February. Table 10 indicates that the total annual consumption for cooling was 5695.19 kWh. The maximum energy consumption was recorded in July with 1223.35 kWh. In fact, the energy demand for cooling with IBS accounts for 78.86% of the total energy consump-tion.Fig. 12shows that corridor 2 recorded the maximum reading with 656.69 kWh whereas bed room 2 recorded the lowest with 36.87 kWh. Actually, the performance of IBS during summer time and especially in July behaves similar-ly to conventional system in same spaces however the reduction was significant.
Generally, the difference of energy demand for heating between two systems was 908.84 kWh. This value indicates Table 4
External wall material layer properties for IBS model.
Layers Thickness (m) Conductivity (W/m.k) Density (kg/m3) Specific heat (J/kg.k) R-Value
Metal surface 0.0006 45.28 7824 500 1.32
Rigid polyurethane foam 0.088 0.026 40 1472 3.38
Metal surface 0.0006 45.28 7824 500 1.32
Total 0.08 6.02
Table 5
Exterior roof layer properties for IBS house model. Layers Thickness (m) Conductivity (W/m.k) Density (kg/m3) Specific heat (J/kg.k) R-Value Concrete tiles 0.04 0.061 2100 837 0.65 Sand 0.02 0.35 2080 840 0.05 Dirt 0.14 0.064 1500 1260 2.18 Insulation board 0.05 0.035 24 1210 1.42 Asphalt 0.02 0.74 2110 920 0.02 Concrete 0.08 2.15 2400 900 0.03
Hollow core slab 0.15 2.15 2400 900 0.06
Total 0.50 4.41
Table 6
Energy cost calculation in Iraq (Ministry of Electricity, 2014a). Energy consumption
(kWh)
Value (Iraqi Dinar per kWh)
Value (USD per kWh) 1–1000 10 0.008 1001–2000 20 0.017 2001–4000 30 0.025 4001 and above 50 0.042 0 50 100 150 200 250 300 350 Heang Energy (kWh)
Living Room Guest Room BedRoom3 Corridor2 BedRoom4 BedRoom2 BedRoom1
an efficiency of 37.32% for the IBS system compared to the conventional. As for December, the consumption recorded the maximum with a difference around 654 kWh as shown
inFig. 13and the efficiency was 51.21% for the IBS model. On the other hand, comparing the energy needed for cool-ing, the difference between the two systems was 0 200 400 600 800 1000 1200 1400
Living Room Guest Room BedRoom3 Corridor2 BedRoom4 BedRoom2 BedRoom1
Figure 10. Cooling energy consumption for the conventional system in a year.
Table 8
Cooling energy consumption for each zone in the conventional system (year). Cooling energy (kWh)
Living room Guest room Bed room1 Bed room2 Bed room3 Bed room4 Corridor 2 Total
Max 335.45 302.08 263.2 257.68 518.23 568.1 1307.04 3551.78
Mean 119.78 107.07 99.08 88.9 199.76 222.64 532.99 1370.22
Min 0 0 0 0 0 0 0 0
Annual sum (year) 1437.38 1284.83 1189 1066.81 2397.16 2671.68 6395.87 16442.73
0 20 40 60 80 100 120 140 Heang Energy (kWh)
Living Room Guest Room BedRoom3 Corridor2 BedRoom4 BedRoom2 BedRoom1
Table 9
Heating energy consumption for each zone in the IBS (year). Heating energy (kWh)
Living room Guest room Bed room1 Bed room2 Bed room3 Bed room4 Corridor 2 Total
Max 125.63 103.13 74.17 89.66 83.16 71.06 76.19 623
Mean 29.40 22.27 16.85 21.14 14.41 12.28 10.77 127.15
Min 0 0 0 0 0 0 0 0
Annual sum (Year) 352.81 267.24 202.24 253.79 172.99 147.45 129.31 1525.83
0 100 200 300 400 500 600 700 Cooling Energy (kWh)
Living Room Guest House BedRoom3 Corridor2 BedRoom4 BedRoom2 BedRoom1
Figure 12. Cooling energy consumption for the IBS in a year.
Table 10
Cooling energy consumption for each zone in the IBS (year). Cooling energy (kWh)
Living room Guest room Bed room1 Bed room2 Bed room3 Bed room4 Corridor 2 Total
Max 79.45 41.2 40.7 36.87 189.55 178.89 656.69 1223.35
Mean 23.97 11.31 13.87 11.63 67.78 64.8 281.24 474.6
Min 0 0 0 0 0 0 0.1 0.1
Annual sum (Year) 287.6 135.76 166.43 139.61 813.33 777.61 3374.85 5695.19
(a) (b) 0 500 1000 1500 2000 2500 3000 3500 4000 Cooling Energy (kWh)
Convenonal System IBS 0 200 400 600 800 1000 1200 1400 Heang Energy (kWh)
Convenonal System IBS
system. As for the month July, the difference was 2328.43 kWh, which was efficient of 65.56% for the IBS system.
Comparing both energy demands for cooling and heat-ing for the two models shows a significant savheat-ing in energy for the IBS. The findings show that the conventional sys-tem required 19,311.99 kWh annually while the IBS syssys-tem required 7374.57 kWh for the year 2013. This indication shows that the saving in energy has reached 61% for the cooling and heating loads. Table 11 tabulates the total energy consumption in each system and each floor.
4.3. Estimation cost of energy consumption in both systems
Table 12 shows the values of heating cost for the con-ventional system. The total cost was found to be $40.56 (USD). The results indicate that only January and Decem-ber have a significant consumption while February, March and November were almost zero. The highest cost recorded was $21.94 (USD) in December. As for cooling, it was found that the total energy cost was $390.98 (USD) as shown in Table 13. In fact, energy cost was almost sig-nificant in the entire year except for winter which is 4 months (January, February, November and December). The highest cost recorded was $91.53 (USD) in July.
On the other hand, measuring the heating cost for the IBS system, the total cost was found to be $13.11 (USD) as shown inTable 14. The energy cost shows a significant reduction in only January and February. The maximum cost recorded was $5.35 (USD) in December. However Table 12
Heating energy cost for the conventional system.
Month Energy (kWh) Price (ID) Price (USD)
January 1009.61 20,192 17.35 February 128.43 1284 1.10 March 1.54 15 0.01 April 0 – – May 0 – – June 0 – – July 0 – – August 0 – – September 0 – – October 0 – – November 18.09 181 0.16 December 1277 25,540 21.94 Total 2434.67 47,213 40.56
Month Energy (kWh) Price (ID) Price (USD)
January 0 – – February 21.02 210 0.18 March 377.48 3775 3.24 April 1107.87 22,157 19.03 May 2003.37 60,101 51.63 June 2866.86 86,006 73.88 July 3551.78 106,553 91.53 August 3149.98 94,499 81.18 September 2410.74 72,322 62.13 October 849.5 8495 7.30 November 102.96 1030 0.88 December 1.17 12 0.01 Total 16,442.73 455,161 390.98 Table 14
Heating energy cost for the IBS system.
Month Energy (kWh) Price (ID) Price (USD)
January 558.6 5586 4.8 February 185.34 1853 1.59 March 44.01 440 0.38 April 0.3 3 0 May 0 – – June 0 – – July 0 – – August 0 – – September 0 – – October 12.26 123 0.11 November 102.32 1023 0.88 December 623 6230 5.35 Total 1525.83 15,258 13.11 Table 15
Cooling energy cost for the IBS system.
Month Total Price (ID) Price (USD)
January 0.1 1 0.00 February 24.88 249 0.21 March 154.65 1547 1.33 April 392.59 3926 3.37 May 689.5 6895 5.92 June 996.28 9963 8.56 July 1223.35 24,467 21.02 August 1056.06 21,121 18.14 September 793.23 7932 6.81 October 301.57 3016 2.59 November 58.9 589 0.51 December 4.08 41 0.04 Total 5695.19 79,746 68.50
for the cooling cost calculation, the IBS system presented a considerable reduction during the entire year except for the winter time (January, February, March, November and December) as shown inTable 15. The highest cost recorded was 21.02 USD in July.
5. Conclusion
The paper presents an evaluation study of the energy effi-ciency approach in several construction systems. The study targeted two structural systems, namely, the conventional building system (load baring brick walls with concrete roof slab) and industrialized building system (prefabricated steel skeletal structure with polyurethane sandwich panels and hollow core slabs). The objectives were to find out the effi-ciency of energy consumption for both systems. The find-ings showed that the IBS has the ability to reduce energy demand for heating and cooling compared to the conven-tional system. In addition, the saving in energy was accom-panied with a significant saving in energy cost.
After comparing the results of the two systems, it was found that the annual energy needed for cooling and heat-ing for the conventional system was around 19,311.99 kWh while the IBS system performing efficiently with 7374.57 kWh. This indication shows that the IBS system reduces the energy required for heating about 37.32% while for cooling by 65.36% in the annual energy need. As a result, the saving in energy reached 61% for the cooling and heating energies during the year. On the other hand, when the energy cost was calculated, the results show that the conventional house consumed $431.54 per annum while the IBS was $81.61 per annum. The difference in annual saving was $349.93 which was achieved in the IBS system. These findings show that energy efficiency of industrial-ized building system is significantly better than convention-al system during the year in Iraq. At the end, this research will help architects and building owners to increase their awareness for achieving energy efficiency particularly in Iraqi residential buildings.
References
Abod, A.A., Hussain, D.A.M., A-Khafaji, D.A.M., 2011. Building performance a study for evaluate prefabricated residential buildings performance. Iraqi J. Archit. 7, 255–277.
Affef, B. 2013. Ministry of housing employ the prefabricated building system to solve the housing crisis [Online]. RFE/RL, Inc 2014. Available: <http://www.iraqhurr.org/content/article/25165777.html> [accessed 23 March 2014].
Ahmed, A.Z., 2006. Energy in Buildings: Sustainable Symbiosis, Univer-sity Publication Centre (UPENA). UiTM.
Aktacir, M.A., Bu¨yu¨kalaca, O., Yılmaz, T., 2010. A case study for influence of building thermal insulation on cooling load and air-conditioning system in the hot and humid regions. Appl. Energy 87 (2), 599–607. Alaamery, H.A., 2008. The current energy generation in Basra and the
future prospects. J. Manage. Stud. 2, 195–224.
Ali, K.A., 2013. Electric energy generation industry in Basra city. Al-Bahith J. 3, 373–391.
Al-Ansari, B., 2009. Housing – The Reality and the Planning. Require-ments to Promote the Housing Sector in Iraq. Iraqi Institute for Economic Reform, Iraq, Baghdad.
Al-Obaidi, K.M., Ismail, M., Rahman, A.M.A., 2013. A review of skylight glazing materials in architectural designs for a better indoor environment. Mod. Appl. Sci. 8 (1), P68.
Al-Obaidi, K.M., Ismail, M., Rahman, A.M.A., 2014a. A comparative study between unvented and vented attics powered by the hybrid turbine ventilator in Malaysian houses. Int. J. Sustain. Energ., 1–13 [Epub ahead of print]
Al-Obaidi, K.M., Ismail, M., Rahman, A.M.A., 2014b. Investigation of passive design techniques for pitched roof systems in the tropical region. Mod. Appl. Sci. 8 (3), P182.
Alsammarae, A., 2005. Electric power 2005. Minister of electricity, Iraq. Available: <http://trade.gov/static/iraq_electricalppt.pdf> [accessed 4,May 2014].
Al-Shok, I.I., 2009. Iraqi Housing Sector Realities and the Future Vision to Promote it. The Requirements Needed to Promote the Iraqi housing Sector. Iraqi Institution for Economic Reform, Iraq, Baghdad. Bismayah. 2014. [Online]. Bismayah news. Available: <
http://www.bis-mayah.org/english/pages/04newspr/news.asp> [accessed 4,May 2014]. Daly, D., Cooper, P., Ma, Z., 2014. Understanding the risks and
uncertainties introduced by common assumptions in energy simula-tions for Australian commercial buildings. Energy Build. 75, 382– 393.
EERE. 2013. About EnergyPlus [Online]. U.S Department of Energy. Available: < http://apps1.eere.energy.gov/buildings/energyplus/ener-gyplus_about.cfm> [accessed 21, February 2014].
EERE. 2014. Office of energy efficiency and renewable energy: About Us [Online]. Washington U.S Department of Energy. Available: <http:// www.energy.gov/> [accessed 21, February 2014].
Jasem, N.A., Yahya, A.E., Kharufa, S.N., 2008. Thermal simulation of custom designed house to test application of new cooling methods. Iraqi J. Archit. 4B, 62–75.
Graham, P., 2003. Building Ecology: First Principles for a Sustainable Built Environment. Wiley.
Granadeiro, V., Duarte, J.P., Correia, J.R., Leal, V., 2013. Building envelope shape design in early stages of the design process: integrating architectural design systems and energy simulation. Autom. Constr. 32, 196–209.
Harvey, L.D.D., 2006. A Handbook on Low-Energy Buildings and District-Energy Systems: Fundamentals, Techniques and Examples. Routledge.
Hasan, A.A., 2012. Available ways for energy conservation in Iraqi residence sector. Alrafidain Univ. Collage Sc. J., 32–50
Henninger, R. H., Witte, M. J., Crawley, D. B. 2003. Experience testing EnergyPlus with the IEA HVAC BESTest E100–E200 Series. In: Proceedings of Building Simulation 2003.
IIER, 2009. The Requirements Needed to Promote the Housing Sector in Iraq [Online]. Iraqi Institute for Economic Reform, Baghdad, Iraq. Available: http://www.iier.org/i/page_content.php?lang=ar& menu_id=&smenu_id=145[accessed 4,May 2014].
Kadury, J.I., 2010. Thermal insulation of building materials. Diyala J. Eng. Sci. 3, 28–44.
Kharrufa, S.N., Adil, Y., 2012. Upgrading the building envelope to reduce cooling loads. Energy Build. 55, 389–396.
Mian, A. T. E. 2006. Industrialized Building System Formation Schedul-ing for Pubic BuildSchedul-ings Master. Masters thesis, Universiti Teknologi Malaysia.
Ministry of Electricity, 2014a. Energy cost [Online]. Iraqi Ministry of Energy, Iraq, Baghdad. Available:http://www.moelc.gov.iq/ar/index. php?name=Pages&op=page&pid=114[accessed 18, April 2014]. Ministry of Electricity, 2014b. Statistical Data [Online]. Iraqi Ministry of
Electricity. Available: http://www.moelc.gov.iq/ar/index.php?name= Pages&op=page&pid=129[accessed 5, April 2014].
Mohee, M., 2009. The role of the modular prefabricated system in the fast production of housing units. Eng. Dev. 13, 18–25.
tions. In American Control Conference (ACC), IEEE, 2010 (pp. 5100– 5105).
Rahman, A.M.A., Rahim, A., Al-Obaidi, K., Ismail, M., Mui, L.Y., 2013. Rethinking the Malaysian affordable housing design typology in view of global warming considerations. J. Sustainable Dev. 6 (7). Roadmap Review (Final Report).2007. IBS Centre, Construction Industry
Development Board, Malaysia, Kuala Lumpur (unpublished). Ruukki. 2014. Sandwich panel SP2D PU for external wall. Available:
http://www.ruukki.com/Products-and-solutions/Building-solutions/ Sandwich-panels/Basic-sandwich-panels-for-walls-and-roofs/Sand-wich-panel-SP2D-PU-for-external-wall[accessed 21, May 2014]. Su, Y., Riffat, S.B., Pei, G., 2012. Comparative study on annual solar
energy collection of a novel lens-walled compound parabolic concen-trator (lens-walled CPC). Sustainable Cities Soc. 4, 35–40.
Tabares-Velasco, P.C., Christensen, C., Bianchi, M., Booten, C., 2012. Verification and validation of EnergyPlus conduction finite difference and phase change material models for opaque wall assemblies. Contract 303, 275–3000.
Weather Analytics. 2014. Weather and Climate Data: simulation and modeling files [Online]. Weather Analytics Available: http://www. weatheranalytics.com/weather-products/simulation-and-modeling/ [accessed 21, February 2014].
Wail, N.A.-R., 2010. Structural behaviour of ferrocement system for roofing. Diyala J. Eng. Sci., 237–248, Engineering Sc. Conference. Weather Online. 2014. Climate of the World: Iraq [Online]. 1999-2014
Weather Online Ltd. Available: http://www.weatheronline.co.uk/re-ports/climate/Iraq.htm[accessed 20, March 2014].
Witte, M. J., Henninger, R. H., Crawley, D. B. 2004. Experience testing EnergyPlus with the ASHRAE 1052-RP building fabric analytical tests. In: Proceedings of the SimBuild 2004, 4–6.
Xu, X., Zhao, Y., 2010. Some Economic Facts of the Prefabricated Housing. Industry Report, Rutgers Business School, Newark, NJ. Zhao, J., Lam, K. P., Ydstie, B. E. 2013. EnergyPlus model-based predictive
control (EPMPC) by using matlab/simulink and MLE. In: Proceedings of BS2013: 13th Conference of International Building Performance Simulation Association, Chambe´ry, France, August 26–28.