Research Article
Adaptive Neuro-Fuzzy Inference System for Classification of
Background EEG Signals from ESES Patients and Controls
Zhixian Yang,
1Yinghua Wang,
2,3and Gaoxiang Ouyang
2,31Department of Pediatrics, Peking University First Hospital, No. 1 of Xian Men Street, Xicheng District, Beijing 100034, China 2State Key Laboratory of Cognitive Neuroscience and Learning and IDG/McGovern Institute for Brain Research,
Beijing Normal University, Beijing 100875, China
3Center for Collaboration and Innovation in Brain and Learning Sciences, Beijing Normal University, Beijing 100875, China
Correspondence should be addressed to Gaoxiang Ouyang; [email protected] Received 13 December 2013; Accepted 18 March 2014; Published 25 March 2014 Academic Editors: J. Tang and H. Zhou
Copyright © 2014 Zhixian Yang et al. This is an open access article distributed under the Creative Commons Attribution License, which permits unrestricted use, distribution, and reproduction in any medium, provided the original work is properly cited. Background electroencephalography (EEG), recorded with scalp electrodes, in children with electrical status epilepticus during slow-wave sleep (ESES) syndrome and control subjects has been analyzed. We considered 10 ESES patients, all right-handed and aged 3–9 years. The 10 control individuals had the same characteristics of the ESES ones but presented a normal EEG. Recordings were undertaken in the awake and relaxed states with their eyes open. The complexity of background EEG was evaluated using the permutation entropy (PE) and sample entropy (SampEn) in combination with the ANOVA test. It can be seen that the entropy measures of EEG are significantly different between the ESES patients and normal control subjects. Then, a classification framework based on entropy measures and adaptive neuro-fuzzy inference system (ANFIS) classifier is proposed to distinguish ESES and normal EEG signals. The results are promising and a classification accuracy of about 89% is achieved.
1. Introduction
Encephalopathy with electrical status epilepticus during slow-wave sleep (ESES) syndrome is a condition charac-terized by continuous spikes and waves occurring during
sleep [1]. The recent literature refers to it as “ESES
syn-drome,” which is an age-related reversible disorder with onset at around 4-5 years of age and a generally favorable
course with disappearance at around 10–15 years of age [2],
usually associated with variable cognitive and behavioral
impairments [3,4]. The pathophysiological mechanisms and
neuropsychological deficits associated with this condition
are still poorly understood [5]. Therefore, it is important to
identify the ESES patients as early as possible such that the clinician can prescribe the necessary medication to stop its progression.
The electroencephalograph (EEG) signal is a measure of the summed activities of approximately 1–100 million neurons lying in the vicinity of the recording electrode. Since it may provide insight into the functional structure and
dynamics of the brain [6], exploration of hidden dynamical
structures within EEG signals is of both basic and clinical
interest and has attracted more and more attention [7–9]. One
can assume that the EEG is a signal containing information about the condition of the brain. We can also accept as working hypothesis that the EEG recorded under resting
conditions is representative of the global state of the brain [10,
11]. Then, a plausible working hypothesis is that background
EEG corresponding to healthy controls is different from that corresponding to patients with pathologies (e.g., ESES). However, it is currently accepted that a human observer hardly discriminates EEG traces of healthy controls from those of ESES subjects. Quantitative EEG analysis using computational methods can therefore assist in the back-ground EEG characterization. The EEG pattern classification scheme usually includes two major parts: feature extraction and classification.
Various methods have been widely used for feature extraction ranging from traditional linear methods such
Volume 2014, Article ID 140863, 8 pages http://dx.doi.org/10.1155/2014/140863
as Fourier transforms and spectral analysis [12] to
nonlin-ear methods such as Lyapunov exponents [13], correlation
dimension [14], and similarity [15,16]. Due to the complex
interconnections between billions of neurons, the recorded EEG signals are complex, nonlinear, nonstationary, and random in nature. Therefore, the classification of EEG signals using nonlinear methods that detect and quantify nonlinear mechanisms and thereby better reflect the characteristics of the EEG signals. Nonlinear features may be able to unearth the hidden complexities existing in the EEG time series. Ferri et al. applied the nonlinear cross-prediction test to assess the dynamic properties of the EEG and showed that ESES, like other types of epileptic EEG activities, seems to reflect highly nonlinear and possibly low-dimensional dynamics, whereas non-ESES waking EEG seems to correspond with
linear stochastic dynamics [17]. In the recent years, a series
of entropy-based approaches have been widely used since they can quantify the complexity (regularity) of an EEG
signal [18,19]. The entropy of the EEG may act as a reliable
indicator of changes in cortical neuronal interactions and
truly reflect the intracortical information flow [20], and thus
the term “entropy” may be more than merely a statistical measure of EEG patterns, which are well exploited using entropies, and it helps in providing distinguishable variation
for normal and abnormal biomedical signals [21,22]. Ab´asolo
et al. applied the approximate entropy (ApEn) to analyse the EEG background activity of Alzheimer’s disease (AD) patients and age-matched controls. They found that ApEn is significantly lower in the AD patients at electrodes P3 and P4
[23]. Then, the spectral entropy (SpecEn) and sample entropy
(SampEn) were used to analyse the EEG background activity of AD patients and showed that AD patients have significantly lower SampEn values than control subjects at electrodes P3, P4, O1, and O2 but no differences between AD patients
and control subjects’ EEGs with SpecEn [24]. Burioka
et al. found that the ApEn values of EEG signals in absence epilepsy during seizure-free intervals are very similar to those of healthy subjects, but the EEG signals in absence epilepsy during seizure intervals produce significant lower ApEn
values than healthy subjects [25]. In the study by Kannathal
et al., ApEn was used to investigate the epileptic seizure detection, where three other entropy-based features were extracted and combined with ApEn for studying normal and
epileptic EEG signals [26]. A novel feature extraction method
based on ApEn, SampEn, and phase entropy was proposed for diagnosing the epileptic EEG signals and showed that the extracted features with fuzzy classifier are able to differentiate
the EEGs with a high accuracy [27]. The high identification
accuracy was also reported in the study by Song et al. [28],
in which they developed a new scheme of automatic epileptic seizure detection on the basis of SampEn feature extraction.
Recently, Bandt and Pompe proposed the permutation entropy (PE) method to measure the irregularity
(complex-ity) of nonstationary time series [29]. The basic idea is to
consider order relations between the values of a time series rather than the values themselves. Compared with ApEn
and SampEn [21, 22], the advantages of the PE method
are its simplicity, low complexity in computation without further model assumptions, and robustness in the presence
of observational and dynamical noise [29–31]. Cao et al.
used PE to identify various phases of epileptic activity in the intracranial EEG signals recorded from three patients
suffering from intractable epilepsy [32]. Li et al. used PE as
a feature to predict the absence seizures in genetic absence epilepsy rats and showed a sharp PE drop after the seizures
[33]. It was also found that the PE can better extract the
pattern of EEG data for the prediction of absence seizure than the SampEn measure. Nicolaou and Georgiou investigated the use of PE as a feature for automated epileptic seizure
detection [34]. Bruzzo et al. applied PE to detect vigilance
changes and the preictal phase from scalp EEG in three
epileptic patients [35]. These results showed that the EEG
during epileptic seizures is characterized by a lower value of PE than the normal EEG. It was found that there is a good separability between the seizure-free phase and the preseizure phase and the changes of PE values during the preseizure phase and seizure onset coincide with changes in vigilance
state [35].
In terms of classifiers, lots of methodologies have been proposed and applied to process and discriminate biomedical
signals [36–38], such as electromyography [39,40] and EEG
signals [41,42]. In particular, artificial neural networks have
been utilized as the most common method for classifying the EEGs. Moreover, fuzzy set theory plays an important role in dealing with uncertainty when making decisions in medical applications. Therefore, fuzzy sets have attracted the growing attention and interest in data analysis, decision
making, pattern recognition, diagnostics, and so forth [43,
44]. Neuro-fuzzy systems are fuzzy systems which use ANNs
theory in order to determine their properties (fuzzy sets
and fuzzy rules) by processing data samples [45]. A specific
approach in fuzzy development is the adaptive neuro-fuzzy inference system (ANFIS), which has shown significant results in classification of EEG signals. Kannathal et al. proposed a novel classification framework based on entropy measures and ANFIS classifier to distinguish normal and
epileptic EEG signals [26]. G¨uler and ¨Ubeyli proposed a
new scheme using ANFIS and wavelet transform as the classifier, which can identify five types of EEG signals with
a recognition rate greater than 98% [45]. ¨Ubeyli proposed
a system using Lyapunov exponents of EEG signals and ANFIS as the classifier, which can identify these five types of
EEG signals with a recognition rate greater than 99% [46].
In the study by Yildiz et al. [47], a wavelet entropy-ANFIS
framework is proposed for classifying a state of vigilance as alert, drowsy, or sleep state on an ongoing EEG recording. A classification accuracy of more than 98% is achieved. These results show that ANFIS has potential in classifying the EEG signals.
In this study, a new approach based on ANFIS employing PE and SampEn measures was presented for classification of background EEG signals from ESES patients and controls. The proposed technique involved training the two ANFIS classifiers to classify the two classes of the EEG signals when PE and SampEn of the EEG signals were used as inputs. The goal was to find a clear differentiation between background EEG corresponding to a sample set of ESES patients and that corresponding to healthy control individuals. The paper is
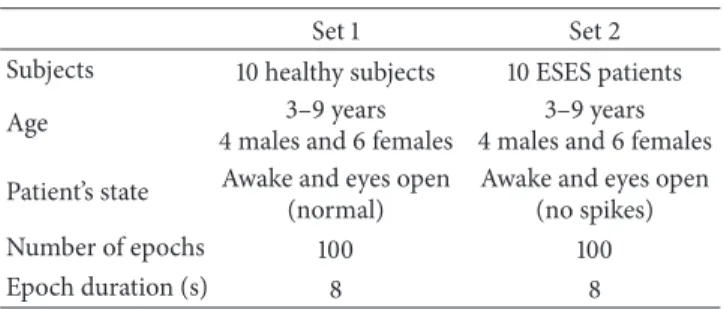
Table 1: Summary of the EEG data.
Set 1 Set 2
Subjects 10 healthy subjects 10 ESES patients
Age 3–9 years
4 males and 6 females
3–9 years 4 males and 6 females Patient’s state Awake and eyes open
(normal)
Awake and eyes open (no spikes)
Number of epochs 100 100
Epoch duration (s) 8 8
organized as follows.Section 2presents a description of the
data used in this work and briefly describes the extracted
features and classifiers that were used.Section 3presents the
results obtained. Finally, conclusions are given inSection 4.
2. Materials and Methods
2.1. EEG Data. The EEG data used in this study consists of two different sets. The first set includes EEG recordings that were collected from 10 right-handed healthy subjects. The subjects were awake and relaxed with their eyes open. 100 16-channel EEG epochs of 8 s duration were selected and cut out from each continuous EEG recording after visual inspection for artifacts, for example, due to muscle activity or eye movements. The second set was obtained from 10 patients with ESES, all right-handed. The data set consists of EEG recordings during wakeful state. Similar to healthy data, noise-free segments are selected from the EEG recordings with ESES patients and used for the analysis. All EEG data were recorded by the Nihon Kohden digital video EEG system from a standard international 10–20-electrode placement (Fp1, Fp2, F3, F4, C3, C4, P3, P4, O1, O2, F7, F8, T3, T4, T5, and T6). They were sampled at a frequency of 500 Hz using a 16-bit analogue-to-digital converter and filtered within a frequency band from 0.5 to 35 Hz.
The study protocol had previously been approved by the Ethics Committee of Peking University First Hospital and the patients had signed informed consent that their clinical data might be used and published for research purposes. A
summary of the data set is given inTable 1. A sample of EEG
epochs from each of the two data sets is plotted inFigure 1.
2.2. Sample Entropy. Sample entropy (SampEn) is an
algo-rithm derived from approximate entropy (ApEn) [21].
Intro-duced by Pincus et al. [48], ApEn is a technique that is
useful in determining changing system complexity and it
finds application in biomedical research [49]. The first step in
computing ApEn of an EEG series{𝑥1, 𝑥2, . . . , 𝑥𝑁}is to form
a sequence of vectors𝑋1, 𝑋2, . . . , 𝑋𝑁−𝑚+1in𝑅𝑚, defined by
𝑋𝑖 = [𝑥𝑖, 𝑥𝑖+1, . . . , 𝑥𝑡+𝑚−1]and 𝑋𝑗 = [𝑥𝑗, 𝑥𝑗+1, . . . , 𝑥𝑗+𝑚−1].
Next, we define, for each𝑖,
𝐶𝑚𝑖 (𝑟) = 𝑁 − 𝑚 + 1𝑖 ∑
𝑗=1𝜃 (𝑟 − 𝑑 (𝑋𝑖, 𝑋𝑗)) , (1)
where𝜃is the standard Heaviside function and𝜃(𝑥) = 1for
𝑥 > 0, 𝜃(𝑥) = 0, otherwise;𝑟is a tolerance threshold and
𝑑(𝑋𝑖, 𝑋𝑗)is a distance measure defined by
𝑑 (𝑋𝑖, 𝑋𝑗) =max(𝑥𝑖+𝑘−1− 𝑥𝑗+𝑘−1) , 𝑘 = 1, 2, . . . , 𝑚. (2) Then, we define𝜙𝑚(𝑟)as 𝜙𝑚(𝑟) = 1 𝑁 − 𝑚 + 1 𝑁−𝑚+1 ∑ 𝑖=1 log𝐶𝑖𝑚(𝑟) . (3)
For fixed𝑚and𝑟, ApEn is given by the following formula:
ApEn(𝑚, 𝑟, 𝑁) = 𝜙𝑚(𝑟) − 𝜙𝑚+1(𝑟) (4) which is basically the logarithmic likelihood that runs
of patterns of length𝑚that are close (within𝑟) will remain
close on next incremental comparisons. The more regular the EEG is, the smaller the ApEn will be. The exact value of the
ApEn(𝑚, 𝑟, 𝑁) will depend on three parameters:𝑁(length of
the time series),𝑚(length of sequences to be compared), and
𝑟(tolerance threshold for accepting matches).
The ApEn specifies a tolerance threshold and so may be better than spectral entropy in the quantification of
complexity of EEG recording [50]. The disadvantage of ApEn
is that it is heavily dependent on the record length and is often lower than expected for short records. Another disadvantage
is that ApEn lacks relative consistency [21]. To overcome
the disadvantages of ApEn, a sample entropy (SampEn) was proposed to replace ApEn. By excluding self-matches
[21], SampEn reduces the computing time by one-half in
comparison with ApEn. Another advantage of SampEn is that it is largely independent of record length and displays relative
consistency [51]. The key idea that differentiates SampEn
from ApEn is using the correlation sum𝐶𝑚(𝑟)in the entropy
definition instead of the 𝜙𝑚(𝑟) functions defined in (3)—
practically, the position of the log function changes. Thus, Richman and Moorman defined sample entropy as
SampEn(𝑚, 𝑟, 𝑁) =log 𝐶
𝑚(𝑟)
𝐶𝑚+1(𝑟). (5)
The choice of input parameters has been discussed by
Pincus and Goldberger in [52]. They concluded that, for𝑚 =
2, values of𝑟from 0.1 to 0.25 SD (the standard deviation of
the signal) produce good statistical validity of SampEn. In this
study, SampEn was estimated with𝑚 = 2and𝑟 = 0.2 ×SD of
the EEG epoch.
2.3. Permutation Entropy. Bandt and Pompe proposed a new permutation method to map a continuous time series onto a
symbolic sequence [29], where the statistics of the symbolic
sequences was called permutation entropy (PE). PE refers to the local order structure of the time series, which can give a quantitative complexity measure for a dynamical time
series [53]. Given a time series{𝑥1, 𝑥2, . . . , 𝑥𝑁}, an embedding
procedure was used to generate 𝑁 − (𝑚 − 1)𝑙 vectors
Fp1 Fp2 F3 F4 C3 C4 P3 P4 O1 O2 F7 F8 T3 T4 T5 T6 (a) 1s 40uv (b)
Figure 1: Sample EEG epochs from both ESES patient (a) and control subject (b).
with the embedding dimension𝑚and the lag𝑙. The vector
𝑋𝑡can be rearranged in an ascending order as[𝑥𝑡+(𝑗1−1)𝑙 ≤
𝑥𝑡+(𝑗2−1)𝑙. . . ≤ 𝑥𝑡+(𝑗𝑚−1)𝑙]. For 𝑚 different numbers, there
will be 𝑚!possible order patterns𝜋, which are also called
permutations. Then, we can count the occurrences of the
order pattern𝜋𝑖, which is denoted as𝐶(𝜋𝑖),𝑖 = 1, 2, . . . 𝑚!. Its
relative frequency is calculated by𝑝(𝜋) = 𝐶(𝜋)/(𝑁−(𝑚−1)𝑙).
The PE is defined as PE= − 𝑚! ∑ 𝑚=1𝑝 (𝜋) ln𝑝 (𝜋) . (6)
The largest value of PE is log(𝑚!), which means that the
time series is completely random; the smallest value of PE is zero, indicating that the time series is very regular. More
details can be found in [29].
PE calculation depends on the selection of dimension𝑚
and lag𝑙. When 𝑚 is too small (less than 3), the scheme
will not work well since there are only a few distinct states for EEG recordings. On the other hand, the length of EEG
recording should be larger than 𝑚 in order to achieve a
proper differentiation between stochastic and deterministic
dynamics [31]. In order to allow every possible order pattern
of dimension𝑚to occur in a time series of length𝑁, the
condition𝑚! ≤ 𝑁 − (𝑚 − 1)𝑙must hold. Moreover,𝑁 ≫
𝑚! + (𝑚 − 1)𝑙is required to avoid undersampling [54]. In
this study, we therefore choose the dimension𝑚 = 5when
calculating PE. The lag𝑙is referred to as the number of sample
points spanned by each section of the vector. The importance of the lag is that it gives the resultant fraction characteristics of the vector. In practice, an autocorrelation function (ACF) of a signal can be employed to automated determination of
the lag𝑙. An optimal lag can be found at the point where the
ACF has firstly decayed to𝑒−1of its peak value [55].
2.4. Adaptive Neuro-Fuzzy Inference System. The ANFIS
described by Jang [56] is adopted to evaluate the ability
and effectiveness of the above entropy measures in classify-ing the EEG from the ESES patients and control subjects. The ANFIS learns features in the data set and adjusts the system parameters according to a given error criterion. It has been widely used in analysing the biological signals. In order to improve the generalization, ANFIS classifiers are trained with the backpropagation gradient descent method in combination with the least squares method. In this study, two ANFIS classifiers are trained with the backpropagation gradient descent method in combination with the least squares method when 16 features (dimension of the extracted feature vectors; entropy measures from 16-channel EEG) are used as inputs. The samples with target outputs ESES patients and control subjects are given the binary target values of (1, 0) and (0, 1), respectively. The fuzzy rule architecture of the ANFIS classifiers was designed by using a generalized bell-shaped membership function defined as follows:
𝜇𝑗𝑖(𝑥𝑖) = (1 + [𝑥𝑖− 𝑐𝑗𝑖 𝑎𝑗𝑖 ] 2𝑏𝑗𝑖 ) −1 , (7)
where(𝑎𝑗𝑖, 𝑏𝑗𝑖, 𝑐𝑗𝑖)are adaptable parameters.
Next, two first-order Sugeno-type ANFIS models with 16 inputs and one output are implemented. The first-order Sugeno fuzzy models have rules of the following form:
𝑅𝑖: IF(𝑥1 is 𝑈𝑖1⋅ ⋅ ⋅ 𝑥𝑚 is𝑈𝑖𝑚)
THEN𝑦is𝑔𝑖(𝑥1, . . . 𝑥𝑚) = 𝑏0+ 𝑏1𝑥1+ ⋅ ⋅ ⋅ + 𝑏𝑚𝑥𝑚, (8)
where𝑅𝑖is the𝑖th rule of the fuzzy system,𝑥𝑖 (𝑖 = 1, . . . , 𝑚)
3.8 4 4.2 4.4 4.6 4.8 ESES patients Normal Channel Fp 1 Fp 2 F3 F4 C3 C4 P3 P4 O 1 O 2 F7 F8 T3 T4 T5 T6 Pe rm ut at io n en tr op y
Figure 2: The averaged PE on channel of all EEG recordings, grouped by ESES patients and normal control subjects. Symbols represent the mean values of PE for each group and bars represent the standard error.
fuzzy system;𝑏𝑖 (𝑖 = 0, 1, . . . , 𝑚)are adaptable parameters.
The ANFIS output is given by
𝐹 = ∑𝑗𝑔𝑗(𝑎1, 𝑎2, . . . , 𝑎𝑚) Π𝑖𝜇𝑈𝑗𝑖(𝑎𝑖)
∑𝑗Π𝑖𝜇𝑈𝑗𝑖(𝑎𝑖) , (9)
where 𝜇𝑈𝑗𝑖(𝑎𝑖) is the degree of membership of 𝑎𝑖(𝑖 =
1, 2, . . . , 𝑚)to the antecedent linguistic term 𝑈𝑗𝑖 for the𝑖th rule of the fuzzy system. Each ANFIS classifier is imple-mented by using the MATLAB software package (MATLAB version 7.0 with fuzzy logic toolbox).
3. Results
3.1. Entropy Measures of EEG. EEG epochs from both ESES patients and normal control subjects are investigated in this study. First, PE is applied to analyse the EEG recordings, with
𝑚 = 5, for channels Fp1, Fp2, F3, F4, C3, C4, P3, P4, O1, O2, F7, F8, T3, T4, T5, and T6. The results have been averaged based on all the artefact-free 8 s epochs for each channel. The
averaged PEs of all channels are shown inFigure 2. Symbols
represent the mean values of PE for each group and bars represent the standard error. It can be found that the PE values of EEG epochs in normal control subjects are much
larger than those in ESES patients. The PE values (mean±
SD) for the control subjects and ESES patients and the 𝑃
values of the one-way ANOVA test performed to examine the
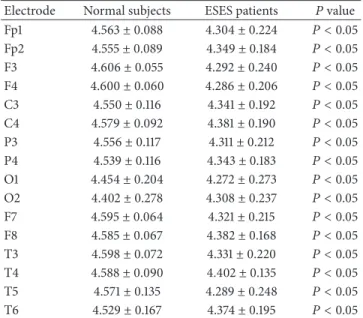
differences between both groups are summarized inTable 2.
It can be seen that ESES patients have significant lower PE values at all 16 electrodes. These results suggest that EEG activity of ESES patients is less complex (more regular) than in a normal control subject. This result supports the view that ESES, like other types of epileptic EEG activity, would reflect low complex and high nonlinear dynamics, whereas non-ESES waking EEG would correspond with high complex dynamics.
To compare the extracted entropy information of EEG between PE and SampEn methods, SampEn is estimated for
Table 2: The average PE values (mean±SD) of the EEGs for the normal control subjects and ESES patients for all channels.
Electrode Normal subjects ESES patients 𝑃value
Fp1 4.563±0.088 4.304±0.224 𝑃 < 0.05 Fp2 4.555±0.089 4.349±0.184 𝑃 < 0.05 F3 4.606±0.055 4.292±0.240 𝑃 < 0.05 F4 4.600±0.060 4.286±0.206 𝑃 < 0.05 C3 4.550±0.116 4.341±0.192 𝑃 < 0.05 C4 4.579±0.092 4.381±0.190 𝑃 < 0.05 P3 4.556±0.117 4.311±0.212 𝑃 < 0.05 P4 4.539±0.116 4.343±0.183 𝑃 < 0.05 O1 4.454±0.204 4.272±0.273 𝑃 < 0.05 O2 4.402±0.278 4.308±0.237 𝑃 < 0.05 F7 4.595±0.064 4.321±0.215 𝑃 < 0.05 F8 4.585±0.067 4.382±0.168 𝑃 < 0.05 T3 4.598±0.072 4.331±0.220 𝑃 < 0.05 T4 4.588±0.090 4.402±0.135 𝑃 < 0.05 T5 4.571±0.135 4.289±0.248 𝑃 < 0.05 T6 4.529±0.167 4.374±0.195 𝑃 < 0.05 1.9 2 2.1 2.2 2.3 ESES patients Normal Sa m ple en tr op y Channel Fp 1 Fp 2 F3 F4 C3 C4 P3 P4 O 1 O 2 F7 F8 T3 T4 T5 T6
Figure 3: The averaged SampEn on channel of all EEG recordings, grouped by ESES patients and normal control subjects. Symbols represent the mean values of SampEn for each group and bars represent the standard error.
channels Fp1, Fp2, F3, F4, C3, C4, P3, P4, O1, O2, F7, F8,
T3, T4, T5, and T6 with𝑚 = 2and 𝑟 = 0.2 ×SD of the
original data sequence. The averaged SampEns of all channels
are shown inFigure 3. It can be found that the SampEn values
of EEG epochs in normal control subjects are also larger than those in ESES patients. However, the SampEn values in control subjects and ESES patients are more overlapped than those of the PE values. Then, the SampEn values (mean
±SD) for the control subjects and ESES patients and the𝑃
values of the one-way ANOVA test performed to examine the
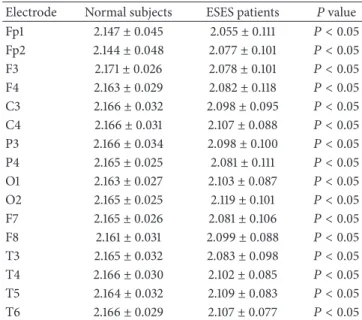
differences between both groups are summarized inTable 3.
It can be seen that ESES patients have significant lower SampEn values at all 16 electrodes.
Table 3: The average SampEn values (mean±SD) of the EEGs for the normal control subjects and ESES patients for all channels.
Electrode Normal subjects ESES patients 𝑃value
Fp1 2.147±0.045 2.055±0.111 𝑃 < 0.05 Fp2 2.144±0.048 2.077±0.101 𝑃 < 0.05 F3 2.171±0.026 2.078±0.101 𝑃 < 0.05 F4 2.163±0.029 2.082±0.118 𝑃 < 0.05 C3 2.166±0.032 2.098±0.095 𝑃 < 0.05 C4 2.166±0.031 2.107±0.088 𝑃 < 0.05 P3 2.166±0.034 2.098±0.100 𝑃 < 0.05 P4 2.165±0.025 2.081±0.111 𝑃 < 0.05 O1 2.163±0.027 2.103±0.087 𝑃 < 0.05 O2 2.165±0.025 2.119±0.101 𝑃 < 0.05 F7 2.165±0.026 2.081±0.106 𝑃 < 0.05 F8 2.161±0.031 2.099±0.088 𝑃 < 0.05 T3 2.165±0.032 2.083±0.098 𝑃 < 0.05 T4 2.166±0.030 2.102±0.085 𝑃 < 0.05 T5 2.164±0.032 2.109±0.083 𝑃 < 0.05 T6 2.166±0.029 2.107±0.077 𝑃 < 0.05
Table 4: Classification results with PE measure.
Desired result Output result
ESES patients Normal subjects
ESES patients 96 4
Normal subjects 18 82
3.2. Classification. As shown above, both PE and SampEn values of EEG were significantly different between ESES patients and normal control subjects. The performance of the above measures to discriminate among groups is also evaluated by means of ANFIS classifier, and 10-fold cross-validations are employed to demonstrate the accuracy of classification. First, the ability of the PE in classifying different EEG epochs is evaluated using the ANFIS. Two ANFIS clas-sifiers are trained with the backpropagation gradient descent method in combination with the least squares method when the calculated PE values are used as input. Each of the ANFIS classifiers is trained so that they are likely to be more accurate for one state of EEG signals than the other state. Samples with target outputs sets are given the binary target values of (1, 0) and (0, 1), respectively. Each ANFIS classifier is implemented by using the MATLAB software package (MATLAB version 7.0 with fuzzy logic toolbox). The classification results are
illustrated in Table 4. Of 200 EEG epochs in two groups,
178 are classified correctly. Only 4 normal EEG epochs are classified incorrectly by ANFIS as ESES EEG epochs and 18 ESES EEG epochs are classified as normal EEG epochs. The classification accuracy was 89.0%, which is defined as the percentage ratio of the number of epochs correctly classified to the total number of epochs considered for classification.
Then, in order to compare the classification accuracy of PE method with that of the SampEn method, the calculated SampEn values were used as the input data in the ANFIS classifiers, and 10-fold cross-validations were employed to
Table 5: Classification results with SampEn measure.
Desired result Output result
ESES patients Normal subjects
ESES patients 92 8
Normal subjects 28 72
demonstrate the performance of classification. The
classifica-tion results are listed inTable 5. Of 200 EEG epochs in two
groups, 164 were classified correctly. The total classification accuracy was 82.0%. Therefore, it is found that the PE mea-sures can provide a better separability between ESES patients and normal control subjects than the SampEn measures.
4. Conclusions
In this study, we have analysed the complexity characteristics in background EEG signals from ESES patients and controls using the entropy measures. Although the background EEG marked was indeed “normal” to standard visual inspection, the proposed methodology based on entropy measures, plus ANOVA statistical test, demonstrates that the background EEG in ESES patients does differ from that in controls. It can be seen that there is a significant increase of the calculated PE and SampEn values of the EEG epochs from ESES patients to control subjects. Then, a new approach based on ANFIS employing entropy measures was presented for classification of background EEG signals from ESES patients and controls. The two ANFIS classifiers were used to classify two classes of EEG epochs when the PE and SampEn of the EEG epochs were used as inputs. The experimental results showed that the classification accuracy, 89%, based on the PE measures is much higher than that with the SampEn measures, 82%. These results suggest that the proposed ANFIS combined with PE measures might be a potential tool to classify the background EEG from ESES patients and normal control subjects. Our next goal is to confirm the results presented here in a much larger clinical cohort of ESES patients.
Conflict of Interests
The authors declare that there is no conflict of interests regarding the publication of this paper.
Acknowledgments
This research was supported by National Natural Science Foundation of China (61025019, 61105027), Beijing Natural Science Foundation (4143063), the Fundamental Research Funds for the Central Universities, and the Peking-Tsinghua Center for Life Sciences.
References
[1] G. Patry, S. Lyagoubi, and C. A. Tassinari, “Subclinical “electrical status epilepticus” induced by sleep in children. A clinical and electroencephalographic study of six cases,” Archives of Neurology, vol. 24, no. 3, pp. 242–252, 1971.
[2] C. A. Tassinari, G. Rubboli, L. Volpi et al., “Encephalopathy with electrical status epilepticus during slow sleep or ESES syndrome including the acquired aphasia,”Clinical Neurophysiology, vol. 111, supplement 2, pp. S94–S102, 2000.
[3] F. B. J. Scholtes, M. P. H. Hendriks, and W. O. Renier, “Cognitive deterioration and electrical status epilepticus during slow sleep,”
Epilepsy and Behavior, vol. 6, no. 2, pp. 167–173, 2005.
[4] S. Raha, U. Shah, and V. Udani, “Neurocognitive and neurobe-havioral disabilities in epilepsy with electrical status epilepticus in slow sleep (ESES) and related syndromes,” Epilepsy and Behavior, vol. 25, pp. 381–385, 2012.
[5] M. Siniatchkin, K. Groening, J. Moehring et al., “Neuronal networks in children with continuous spikes and waves during slow sleep,”Brain, vol. 133, no. 9, pp. 2798–2813, 2010.
[6] G. Buzsaki,Rhythms of the Brain, Oxford University Press, Oxford, UK, 2006.
[7] R. A. Sarkis and J. W. Lee, “Quantitative EEG in hospital encephalopathy: review and microstate analysis,” Journal of Clinical Neurophysiology, vol. 30, pp. 526–530, 2013.
[8] W. Klimesch, P. Sauseng, and S. Hanslmayr, “EEG alpha oscillations: the inhibition-timing hypothesis,”Brain Research Reviews, vol. 53, no. 1, pp. 63–88, 2007.
[9] M. Scheltens-de Boer, “Guidelines for EEG in encephalopathy related to ESES/CSWS in children,”Epilepsia, vol. 50, no. 7, pp. 13–17, 2009.
[10] O. A. Rosso, A. Mendes, J. A. Rostas, M. Hunter, and P. Moscato, “Distinguishing childhood absence epilepsy patients from controls by the analysis of their background brain electri-cal activity,”Journal of Neuroscience Methods, vol. 177, no. 2, pp. 461–468, 2009.
[11] O. A. Rosso, A. Mendes, R. Berretta, J. A. Rostas, M. Hunter, and P. Moscato, “Distinguishing childhood absence epilepsy patients from controls by the analysis of their background brain electrical activity (II): a combinatorial optimization approach for electrode selection,”Journal of Neuroscience Methods, vol. 181, no. 2, pp. 257–267, 2009.
[12] Z. Rogowski, I. Gath, and E. Bental, “On the prediction of epileptic seizures,”Biological Cybernetics, vol. 42, no. 1, pp. 9– 15, 1981.
[13] L. D. Iasemidis, J. C. Sackellares, H. P. Zaveri, and W. J. Williams, “Phase space topography and the lyapunov exponent of electrocorticograms in partial seizures,”Brain Topography, vol. 2, no. 3, pp. 187–201, 1990.
[14] R. G. Andrzejak, K. Lehnertz, F. Mormann, C. Rieke, P. David, and C. E. Elger, “Indications of nonlinear deterministic and finite-dimensional structures in time series of brain electrical activity: dependence on recording region and brain state,”
Physical Review E: Statistical, Nonlinear, and Soft Matter Physics, vol. 64, no. 6, Article ID 061907, 2001.
[15] V. Navarro, J. Martinerie, M. Le van Quyen et al., “Seizure anticipation in human neocortical partial epilepsy,”Brain, vol. 125, no. 3, pp. 640–655, 2002.
[16] M. Niknazar, S. R. Mousavi, S. Motaghi, A. Dehghani, B. V. Vahdat, and M. B. Shamsollahi, “A unified approach for detection of induced epileptic seizures in rats using ECoG signals,”Epilepsy and Behavior, vol. 27, pp. 355–364, 2013. [17] R. Ferri, R. Chiaramonti, M. Elia, S. A. Musumeci, A. Ragazzoni,
and C. J. Stam, “Nonlinear EEG analysis during sleep in premature and full-term newborns,”Clinical Neurophysiology, vol. 114, no. 7, pp. 1176–1180, 2003.
[18] J. Gao, J. Hu, and W.-W. Tung, “Entropy measures for biological signal analyses,”Nonlinear Dynamics, vol. 68, pp. 431–444, 2011.
[19] C. Paisansathan, M. D. Ozcan, Q. S. Khan, V. L. Baughman, and M. S. Ozcan, “Signal persistence of bispectral index and state entropy during surgical procedure under sedation,”The Scientific World Journal, vol. 2012, Article ID 272815, 5 pages, 2012.
[20] J. W. Sleigh, D. A. Steyn-Ross, M. L. Steyn-Ross, C. Grant, and G. Ludbrook, “Cortical entropy changes with general anaesthesia: theory and experiment,”Physiological Measurement, vol. 25, no. 4, pp. 921–934, 2004.
[21] J. S. Richman and J. R. Moorman, “Physiological time-series analysis using approximate and sample entropy,”The American Journal of Physiology—Heart and Circulatory Physiology, vol. 278, no. 6, pp. H2039–H2049, 2000.
[22] S. M. Pincus, “Approximate entropy as a measure of system complexity,”Proceedings of the National Academy of Sciences of the United States of America, vol. 88, pp. 2297–2301, 1991. [23] D. Ab´asolo, R. Hornero, P. Espino, J. Poza, C. I. S´anchez, and R.
de la Rosa, “Analysis of regularity in the EEG background activ-ity of Alzheimer’s disease patients with Approximate Entropy,”
Clinical Neurophysiology, vol. 116, no. 8, pp. 1826–1834, 2005. [24] D. Ab´asolo, R. Hornero, P. Espino, D. ´Alvarez, and J.
Poza, “Entropy analysis of the EEG background activity in Alzheimer’s disease patients,”Physiological Measurement, vol. 27, no. 3, pp. 241–253, 2006.
[25] N. Burioka, G. Corn´elissen, Y. Maegaki et al., “Approximate entropy of the electroencephalogram in healthy awake subjects and absence epilepsy patients,”Clinical EEG and Neuroscience, vol. 36, no. 3, pp. 188–193, 2005.
[26] N. Kannathal, M. L. Choo, U. R. Acharya, and P. K. Sadasivan, “Entropies for detection of epilepsy in EEG,”Computer Methods and Programs in Biomedicine, vol. 80, no. 3, pp. 187–194, 2005. [27] U. R. Acharya, F. Molinari, S. V. Sree, S. Chattopadhyay, K.-H.
Ng, and J. S. Suri, “Automated diagnosis of epileptic EEG using entropies,”Biomedical Signal Processing and Control, vol. 7, pp. 401–408, 2012.
[28] Y. Song, J. Crowcroft, and J. Zhang, “Automatic epileptic seizure detection in EEGs based on optimized sample entropy and extreme learning machine,”Journal of Neuroscience Methods, vol. 210, pp. 132–146, 2012.
[29] C. Bandt and B. Pompe, “Permutation entropy: a natural complexity measure for time series,”Physical Review Letters, vol. 88, no. 17, Article ID 174102, 2002.
[30] M. Zanin, L. Zunino, O. A. Rosso, and D. Papo, “Permutation entropy and its main biomedical and econophysics applications: a review,”Entropy, vol. 14, pp. 1553–1577, 2012.
[31] G. Ouyang, C. Dang, D. A. Richards, and X. Li, “Ordinal pattern based similarity analysis for EEG recordings,”Clinical Neurophysiology, vol. 121, no. 5, pp. 694–703, 2010.
[32] Y. Cao, W. W. Tung, J. B. Gao, V. A. Protopopescu, and L. M. Hively, “Detecting dynamical changes in time series using the permutation entropy,”Physical Review E: Statistical, Nonlinear, and Soft Matter Physics, vol. 70, no. 4, Article ID 046217, 2004. [33] X. Li, G. Ouyang, and D. A. Richards, “Predictability analysis of
absence seizures with permutation entropy,”Epilepsy Research, vol. 77, no. 1, pp. 70–74, 2007.
[34] N. Nicolaou and J. Georgiou, “Detection of epileptic electroen-cephalogram based on permutation entropy and support vector machines,”Expert Systems with Applications, vol. 39, no. 1, pp. 202–209, 2012.
[35] A. A. Bruzzo, B. Gesierich, M. Santi, C. A. Tassinari, N. Birbaumer, and G. Rubboli, “Permutation entropy to detect
vigilance changes and preictal states from scalp EEG in epileptic patients. A preliminary study,”Neurological Sciences, vol. 29, no. 1, pp. 3–9, 2008.
[36] S. Baek, C. A. Tsai, and J. J. Chen, “Development of biomarker classifiers from high-dimensional data,”Briefings in Bioinfor-matics, vol. 10, no. 5, pp. 537–546, 2009.
[37] R. Palaniappan, K. Sundaraj, and N. U. Ahamed, “Machine learning in lung sound analysis: a systematic review,” Biocyber-netics and Biomedical Engineering, vol. 33, pp. 129–135, 2013. [38] H. Zhou, H. Hu, H. Liu, and J. Tang, “Classification of upper
limb motion trajectories using shape features,” IEEE Trans-actions on Systems, Man and Cybernetics C: Applications and Reviews, vol. 42, pp. 970–982, 2012.
[39] Z. J. Ju, G. X. Ouyang, M. Wilamowska-Korsak, and H. H. Liu, “Surface EMG based hand manipulation identification via nonlinear feature extraction and classification,”IEEE Sensors Journal, vol. 13, pp. 3302–3311, 2013.
[40] A. Phinyomark, P. Phukpattaranont, and C. Limsakul, “Feature reduction and selection for EMG signal classification,”Expert Systems with Applications, vol. 39, no. 8, pp. 7420–7431, 2012. [41] U. R. Acharya, S. V. Sree, G. Swapna, R. J. Martis, and J. S. Suri,
“Automated EEG analysis of epilepsy: a review,” Knowledge-Based Systems, vol. 45, pp. 147–165, 2013.
[42] M. Besserve, K. Jerbi, F. Laurent, S. Baillet, J. Martinerie, and L. Garnero, “Classification methods for ongoing EEG and MEG signals,”Biological Research, vol. 40, no. 4, pp. 415–437, 2007. [43] D. Nauck and R. Kruse, “Obtaining interpretable fuzzy
clas-sification rules from medical data,” Artificial Intelligence in Medicine, vol. 16, no. 2, pp. 149–169, 1999.
[44] L. I. Kuncheva and F. Steimann, “Fuzzy diagnosis: editorial,”
Artificial Intelligence in Medicine, vol. 16, no. 2, pp. 121–128, 1999. [45] I. G¨uler and E. D. ¨Ubeyli, “Adaptive neuro-fuzzy inference sys-tem for classification of EEG signals using wavelet coefficients,”
Journal of Neuroscience Methods, vol. 148, no. 2, pp. 113–121, 2005.
[46] E. D. ¨Ubeyli, “Automatic detection of electroencephalographic changes using adaptive neuro-fuzzy inference system employ-ing Lyapunov exponents,”Expert Systems with Applications, vol. 36, no. 5, pp. 9031–9038, 2009.
[47] A. Yildiz, M. Akin, M. Poyraz, and G. Kirbas, “Application of adaptive neuro-fuzzy inference system for vigilance level estimation by using wavelet-entropy feature extraction,”Expert Systems with Applications, vol. 36, no. 4, pp. 7390–7399, 2009. [48] S. M. Pincus, I. M. Gladstone, and R. A. Ehrenkranz, “A
regularity statistic for medical data analysis,”Journal of Clinical Monitoring, vol. 7, no. 4, pp. 335–345, 1991.
[49] S. M. Pincus, “Approximate entropy as a measure of irregularity for psychiatric serial metrics,”Bipolar Disorders I, vol. 8, no. 5, pp. 430–440, 2006.
[50] J. Bruhn, H. Ropcke, B. Rehberg, T. Bouillon, and A. Hoeft, “Electroencephalogram approximate entropy correctly classi-fies the occurrence of burst suppression pattern as increasing anesthetic drug effect,”Anesthesiology, vol. 93, no. 4, pp. 981– 985, 2000.
[51] D. E. Lake, J. S. Richman, M. Pamela Griffin, and J. Randall Moorman, “Sample entropy analysis of neonatal heart rate variability,” The American Journal of Physiology—Regulatory Integrative and Comparative Physiology, vol. 283, no. 3, pp. R789–R797, 2002.
[52] S. M. Pincus and A. L. Goldberger, “Physiological time-series analysis: what does regularity quantify?”The American Journal
of Physiology—Heart and Circulatory Physiology, vol. 266, no. 4, pp. H1643–H1656, 1994.
[53] G. Ouyang, X. Li, C. Dang, and D. A. Richards, “Deterministic dynamics of neural activity during absence seizures in rats,”
Physical Review E: Statistical, Nonlinear, and Soft Matter Physics, vol. 79, Article ID 041146, 2009.
[54] M. Staniek and K. Lehnertz, “Parameter selection for permu-tation entropy measurements,”International Journal of Bifurca-tion and Chaos, vol. 17, no. 10, pp. 3729–3733, 2007.
[55] X. Li and G. Ouyang, “Estimating coupling direction between neuronal populations with permutation conditional mutual information,”NeuroImage, vol. 52, no. 2, pp. 497–507, 2010. [56] J. S. R. Jang, “ANFIS: adaptive-network-based fuzzy inference
system,”IEEE Transactions on Systems, Man and Cybernetics, vol. 23, no. 3, pp. 665–685, 1993.
International Journal of
Aerospace
Engineering
Hindawi Publishing Corporationhttp://www.hindawi.com Volume 2014
Robotics
Journal ofHindawi Publishing Corporation
http://www.hindawi.com Volume 2014
Hindawi Publishing Corporation
http://www.hindawi.com Volume 2014
Active and Passive Electronic Components
Control Science and Engineering Journal of
Hindawi Publishing Corporation
http://www.hindawi.com Volume 2014
Machinery
Hindawi Publishing Corporation
http://www.hindawi.com Volume 2014
Hindawi Publishing Corporation http://www.hindawi.com
Journal of
Engineering
Volume 2014
Submit your manuscripts at
http://www.hindawi.com
VLSI Design
Hindawi Publishing Corporation
http://www.hindawi.com Volume 2014
Hindawi Publishing Corporation
http://www.hindawi.com Volume 2014
Shock and Vibration
Hindawi Publishing Corporation
http://www.hindawi.com Volume 2014
Civil Engineering
Advances inAcoustics and VibrationAdvances in
Hindawi Publishing Corporation
http://www.hindawi.com Volume 2014
Hindawi Publishing Corporation
http://www.hindawi.com Volume 2014
Electrical and Computer Engineering
Journal of
Advances in OptoElectronics
Hindawi Publishing Corporation
http://www.hindawi.com Volume 2014
The Scientific
World Journal
Hindawi Publishing Corporationhttp://www.hindawi.com Volume 2014
Sensors
Journal ofHindawi Publishing Corporation
http://www.hindawi.com Volume 2014
Modelling & Simulation in Engineering Hindawi Publishing Corporation
http://www.hindawi.com Volume 2014
Hindawi Publishing Corporation
http://www.hindawi.com Volume 2014 Chemical Engineering
International Journal of Antennas and
Propagation
International Journal of
Hindawi Publishing Corporation
http://www.hindawi.com Volume 2014
Hindawi Publishing Corporation
http://www.hindawi.com Volume 2014
Navigation and Observation
International Journal of
Hindawi Publishing Corporation
http://www.hindawi.com Volume 2014