Does Framing a Problem-Solving Scenario
Influence Learning?
Moffat MATHEWS and Antonija MITROVIC
Intelligent Computer Tutoring Group, University of Canterbury, New Zealand
[email protected]; [email protected]
Abstract: In this paper, we discuss potential effects of framing, a pedagogical strategy used by some teachers, with the view of implementing it in an intelligent tutoring system. The process of framing a learning activity, in our case problem solving, consists of having the activity in between a pre-action (or priming) phase and a post-action (or reflective) phase. We also describe an evaluation study where the experimental and control groups participated in a framed and non-framed learning session respectively. The pre- and post-action phases were whiteboard group sessions led by an SQL domain expert. The problem-solving phase was done solely on SQL-Tutor, an ITS for database querying. During the problem-solving phase, the experimental group solved the same number of problems in 23% less time than their counterparts in the control group. The type of problems solved and the high-level help used were similar for both groups. Although the learning gains were high, they were similar across groups, questioning the effectiveness of group-based reflection. The experimental group was also more efficient, expending less effort for similar gains. After examining various learning theories and analyzing the study results, we conclude that this is a valid teaching format for the next step of our research: investigating its implementation and evaluation within an ITS.
Keywords: ITS, Teaching models, Framing learning sessions, Evaluation
Introduction
Intelligent Tutoring Systems (ITSs) today are generally problem-solving environments where students can practice what they have learned. ITSs are usually not used as the sole source of the student's learning, but rather used in conjunction with other forms of declarative knowledge transfer (such as lectures) to complement the learning process. Research such as this, which looks at altering one or more factors of the learning scenario to maximize some aspect of the student's learning, is commonly done in the field of Artificial Intelligence in Education.
To this end, researchers work on creating, modifying, and evaluating various theories. Teachers implement various combinations of theories in the form of activities or strategies, by adapting them to fit the particular domain, set of students, and curriculum. The purpose of this paper is to discuss one such adaptation, namely framing the learning activity. We discuss the relevant theories and teaching methods in Section 1. Section 2 present the context and design of our study conducted at the University of Canterbury in 2008. We present our hypotheses about the effects of framing in Section 3, and the results of the study in Section 4. Section 5 discusses the results in the light of our hypotheses, followed by conclusions and avenues for further research in Section 6.
1. Related Work
A learning session is framed when the learning activity is preceded by a pre-action (or
priming) phase and followed by a post-action (or reflection) phase. In our case, the learning
activity is solving problems within an ITS. In the pre-action phase, the teacher (re-) introduces the target concepts (concepts that would be used in the problem-solving phase), links them to previously learned concepts (explains where it fits in the domain), works through examples, discusses common misconceptions, and sets the "boundaries" for the session. In the problem-solving phase, the students solve problems relating to the target concepts. In the post-action phase, the teacher prompts each student to reflect on his or her problem-solving experiences. Students are encouraged to analyse their errors (including the source of these errors) thereby uncovering misconceptions. The common mistakes made during the problem-solving session are usually worked through as a group.
There are several theories that make framing a plausible teaching strategy. Cognitive Load Theory [1] suggests that problem solving for novices generates heavy working memory loads, which could be detrimental to learning. When a student is presented with new items to learn, the working memory limit comes into play. To balance these loads, teachers should provide guided instruction, help narrow the problem search space by creating “boundaries” to each session, and alleviate the working memory restriction by making sure that only items relevant to the task are loaded into the working memory. This is exactly what happens during the priming phase.
Meta communication about the presentation of the subject is important with respect to learning [2]. Prior to the learning activity, the student needs to know the boundaries of the lesson segment (exactly what the lesson will contain), which should be well defined by the teacher. The student needs to know the content of the session, differentiating between the old and the new material. They also need to know the links between the new knowledge and previously learned knowledge [2].
Many learning models view learning as a cyclic process, around which knowledge acquisition, knowledge application (including experimentation and experience), and reflection (or knowledge processing) occur. Andreasen and Wu [3] discuss a few of the commonly used experiential models. Framing is a simplified (and thus possibly easier-to-implement) version of many of the models.
Reflection has been shown to promote deep learning [4, 5, 6]. Critically analysing the learning experience helps challenge the student’s underlying perception of the domain or topic, identify and correct misconceptions, and integrate new knowledge with existing knowledge [7]. This also better allows the student to transfer the newly acquired knowledge to other types of problems or scenarios. Self explaining one’s actions [8] and monitoring one’s progress via open student models [9, 10] have been shown to be useful reflective tools that benefit learning.
2. Study Design
SQL-Tutor [11], an ITS that teaches database querying, was used in the problem-solving phase of the study. SQL-Tutor has been used by many students around the world and is used in database courses including a second year database course (COSC226) at the University of Canterbury. COSC226 students are expected to attend lectures and a two-hour lab session (where they can practice what they learned in lectures) each week.
Thirty-eight students from COSC226 participated in the evaluation for no monetary reward. We divided them randomly into two groups: experimental and control. The idea was to perform the evaluation in a setting that was as close to the normal learning environment
faced by students in COSC226 and similar courses. As such, the experimental and control sessions were held during regular course lab sessions (100 minutes long) on 14 and 15 May 2008 respectively. The students participated in the study during the lab session they normally attended throughout the course. None of the students had used SQL-Tutor previously, although most had used another ITS (EER-Tutor) in previous labs.
A set of target SQL concepts, namely the concepts covered by queries using the Group
By and Having clauses were chosen for the study. Students generally find these types of
queries difficult as they add another level of complexity to the Select statement i.e. students not only have to think in terms of tuples (rows) but also in terms of grouped tuples. Furthermore, conditions cannot only be set on tuples (using the Where clause) but also on groups (using the Having clause), which is another common point of confusion amongst novices. The ability to use aggregate functions (functions on a group, such as sum, average,
count etc.) also adds to the complexity. For this evaluation, SQL-Tutor was restricted to
only present problems relating to these target concepts. The study was held immediately after the relevant concepts had been covered in lectures.
Both groups were informed that their performance in the session did not count towards course assessment. The experimental and control sessions had five and three phases respectively. Students in both groups completed an identical pretest in the first phase and an identical posttest in the last phase. The tests were of comparable difficulty and contained three questions relating to the target concepts. Students were required to formulate an SQL query for each question. An SQL domain expert created and marked all tests. The three questions varied in difficulty and marks were given for correct usage of SQL concepts.
After the pretest (first phase), the experimental group went through the pre-action (second) phase prior to the problem-solving (third) phase, which was followed by the post-action/reflection (fourth) phase and the posttest (fifth phase). The pre-action and post-action phases were ten-minute interactive, whiteboard sessions led by an SQL domain expert. Both these phases framed the problem-solving phase. In the pre-action phase, the expert briefly reminded students of the target concepts (which were taught in lectures previously) and, eliciting student participation, worked through a few examples. The examples, although different to those encountered in the problem-solving phase, were still of varying difficulty, covering the target concepts. The expert also discussed typical misconceptions. In the post-action phase, the concepts were reiterated. Students were prompted to reflect on their learning experience by commenting on some of their own mistakes and misconceptions. The expert also showed them the most common mistakes that are usually made during the problem-solving phase. Students were asked to find the errors (in terms of concepts and methods) in those incorrect solutions before collectively working through to reach a correct solution.
In contrast, the control group entered the problem-solving (second) phase following the pretest. They were told that they could practice problems from SQL-Tutor to improve their database querying skills. The pretest, posttest, and problem-solving phases for both groups were identical.
During the problem-solving phase, the students in both groups worked solely on SQL-Tutor without any assistance from human tutors. SQL-Tutor has its own problem-selection strategy. When a student requests a new problem, it presents the student with a list of potential problems within the student-selected database, highlighting one of the problems as a system choice or recommendation. This choice is the system’s recommendation of the next best problem and takes into account a variety of factors such as the student’s knowledge of a particular concept, their problem-solving history (student model), and attributes of the problem (such as its difficulty level). The student can override the system’s recommendation and choose a different problem. We used this problem selection strategy with the restricted set of problems.
3. Hypotheses
We had two hypotheses for this study.
Hypothesis 1: The experimental group should have a faster speed of solving problems
than the control group. We postulated that this would be due to the pre-action phase. This is mainly because this phase balances the cognitive load on the student and primes them for the problem-solving phase. Informing the student of the target concepts, reminding them of the situations in which they are applied, and addressing potential misconceptions should mentally prepare the student for the problem-solving phase. Working through examples with the expert should arm the students with the required mental tools at the crucial time and load the necessary information into their restricted working memory to solve the problems and correct their errors.
Hypothesis 2: The experimental group should have higher gains in the tests than the
control group. We postulated that this increase would be due to both pre- and post-action phases. The post-action phase involves reflection, which promotes deeper learning. Asking the student to look back and think about their problem-solving activity, including critically analyzing their mistakes gives the student a deeper understanding of the learned concepts, as shown in previous studies [4, 5 6]. The pre-action phase would enable students to solve problems faster, and therefore achieve more during the problem-solving phase, as well as enable them to focus on important domain concept. If the experimental group solved more problems than the control group, the additional gain would merely be a function of the amount of practice they received. In addition, the experimental group might eventually attempt and solve more difficult problems than the control group, leading to deeper learning and thus a higher posttest score. However, this side effect should be minimized as the experimental group was given less overall time for the problem-solving phase, due to the fact that the overall session length was fixed (100 minutes) and the pre- and post-action phases were 10 minutes each.
4. Results
The data we collected and analyzed included the pre/posttest results and just over 43 hours (total) of SQL-Tutor student models and logs in which 37 students collectively made 2,275 submissions to the system. One student did not make any attempts on SQL-Tutor and was excluded from the study. There were 20 students in the control group and 17 in the experimental.
All students sat the pretest. There were no significant differences between the pretest scores for both groups suggesting that both groups had similar SQL knowledge prior to the evaluation. Table 1 shows the calculated means and standard deviations for both tests and the percentage gain. Not all students completed the posttest, and therefore Table 1 gives the results only for those students who took both tests. Both groups improved significantly (p<.01) from pre- to posttest. Although the average gain for the experimental group was higher than that of the control group, the difference between groups was not significant. Further analysis of each of the three problems in the pre and posttest found that there were no significant differences between the scores of each problem between the groups.
Table 1: Matched means and standard deviations for test scores (%) and gains.
Pretest Posttest Gain
Experimental group (n=11) 40.2% (s.d = 29.1) 78% (s.d = 17.6) 37.9% (s.d = 31.9) Control group (n=12) 47.9% (s.d = 29.3) 78.5% (s.d = 13) 30.6% (s.d = 19.6)
The average time spent solving problems (given in Table 2) on SQL-Tutor by students in the experimental group was 60.73 min (s.d=14.67) while those in the control group spent on average 79.34 min (s.d=33.4). This means that the experimental group spent less time solving problems, t(27)=2.25 p=.016. This in itself is not an interesting factor as the overall problem-solving phase for the experimental group was shorter than that of the control group. However, both groups attempted and solved a similar number of problems. The experimental group solved an average of 13(s.d=8) problems each, while the control group solved on average 12.15 (s.d=7.8) problems each. This means that the experimental group solved problems faster than their peers in the control group (t(26)=1.8, p=.03 one-tailed, assuming unequal variances). This gave an effect size (Cohen’s d) of 0.66 (medium) using the pooled standard deviation.
The number of problems solved was strongly correlated to the number of distinct constraints (or domain principles) used by the student, 0.87 for the control group and 0.8 for the experimental group.
The experimental group solved problems faster, but were the problems solved by both groups similar? For example, did the experimental group solve easier problems? Each problem in SQL-Tutor is assigned a difficulty level by the SQL domain expert who authored the problem. Difficulty levels range from 1 (easy) to 9 (difficult) with non-trivial differences in difficulty between levels. SQL domain experts have checked problem difficulty levels such that problems with the same difficulty level are of similar difficulty, even across all the databases. The calculated means and standard deviations of the difficulty levels of problems attempted and solved for both groups are shown in Table 2. There was no significant difference between the difficulty of problems attempted and solved between groups.
Table 2: Means and standard deviations for experimental and control groups.
Another important factor that influences the number of solved problems is the amount of feedback (help) the students received. The higher problem-solving rate of the experimental group might have been the consequence of getting more help from the system. For example, did the experimental group view the full solution to problems more often than the control group? In order to analyze the effect of help, we calculated the high-level help ratio for both groups. High-level help (HLH) [12] is defined as the type of help given by a system that provides (part or all of) the correct solution to the student rather than having the student to solve the problem; e.g. full solution is a type of HLH. Another important characteristic of HLH in SQL-Tutor is that the HLH levels have to be manually requested by the student whereas the ITS might automatically provide other types of feedback (Low-level help). The HLH ratio is the number of HLH attempts divided by the total number of attempts. This shows us the proportion of HLH use, from 0 (no HLH use) to 1 (the student used HLH on every attempt). The average HLH ratio for the experimental group was 0.36 (0.22) and 0.32 (0.23) for the control group; therefore on average, they requested similar amounts of HLH.
Experimental Control Difficulty of problems attempted 4.8 (0.29) 4.93 (0.34) Difficulty of problems solved 4.79 (0.28) 4.83 (0.36) Lowest difficulty of problems attempted 3.35 (0.49) 3.5 (0.51) Highest difficulty of problems attempted 6.4 (1.1) 6.65 (1.22) Lowest difficulty of problems solved 3.35 (0.49) 3.35 (0.51) Highest difficulty of problems solved 6.4 (1.0) 6.4 (1.31)
Number of problems solved 13 (8) 12.15 (7.8)
Time spent on problem solving (min) 60.73 (14.67) 79.34 (33.4) High-level Help (HLH) ratio 0.36 (0.22) 0.32 (0.23) Request for Help (RFH) attempts 2.11 (1.36) 1.95 (1.35)
Furthermore, we calculated the Request for Help (RFH) [12] attempts. An RFH is an attempt where the student submits either an empty solution or the same solution as the previous attempt. As the student has not made any changes to their solution, this could be interpreted as a request for more help from the system. There were no significant differences between the RFH for both groups; on average, the experimental group made 2.11 (1.36) requests for help while the control made 1.95 (1.35).
The relative learning efficiency (E) is defined as the performance gained in one condition (say, the experimental condition) over the effort expended in relation to another condition (say, the control condition). A condition is more efficient if “1) their performance is higher than expected on the basis of their mental effort and/or 2) their invested mental effort is lower than might be expected on the basis of their performance” [13]. To calculate the efficiency of the problem-solving phase of each group, we used “time” as the effort spent and “test gains” as the performance measure. The relative efficiency is found by first converting each of the raw scores to a z score by subtracting the grand mean from the raw score and dividing by the standard deviation. E scores then are found by calculating the perpendicular distance between each z score and the E=0 line when plotted on a Cartesian graph. In this evaluation, the efficiency of the experimental group (E = 0.31) was significantly higher than that of the control group (E = -0.34), t(21)=1.85, p=0.039 (one-tailed, assuming unequal variances).
5. Discussion of the Results with Reference to the Hypotheses
As predicted by the first hypothesis, the experimental group had a higher problem-solving speed even though they attempted and solved problems of similar difficulty while using similar levels of help. The problem-solving speed is the number of problems a student solves per quantity of time. This should not be confused with their learning rate. The learning rate is the change in the probability of getting an error for a concept (the rate at which they learned the concept) per attempt. According to our hypothesis, the pre-action phase helps reduce and balance a student’s cognitive load, allowing better use of their cognitive resources. It primes and readies the student, transferring the required information into their current/working memory. The boundaries set on the session reduce the student’s problem search space. These tasks help the student retrieve the needed information quicker while helping the student stay on the current task of solving the problem, i.e. it makes the student faster. It does not necessarily reduce the number of attempts required for absolute novices to solve a problem, but given adequate feedback, they can link it to the information in their working memory to correct their errors faster. As these links are created more easily, this could mean that the learning rates for non-novices from the experimental group increase at a higher rate than their peers in the control group over time.
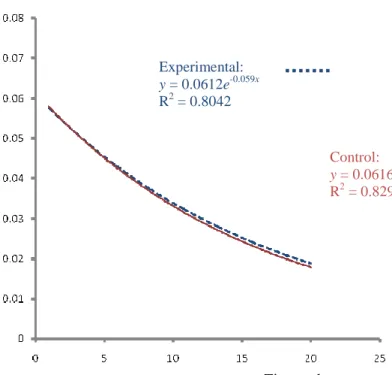
The exponential learning curves for both groups are shown in Figure 1. Both curves start from approximately the same position at attempts = 1, showing that both groups had similar initial knowledge of the concepts. The exponent shows the learning rate [14]. The R2 value shows the fit to curve and ranges from 0 to 1. As mentioned, the learning rates for both groups are very similar.
Furthermore, the experimental group was significantly more efficient in their problem-solving phase than the control group. In other words, while they did not learn more than the control group, they expended significantly less effort and therefore were more efficient.
Surprisingly, the second hypothesis was not supported by this study. Both groups had significant, yet similar gains in the posttest. One reason could be that we need a longer study with more participants to get significant differences in the learning gains. However, another
reason could be that reflection is a personal activity. It requires a student to actively engage in evaluating their own actions and solutions (or in some cases, other’s actions). The quality of their analysis and the assessment of their actions affect the quality of the reflection and thus the outcome on the depth of learning produced by reflecting. In a group, the individual’s responsibility and accountability decreases. These are both key components of reflection. Instead, they rely more heavily on others or the group leader to prompt and inform them of their actions and errors. Furthermore, not all students might have developed the skills required for adequate reflection, a meta-cognitive task. In this evaluation, we ran the reflection phase as many teachers do, in a group. Did the students truly reflect on their actions in our group reflection phase? An important question from this study could be “are group reflection exercises truly effective?” An item for future work is to investigate the possibility of implementing the entire framed session in an ITS. This would also make the post-action phase a non-group activity. Evaluation of that system would give us an idea about any differences between individual reflection and group reflection scenarios.
6. Conclusions
The use of framing as a teaching strategy seems to be a valid option, both when considering the various learning theories and the evaluation results. In our study, the primary learning activity was problem solving in SQL-Tutor, a constraint based tutor that teaches queries in the SQL language. The students who had been through a priming session before attempting problem solving were more efficient in their learning than their peers, as evidenced by a higher problem completion speed. The comparison of their learning to the control group, which did not have priming, showed that both groups of students learned the domain knowledge to the similar depth: the experimental group just did it faster. The experimental group also had a group reflection session, led by a human teacher; however, we observed no differences due to this reflection phase.
This study has also left us with a few questions. For example, how much time should be spent in each of the phases? We used 10 minutes for priming and reflection, but not because
Experimental: y = 0.0612e-0.059x R2 = 0.8042 Control: y = 0.0616e-0.062x R2 = 0.8295
Figure 1. Learning curves for the experimental and control groups.
P ro p o rt io n v io la te d Times relevant
of any theory. Should the framing time perhaps be a factor of the problem-solving time? Is there an optimal time for each phase such that the overhead of the framing time does not compromise the overall time of the learning session?
In the previous section, we posed a question regarding the usefulness of group-based reflection in comparison to individual, tailored reflection. In hindsight, an additional delayed test might have also provided a little more insight into the depth and retention of learned knowledge.
We plan to enhance SQL-Tutor by providing the priming phase within the system, and conduct another evaluation study of such an enhanced version of the system in 2009.
Acknowledgements
We thank all members of ICTG for their support.
References
[1]P. A. Kirschner, J. Sweller, and R. E. Clark, Why Minimal Guidance During Instruction Does Not Work: An Analysis of the Failure of Constructivist, Discovery, Problem-Based, Experiential, and Inquiry-Based Teaching, Educational Psychologist, 41, 75-86, 2006.
[2]G. Leinhardt and S. Ohlsson, Tutorials on the Structure of Tutoring from Teachers, Artificial Intelligence in
Education, 2, 21-46, 1990.
[3]R. J. Andreasen and C.-H. Wu, Study Abroad Program as an Experiential, Capstone Course: a Proposed Model, Proc. 15th Annual Meeting of the Association for International Agricultural and Extension Education, Trinidad, Tobago, 1999.
[4] S. Katz, D. Allbritton, and J. Connelly, Going beyond the problem given: How human tutors use post-solution discussions to support transfer. Artificial Intelligence and Education, 13, 1, 79-116, 2003.
[5] S. Katz, J. Connelly, and C. Wilson, Out of the lab and into the classroom: An evaluation of reflective dialogue in Andes. In R. Luckin, K. R. Koedinger, & J. Greer (Eds.), Proc. Artificial Intelligence in Education, pp. 425-432, 2007.
[6]A. Y. Lee, & L. Hutchison, (1998). Improving learning from examples through reflection. Journal of Experimental Psychology: Applied, 4 (3), 187-210.
[7]S. Atkins and K. Murphy, Reflection: a Review of the Literature, Journal of Advanced Nursing, 18, 1188-1192, 1993.
[8]M. T. H. Chi, Self-Explaining Expository Texts: The Dual Processes of Generating Inferences and Repairing Mental Models, in Advances in Instructional Psychology, R. Glaser, Ed. Mahwah, NJ: Lawrence Erlbaum Associates, 2000, pp. 161-238.
[9]J. Kay, Learner Know Thyself: Student Models to give Learner Control and Responsibility, Int. Conference on Computers in Education, Sarawak, Malaysia, 1997.
[10]A. Mitrovic and B. Martin, Evaluating the Effect of Open Student Models on Self-Assessment, Artificial
Intelligence in Education, Special Issue on Open Learner Modeling, 17, 121-144, 2007.
[11]A. Mitrovic, An Intelligent SQL Tutor on the Web, Artificial Intelligence in Education, 13, 173-197, 2003.
[12]M. Mathews and A. Mitrovic, How does students' help-seeking behaviour affect learning?," 9th Int. Conf.
Intelligent Tutoring Systems, vol. 5091, B. P. Woolf, E. Aimeur, R. Nkambou, and S. Lajoie, Eds. Montreal,
Canada: Springer-Verlag Berlin Heidelberg, 2008, pp. 363-372.
[13]F. G. W. Paas and J. J. G. van Merrienboer, The Efficiency of Instructional Conditions: An Approach to Combine Mental Effort and Performance Measures, Human Factors, 35, 737-743, 1993.
[14]B. Martin, K. Koedinger, A. Mitrovic, and S. Mathan, On Using Learning Curves to Evaluate ITSs, Proc. 12th International Conference on Artificial Intelligence in Education, Amsterdam, 2005, pp. 419-426.