Discussion Papers In Economics
And Business
Graduate School of Economics and
Osaka School of International Public Policy (OSIPP)
Osaka University, Toyonaka, Osaka 560-0043, JAPAN
Innovation, Licensing, and Imitation: The Effects of
Intellectual Property Rights Protection and Industrial Policy
Koichi Futagami Tatsuro Iwaisako
and
Hitoshi Tanaka
February 2007
この研究は「大学院経済学研究科・経済学部記念事業」
基金より援助を受けた、記して感謝する。
Graduate School of Economics and
Osaka School of International Public Policy (OSIPP)
Osaka University, Toyonaka, Osaka 560-0043, JAPAN
Innovation, Licensing, and Imitation: The Effects of
Intellectual Property Rights Protection and Industrial Policy
Koichi Futagami Tatsuro Iwaisako
and
Hitoshi Tanaka
Innovation, Licensing, and Imitation: The Effects of
Intellectual Property Rights Protection and Industrial Policy
∗
Koichi Futagami
†Tatsuro Iwaisako
‡and
Hitoshi Tanaka
§Abstract
This paper examines the long-run effects of intellectual property rights (IPR) protec-tion and industrial policies on innovaprotec-tion and technology transfer using a North–South quality ladder model where licensing is the main mode of technology transfer to devel-oping countries. We show that the governments of develdevel-oping countries can promote innovation and technology transfer by strengthening IPR protection, which is enforced by restricting the imitation of products. Moreover, the results also imply that subsi-dies on the cost of license negotiation can promote innovation and technology transfer, whereas subsidies on the cost of R&D have no effect.
Keywords: Licensing; Imitation; Innovation; Intellectual property rights;
JEL classification:F43; O33; O34;
∗The authors are especially grateful to Tetsugen Haruyama and Ryoji Ohdoi for their insightful and
con-structive suggestions. They would like to thank Ryo Arawatari, Takeshi Ikeda, Kazuo Mino, Makoto Mori, Tetsuya Nakajima, Hideki Nakamura, Noritsugu Nakanishi, attendees at the European Trade Study Group (ETSG) 2006 Vienna Eighth Annual Conference, and seminar participants at Kwansei Gakuin University and Osaka City University for their helpful comments. Of course, all remaining errors are the authors’ responsibil-ity.
†Faculty of Economics, Osaka University, 1-7 Machikaneyama, Toyonaka, Osaka 560-0043, Japan.
E-mail: futagami@econ.osaka-u.ac.jp
‡Faculty of Economics, Ritsumeikan University, 1-1-1 Noji-higashi, Kusatsu, Shiga 525-8577, Japan.
E-mail: tiwai@ec.ritsumei.ac.jp
§Graduate School of Economics, Osaka University, 1-7 Machikaneyama, Toyonaka, Osaka 560-0043,
1 Introduction
For developing countries with only limited knowledge of advanced technology, absorption from abroad is usually essential to promoting economic growth. Historically, for instance, the Japanese economy following World War II was able to experience high economic growth by importing knowledge of advanced technologies from the United States and Western Eu-rope. Today, as technologies are continually improved by research and development efforts, the absorption of advanced knowledge from abroad has become increasingly important for developing countries to catch up with technological progress. For this reason, how devel-oping countries smoothly absorb this knowledge and attain high economic performance has been a major concern in the field of economic growth theory for at least the past two decades. Generally speaking, advanced knowledge is considered to be transferred from developed countries to developing countries through various channels. For example, importing ma-chines and equipment enables firms in developing countries to access the general knowledge and information embodied in them.1 On the other hand, multinational firms in developed
countries often contribute to the conveyance of knowledge of their refined manufacturing techniques through their subsidiaries and affiliated partners.2
Local firms in developing countries also play an important role in diffusing knowledge of advanced technologies in two major ways. First, some local firms aim to make licensing contracts with patent holders to use their ideas and designs legally or to learn know-how.3
In particular, firms in Japan and Korea made many licensing contracts to help absorb ad-vanced technologies in the national development process after World War II.4Second, other
1See Coe et al. (1997).
2Lai (1998) investigated the long-term effects of intellectual property rights protection in developing
coun-tries on the rate of innovation, the rate of international production transfer and world income distribution when multinational firms transferred their technologies through foreign direct investment.
3A famous example is the ‘pilgrimage to Montecattini’ where a number of Japanese firms visited
Monte-cattini in Italy—an Italian company that succeeded in converting propylene into a fiber-forming propylene—in order to obtain a licensing agreement. Other examples of international licensing involving firms of developed and developing countries are given in Park and Lippoldt (2005, Tables 7 and 8).
4See Peck (1976), Ozawa (1980), and Enos and Park (1988). One of the reasons why firms in those
firms often sell products by copying ideas and technologies without the permission of patent holders in developed countries. These imitation activities are widely observed in developing countries owing to the weak protection of intellectual property rights (IPR) and are one of the major ways of disseminating advanced knowledge to developing countries.5
However, excessive risks of imitation induced by weak IPR protection are likely to de-crease technology transference through other legal channels, because patent holders feel apprehensive about the imitation of their products and ideas. Indeed, some empirical studies demonstrate that the strength of IPR protection in the recipient country is a significant deter-minant of technology transfer toward that country. For example, Yang and Maskus (2001a) found that U.S. receipts of royalties and license fees from unaffiliated firms positively re-sponded to a strengthening of patent rights protection in the recipient country. Likewise, Smith (2001) simultaneously analyzed the effect of patent rights in foreign countries on U.S. exports, affiliate sales, and licenses. The results indicated that strengthening foreign patent rights increased U.S. affiliate sales and licensing if the recipient country had strong imitative abilities. More recently, using U.S. firm-level data sets, Park and Lippoldt (2005) explored how royalty and licensing fee payments from unaffiliated firms in foreign coun-tries to U.S. firms were influenced by four IPR indexes of the recipient councoun-tries: patent rights, copyrights, trademark rights, and enforcement effectiveness. They concluded that IPR strength as a whole has statistically significant positive influences on licensing receipts. The results of these studies imply that stronger IPR protection leading to the restriction of imitation promotes international technology licensing across countries.
This paper provides a theoretical framework to analyze how strengthening IPR protec-tion, implemented by restricting imitaprotec-tion, affects international technology licensing. We
rather than depending on foreign firms. In addition, Japanese government authorities also feared the outflow of rents abroad. In fact, the Japanese government restricted foreign direct investment through a law established in 1950 (the Foreign Capital Law).
5Helpman (1993) explored how strengthening IPR in developing countries affected welfare using a dynamic
general equilibrium model, such that technological innovation takes place in developed countries while an invented product faces the risk of imitation in developing countries at a constant probability through time.
construct a product-life-cycle general equilibrium model where local firms in developing countries pay efforts to win license contracts under circumstances of prevailing imitation. A key feature of our model is that we explicitly take account of copies of products’ ideas, in addition to licensing activities, as a means of technology diffusion in developing countries, and regard the frequency of imitation as a measure of the strength of IPR protection.
By using this model, we investigate the influence of strengthening IPR in developing countries, the influence of the introduction of subsidies on licensing and R&D processes, and the influence of changing the rent distribution between licensors and licensees. As a consequence, we show three main results: (i) strengthening IPR through restricting imitation unambiguously increases technology transfer and innovation—this is consistent with the empirical results presented earlier; (ii) introducing subsidies for licensing activities promotes technology transfer and innovation, while subsidizing R&D activities has no effect; and (iii) an increase in the rate of license fees paid to the licensors is an obstacle, not only to technology transfer, but also to R&D activity.
In spite of the importance of licensing activities in technology transfer, only a few studies have incorporated it into a general equilibrium model. Yang and Maskus (2001b) initially addressed this issue using a ‘quality ladder’-type product-cycle model developed by Gross-man and HelpGross-man (1991, Ch. 12). They concluded that stronger IPR promotes innovation and technology transfer. They also considered that strengthening IPR protection decreases the cost of licensing (the size effect), and increases the rent distribution of licensor firms that have patents on advanced technologies (the distribution effect), both of which work posi-tively on technology transfer and innovation. However, because they assumed that firms in developed countries use their resources to make licensing contracts, their model does not suit the Japanese and Korean experience well. In addition, the steady state of their model is dynamically unstable, so that the model has a problem when the economy cannot ap-proach the steady state.6 Tanaka, Iwaisako, and Futagami (2007) later modified this point
and constructed a technology licensing model. In their model, firms in developing countries are assumed to use their own resources to win licensing contracts. However, they did not examine the effects of IPR protection policies.
Our study extends the models of both Yang and Maskus (2001b) and Tanaka, Iwaisako, and Futagami (2007) by formalizing the possibility that the design of a licensed product is copied by another firm. This extension is meaningful in the following three respects. First, our model better reflects actual observations on technology diffusion than either of the above studies. This is because the imitation of products is fairly prevalent in developing countries, and, as stated previously, is one of the main channels of technology diffusion. Second, our model better describes the trade-off that a patent holder faces by granting a license to an outside firm located in a low-wage country with weak IPR protection: the patented idea or product is exposed to a greater risk of imitation in exchange for the income accruing from license fees.
Third, and most importantly, our setting enables us to obtain richer implications for the policy of IPR protection. Yang and Maskus (2001b), for example, abstracted away the notion of the length and the breadth of patents and the procedures used for enforcement of IPR protection policy with the intention of analytical simplicity. As a result, they did not specify how government authorities control the strength of IPR protection. Instead, they indirectly analyzed the effects of stronger IPR protection by assuming that a fall in licensing costs and an increase in the licensor’s share of rents are a consequence of strengthening IPR protection policy. However, it is likely to be difficult to derive the direct implications of such a practical policy as the strict enforcement of IPR protection through the restriction of imitation without some additional settings. This is because the model leaves unformulated the connection between IPR protection policy and both licensing costs and rent shares. In contrast, our model can directly draw conclusions about a restrictive policy on imitation since we explicitly introduce imitation into the model with an index of the degree of IPR protection. Moreover, our results give support to the global tide of intellectual property
reform in the direction of strict protection following the World Trade Organization’s (WTO) Trade-Related Aspects of Intellectual Property Rights Agreement in terms of promoting innovation and technology transfer.
The remainder of this paper is structured as follows. Section 2 introduces the model where both licensing and imitation coexist. Section 3 shows that a unique steady state ex-ists. Section 4 conducts comparative statics of the steady state. Section 5 provides some concluding remarks.
2 The Model
This paper constructs a quality ladder-type dynamic North–South model in which licensing is the main mode of technology transfer to a developing country in order to examine the effects of governmental policies on innovation and technology transfer. In this model, we consider that imitation of products prevails in the developing country because of incomplete IPR protection. We regard this speed of imitation as an index reflecting the level of IPR protection in the developing country. Our model is mainly based on work by Yang and Maskus (2001b) and Tanaka, Iwaisako, and Futagami (2007).
Consider an economy consisting of two regions, North and South, labeled N and S, respectively. A continuum of goods indexed byω ∈[0,1]exists in the economy and goods are produced in either the North or the South. Each productω is classified by a countable infinite number of qualitiesj = 0,1,· · ·. The product with one-grade higher quality than the current top-of-the-line quality of the product becomes available if innovation occurs in the industry. Therefore, productωwith qualityjcan be produced after thejth innovation in the industryω. We assume that the quality is provided byqj(ω) =λj, where the increment of
quality,λ >1, is identical for all products. As described below, research and development conducted by firms brings this quality improvement. We choose units appropriately so that the quality at timet = 0is equal to unity in all industries.
2.1 Consumer’s Optimization
Consumers living in both regions have identical preferences:
U = ∞
0 e
−ρtlogu(t)dt, (1)
whereρ is a common subjective discount rate andlogu(t)represents instantaneous utility at timet. We specify the instantaneous utility function in Cobb-Douglas form as:
logu(t) = 1 0 log ⎡ ⎣ j qj(ω)dj,t(ω) ⎤ ⎦dω,
wheredj,t(ω)denotes consumption of goodω with quality j at timet. The representative
consumer maximizes his or her utility (1) under an intertemporal budget constraint: ∞
0 e
−0tr(s)ds
Etdt =A0,
wherertis the interest rate consumers in both countries face at timetandA0is the sum of
initial asset holdings and discounted total labor income. The termEtrepresents the flow of
spending at timet, namely:
Et = 1 0 ⎡ ⎣ j pj,t(ω)dj,t(ω) ⎤ ⎦dω,
wherepj,t(ω)is the price of productωwith qualityj at timet.
We can solve this representative consumer’s problem in two steps. In the first step, we think of the intratemporal maximization problem by computing the allocation of spending Et to maximizelogu(t) given prices at timet. As a result of the static maximization, the
consumer allots identical expenditure shares to all products and chooses a single quality j =Jt(ω)of each product that carries the lowest quality-adjusted pricepj,t(ω)/qj,t(ω). This
implies the static demand function: dj,t(ω) = ⎧ ⎪ ⎪ ⎨ ⎪ ⎪ ⎩ Et/pj,t(ω) forj =Jt(ω), 0 otherwise.
In the second step, we compute the time pattern of spending to maximize the consumer’s utility (1) subject to the dynamic budget constraint. This intertemporal utility maximization requiresE˙t/Et=rt−ρ. By taking the aggregate spending as the numeraire, we normalize Et= 1for alltso that the interest ratertis always equal to the subjective discount rateρ.
2.2 Production
We now consider the production side. We assume that each economy has a single primary production factor, labor. The total labor supply is assumed constant and depends on the country. We also assume that one unit of output requires one unit of labor input. In addi-tion, research activities and license negotiations to win a license from a patent holder also require labor inputs, while imitation is assumed to progress exogenously without any labor, described below.
Two types of firm are assumed to exist in the economy, ‘leaders’ and ‘followers’. Leaders are firms that have the ability to produce the current highest quality of each good, while followers are the remaining firms. As a general feature of this kind of model, industrial leaders are assumed not to intend to further research their products until the products are copied. Therefore, the quality gap between leaders and their closest rivals never exceeds one step.
A firm is also distinguished in terms of its location; that is, whether it is in the North or in the South. We assume that only Northern firms have the ability to conduct R&D and bring state-of-the-art products to the market. When succeeding in innovation, a Northern firm can acquire the patent on the design of a product in the North. In addition, the firm can
also export the good to the South without any transportation costs or tariffs.
On the other hand, to acquire the exclusive rights to produce and sell a Northern firm’s product that has not yet been imitated, a Southern firm must propose a license contract to the Northern patent holder. Granted the license, the Southern firm can receive the blueprint of the product and acquire enough knowledge to manufacture it. Moreover, the firm can legally make a monopoly of the product in the entire world. However, Southern licensees must keep paying a part of the rents from the sale to their licensors as a license fee, until the products are imitated or replaced by the next highest quality product. We assume that Southern licensees pay the exogenously determined share proportion of profitsδ ∈ (0,1), which reflects the bargaining power between a licensee and a licensor.7 All Southern licensees are forbidden
by their licensors to copy the blueprint and to break the license contracts so as to avoid paying the license fee.
When a product license is granted to a Southern firm, the design of the product becomes the target of imitation by other Southern firms.8 For tractability, we assume that imitation
oc-curs exogenously and that every licensee firm operating in the developing country is equally exposed to the threat of imitation.9 In more detail, we assume that in an infinitesimal time
intervaldt, imitation occurs randomly in each industry with probabilitymγdt, wheremis an exogenous parameter determined by imitation technology or other factors such as cultural climate, while 0 ≤ γ ≤ 1 is a policy parameter that reflects the degree of IPR protection chosen by the Southern authority. Smallerγ therefore means stronger IPR protection in the South: whenγ is equal to zero, patent enforcement in the South is perfect so that no
imita-7It may be more natural to consider that the rent sharing between licensors and licensees is determined
endogenously according to their bargaining power. We can endogenize rent sharing, if we assume that licensors and licensees decide the rent shareδthrough Nash bargaining. However, to simplify the analysis, we regard share proportionδ as exogenously given, following Yang and Maskus (2001b) and Tanaka, Iwaisako, and Futagami (2007).
8We exclude the possibility that Northern follower firms imitate a patented product by assuming perfect
protection of IPR in the North. In equilibrium where the Southern wage rate is lower than the Northern wage rate, even if a Northern follower firm were to copy a licensed product, the Northern firm could not operate because of the limit-pricing strategy of the Southern official licensee. Therefore, in equilibrium, a Northern follower firm would not engage in imitation activities of a licensed product.
tion occurs; whenγ is equal to one, IPR are not protected in the South at all. Throughout this paper, we assume thatmγ > ρ/(1−δ)to ensure the local stability of the steady state.
The exogenous imitation rate mγ can be also interpreted from another point of view. In the above formulation, the average time up to imitation after licensing in an industry is a random variable that follows the exponential distribution with parameter mγ, whose expectation is given by the reciprocal of the parameter, 1/(mγ). Hence, one can regard
1/(mγ) as the expected patent life in the South. Namely, in this model, the patent of a licensed product ‘expires’ in the South after a time interval of length1/(mγ)on average.10
According to this interpretation, a smallerγ corresponds to longer patent protection in the recipient country of the technology license.
Once imitation occurs in an industry, perfect competition prevails in the industry and the product is sold at unit costwS, wherewS is the wage rate in the South. Therefore, the
Southern licensee loses its monopoly rent and its stock becomes of no value in the market. In addition, the Northern licensor can no longer receive the license fee. On the other hand, we posit state-of-the-art products manufactured in the North possess confidentiality, so that for follower firms, they are technologically or economically impractical to copy. Namely, we assume that no imitation occurs in an industry where the Northern leader firm manufactures the product in the North.
To maximize profits, each leader firm whose product has not yet been imitated sets prices at the upper limit to exclude rival firms from the market. Assuming that the patents of all products whose qualities are inferior to each state-of-the-art product are in the public do-main, and that the Southern wage rate is less than the Northern wage rate, the strongest rivals of each leader firm whose product has not yet been imitated are always Southern fol-lowers who have the ability to produce the second-highest quality of each product. As a leader firm can exclude rival firms by setting the lowest quality-adjusted price on its
prod-10A similar interpretation of the expected value of patent protection length in the South is also used in Kwan
uct, the optimal price setting of each Northern producer and each Southern licensee is the marginal cost of the strongest rival firm multiplied by the increment in quality:
p =λwS.
The price setting of each leader then yields a demand per product of1/(λwS). Hence, each
Northern patent holder earns a flow of profits:
πN = (λwS−wN) 1
λwS = 1−
wN
λwS, (2)
wherewN is the wage rate in the North, which must be restricted below λwS so that the
Northern leaders can earn strictly positive profits. On the other hand, the profits of Southern licensees are:
πL= (λwS−wS) 1
λwS = 1−
1
λ. (3)
2.3 Research Activities and License Negotiations
We describe the random success of innovation as a Poisson process. That is,aNI˜iunits of la-bor input into research activities during an infinitesimal time intervaldtlead an entrepreneur ito success of innovation with probability I˜idt, whereaN is a parameter. We assume the productivity of researchaN is the same in all firms, so that follower firms can compete with
the incumbent leaders in regard to research and development of the next-higher-quality prod-uct. LetVN be the market value of a Northern leader, which is the reward for innovation. In
any moment, each entrepreneur decides the labor input to maximize his or her instantaneous profit: (VN −wNaN) ˜Ii. Hence, the following zero-profit condition in research activities is
satisfied:
VN,t≤wNt aN with equality if I˜i >0. (4)
stochasti-cally reach agreement on a license contract according to the degree of negotiation effort by the Southern firm. We assume that the Southern firmi hoping to reach a licensing agree-ment with instantaneous probability˜ιi must throw aL˜ιi units of labor per unit of time into negotiation activities, whereaL is a parameter that satisfiesaL < aN.11 LetVL denote the
expected present value of profits earned by an incumbent licensee firm. For Southern firms, the expected gain obtained by winning a license is equal to(1−δ)VL. Therefore, such firms optimally choose the intensity of license negotiation in order to maximize their instanta-neous profit[(1−δ)VL−wSa
L]˜ιi. In the equilibrium, since the level of license negotiation
must be positive but finite, the following zero-profit condition in the license negotiation is satisfied:
VL,t ≤wSt
aL
1−δ with equality if ˜ιi >0. (5) While we posit in the above that patent holders are always willing to comply with the offer of license contracts, we need to consider the possibility that patent holders may refuse these offers. Northern patent holders will allow Southern firms to manufacture their prod-ucts only when the market value after licensing exceeds the current value, VN,t; otherwise
they will not admit licensing. Reaching agreement on a license, the Northern patent holder acquires a claim on a fraction of the Southern licensee’s profit as the license fee. Since a Northern licensor can receive100 ×δ percent of the licensee’s profit in any moment, the expected value of that claim is expressed as δVL,t. Assuming that a licensor is obliged to
compete with its licensee in a Bertrand fashion if it also produces the product, no licensor has an incentive in equilibrium to continue to sell the product after the license agreement. Therefore, the market value of a licensor firm is alsoδVL,t. As a result, the equilibrium with
11In our setting, Southern firms only incur license negotiation costs and Northern firms enjoy the benefit
of licensing agreements without any effort. Perhaps, it may be more realistic to assume that not only the Southern firms but also the Northern firms incur negotiation costs. However, to make the analysis tractable and more contrastive to existing studies, we assume that only Southern firms throw their resources into license negotiation and bear all of the negotiation cost.
positive licensing requires the condition:
δVL,t≥VN,t.
2.4 Equilibrium Conditions
In the equilibrium, there exist three possible categories of industry in the market: (i) the Northern patent holder produces the state-of-the-art variety; (ii) the Southern licensee pro-duces the highest-quality product under a license; and (iii) Southern imitators produce the highest-quality product under perfect competition. We represent the measure of industries belonging to each category bynN,t, nL,t, andnM,t, respectively. Because the measure of all industries is unity, we havenN,t+nL,t+nM,t = 1. In the following part of this paper, we focus only on the symmetric equilibrium such that all industries in the same category are symmetric.
In the symmetric equilibrium, the intensities of innovation and licensing are common to all industries. LetI denote this aggregate innovation intensity in each industry, namely, I = iI˜i. Then, investment to innovation targeted at any industries yields the same
ex-pected payoff because the patents of a second-highest-quality product are always in the pub-lic domain. As a consequence, the research efforts of entrepreneurs range over allωequally and innovation occurs in every industry with equal probability. Meanwhile, Southern firms negotiate license contracts with Northern state-of-the-art patent holders whose products are neither licensed nor imitated. In the symmetric equilibrium, Southern firms choose equal efforts of negotiation among the industries. As a result, each Northern leader firm whose product is neither licensed nor imitated receives such offers with equal intensity in the equi-librium. Letιdenote the aggregate intensity of license negotiation targeting at each industry, namely,ι=i˜ιi.
How does the measure of products in each category change over time? In an infinitesimal time interval of length dt, Northern entrepreneurs succeed in upgradingIt(nL,t+nM,t)dt
products that Southern licensees or imitators manufacture, whereas ιtnN,tdt products are newly licensed and come to be manufactured in the South (see figure 1). Therefore, the measure of products manufactured in the North follows the equation of motion:
˙
nN,t=It(nL,t+nM,t)−ιtnN,t. (6)
On the other hand, measure mγnL,tdt licensed products are newly copied in the time in-terval, while ItnM,tdt imitated products revert to Northern leaders because of success in
innovation. Hence, we obtain the following equation of motion for the measure of imitated products:
˙
nM,t =mγnL,t−ItnM,t. (7)
BecausenN,t+nL,t+nM,t = 1, the measure of licensed products changes over time accord-ing to the followaccord-ing equation:
˙
nL,t=−n˙N,t−n˙M,t.
Now we consider how the market value of each firm varies over time. First, we consider the stock of a Northern patent holder that has not yet achieved a license for its product. Dur-ing an infinitesimal time interval of lengthdt, each Northern incumbent leader is exposed to the hazard of replacement by a higher-quality product with probabilityItdt. If innovation occurs, the incumbent Northern patent holder suffers capital lossVN,t. In the same time in-terval, the patent holder can reach a license agreement with a Southern firm with probability ιtdt. The Northern leader then acquiresδVL,tinstead of the current market valueVN,t. If
nei-ther innovation nor licensing occurs in the industry during the time interval, the patent holder can earn the profitsπN,tdtand capital gainV˙N,tdt. The total sum is the expected earnings of the shareholders in a Northern leader firm. Provided that the idiosyncratic risks arising from holding a stock are diversified away by all investors, a stock should yield exactly the same
expected rate of return as the risk-free interest rate,rt. The no-arbitrage condition between the stock and a risk-free asset is then:
rtVN,t =πN,t+ ˙VN,t−ItVN,t+ιt(δVL,t−VN,t). (8)
In the same manner, we can consider the total market value of a Southern firm operating under license. A Southern licensee suffers a capital loss VL,t if innovation occurs in the industry. In addition, a licensee firm is also faced with the risk of imitation by other Southern firms. Since a product is imitated by follower firms with instantaneous probability mγ, a Southern licensee loses the monopolistic position with probability (It + mγ)dt in the
infinitesimal time interval of length dt. If neither innovation nor imitation occurs in the industry during the time interval, the licensee firm can earn profitsπL,tdtand capital gain
˙
VL,tdt. Since the sum of these risky rates of returns must be identical to the risk-free interest
rate, we obtain the following no-arbitrage condition:
rtVL,t=πL,t+ ˙VL,t−(It+mγ)VL,t. (9)
We finally consider the labor market equilibrium conditions. Let LN andLS denote the
fixed labor supply in the North and the South, respectively. For analytical tractability, we assume thatLS is equal to or greater than (a
L/aN)LN. On the demand side, entrepreneurs
who make an effort in R&D and Northern leader firms require labor in the North, while firms under negotiation with a Northern patent holder and Southern manufacturers (licensees and competitive firms) demand labor in the South. Entrepreneurs in the North conduct R&D at the same aggregate intensityItover all industries, so they employaNIt(nN,t+nL,t+nM,t) units of labor at each moment. In addition, each manufacturing firm in the North sells
1/(λwS
units of labor at the time. Thus, the labor market-clearing condition in the North is:
aNIt(nN,t+nL,t+nM,t) + 1
λwS t
nN,t =LN. (10)
In the South, follower firms employaLιtnN,t units of labor for license negotiation at timet.
Moreover, for production, licensee firms requirenL,t/(λwS
t)units of labor, while
competi-tive firms that manufacture imitated products neednM,t/wS
t units of labor. In consequence,
the labor market-clearing condition in the South is:
aLιtnN,t+ 1 λwS t nL,t+ 1 wS t nM,t=LS. (11)
3 Steady State Equilibrium
In the following part of this paper, we pay attention to only the steady state equilibrium in which innovation and licensing keep taking place at some constant speed over time.12 In the
steady state, the fraction of each type of industry, the market values of firms, and the wage rates of both regions are constant over time. Let variables with upper bar, e.g.,I¯, denote the steady state values of the corresponding variables.
In the steady state, the market value of a firm is equal to the expected present value of profits. From equations (3) and (9), the value of a licensee firm is given by:
¯
VL = ¯(λ−1)/λ
I+mγ+ρ. (12)
Moreover, the zero-profit condition in licensing activities (5) implies that:
¯
wS = (1−δ) ¯VL aL .
(13)
12We can verify that the equilibrium path converging to the steady state exists and is locally unique if the
aggregate innovation intensity in the steady state,I¯, satisfies the condition (19) as stated below. The proof is given in the appendix.
Similarly, using the relation that:
¯
wN = V¯N aN,
(14) which is derived from the zero-profit condition in innovation (4), together with equations (2), (8), and (13), we obtain: ¯ VN = 1 +δ¯ιV¯L ¯ I+ ¯ι+ρ+ aL aN(1−δ)λ 1 ¯ VL . (15)
For the sake of seeking the steady state values, we first rewrite the condition on the Northern labor market. Combining equations (10), (12), and (13), we can derive pairs ofI¯ andn¯N that are consistent with Northern labor market clearing as follows:
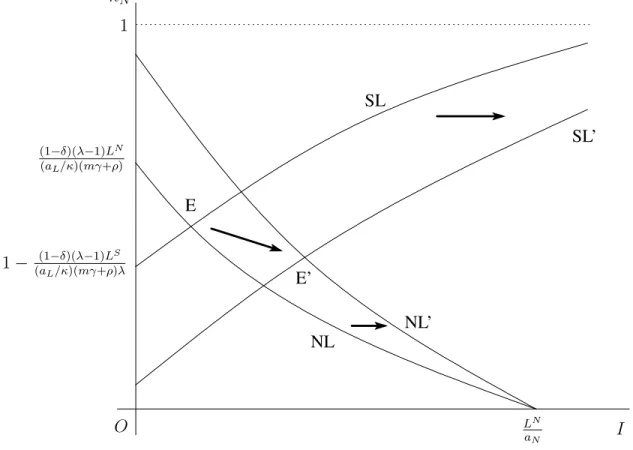
¯ nN = (1−δ)(λ−1) aL Φ( ¯I;γ), (16) whereΦ( ¯I;γ) ≡ (LN −a
NI¯)/( ¯I+mγ+ρ). This relationship is drawn as a
downward-sloping curve on the ( ¯I,n¯N)plane (see figure 2). We name this curve NL. The NL curve
means that the ratio of products manufactured in the North to all products must decrease with an increase inI¯; otherwise the Northern labor market is never cleared owing to the excess demand for labor by incumbent leaders and firms researching higher-quality products.
To determineI¯andn¯N, we need another equation with respect to these variables. We can derive this relationship from the Southern labor market-clearing condition. First, from equations (6) and (7), the following relations are satisfied in the steady state:
¯ι¯nN = ¯I(1−¯nN), n¯L= ¯ I ¯ I+mγ(1−n¯N), and¯nM = mγ ¯ I+mγ(1−n¯N). (17) Substituting (12), (13), and (17) into (11), we have:
¯
nN = 1−
(1−δ)(λ−1)LS
aL Ψ(¯I;γ),
whereΨ(¯I;γ)≡( ¯I+mγ)/[( ¯I+mγ+ρ)( ¯I+mγλ)+(1−δ)(λ−1)¯I( ¯I+mγ)]. Note that the right-hand side of equation (18) is increasing withI¯under the assumptionmγ > ρ/(1−δ). We describe the combinations of I¯and n¯N that satisfy equation (18) by the SL curve in figure 2. The interpretation of the SL curve is similar to that of the NL curve. Namely, the proportion of products manufactured in the South to all products,1−n¯N, must fall with a
rise ofI¯, since the additional labor demand of leader firms manufacturing the products and of follower firms engaged in license negotiation prevent the Southern labor market clearing without such a reduction.
Since the SL curve is upward-sloping under the above assumptions, there is at most one crossing point of the two curves in the region where both I¯andn¯N are positive. To ensure that the unique and attainable steady state and the locally unique equilibrium path converging to this steady state exist, we focus our attention on the case in whichI¯satisfies the following inequality:
max 0, λ LS aL −mγ <I <¯ L N aN. (19)
If both curves cross once in the first quadrant, n¯N takes a value that is between zero and
one. Then,n¯L, n¯M, and¯ι are given by equations (17). Furthermore,V¯L, V¯N, w¯S, andw¯N
are determined by equations (12)–(15).
However, we must impose two additional conditions on the parameters to assure the existence of the steady state. The first is a condition about the incentive of patent holders to license. As stated above, a patent holder has no incentive to grant a license of its product if the expected value of the license fee is below the current market value. Therefore, the steady state with strictly positive licensing requiresδV¯L ≥V¯N. The second condition is concerned
with the wage rates in both regions. Our analysis presumes that the Northern wage rate is higher than the Southern wage rate. Moreover, the Northern wage ratewN is restricted
of negative profits. From equations (13), (14), and (15), we can restate these conditions as: aN(1−δ) aL < 1 +δ¯ιV¯L ( ¯I+ ¯ι+ρ) ¯VL+aN(1aL−δ)λ < min δ, aN(1−δ)λ aL .
4 Comparative Statics
In this section, we consider how the intensities of innovation and licensing are affected by the stronger protection of intellectual property rights, subsidy policies for license negotiation and research activities, and changes in the profit division rule.
4.1 Effects of Strengthening IPR Protection
In Section 2, we have assumed the imitation speed is affected by the IPR protection policy of the Southern authorities. That is, we have thought ofγas a policy parameter on IPR pro-tection by the Southern government. Thus, in this subsection, we first conduct comparative statics with respect toγ.
First, totally differentiating equation (16), we obtain:
dn¯N =− (1−δ)(λ−1) aL( ¯I+mγ+ρ)2 (LN +aNmγ+aNρ)dI¯+m(LN −aNI¯)dγ . (20) BecauseLN −a
NI >¯ 0from equation (10), equation (20) means thatn¯N is required to
in-crease with a fall ofγ, ifI¯were unchanged, in order to maintain equilibrium in the Northern labor market. In other words, the NL curve in figure 2 rotates clockwise in response to a fall inγ induced by tightening IPR protection. This is because, for any givenI¯andn¯N, a lower γ raises the Southern wage rate through an increase in V¯L (see equations (12) and (13)).
The higher Southern wage rate enables each Northern patent holder to set a higher price. This leads to lower product demand, which thereby gives a lower each incumbent Northern leader’s demand for Northern labor. Therefore, the Northern labor supply can afford to
re-tain more producers in the North, that is,n¯N must be higher than before to clear the excess labor supply, if the labor demand of the research sector,aNI¯, is unchanged by the Southern policy change.
Next, the total differential of equation (18) is expressed as follows:
dn¯N =
(1−δ)(λ−1)LSΨ(¯I;γ)2
aL
AdI¯+Bdγ, (21)
whereA=δ+λ(1−δ)−mγρ(λ−1)/( ¯I+mγ)2>0andB =mλ+Iρ¯ (λ−1)/( ¯I+ mγ)2>0. Equation (21) shows thatn¯N is required to decrease with a fall ofγ, ifI¯were
unchanged, in order to maintain equilibrium in the Southern labor market. Thus, the SL curve in figure 2 moves downward with a decrease inγ.
Intuitively, if both I¯and n¯N were unchanged, restrictions on imitation by the
South-ern govSouth-ernment would decrease SouthSouth-ern labor engaging in manufacturing for two reasons. First, using the same argument as with Northern labor demand, the increase in the Southern wage rate through an increase in V¯L due to a reduction in the threat of imitation decreases
each incumbent leader’s demand for Southern labor with the fall ofγ. Second, from equa-tion (17), a reducequa-tion of the proporequa-tion of imitated industries to licensed industries in the South,n¯M/n¯L, as induced by the policy modification, has a negative effect on labor demand
in the South because licensee firms behaving as monopolists employ less Southern labor than a comparable competitive firm. The redundant labor originating from these two effects must be absorbed by follower firms under license negotiation to restore equilibrium to the Southern labor market. As a consequence, tightening IPR protection leads more Southern follower firms to reach an agreement of a license contract with a patent holder, which is de-scribed by an increase in¯ιn¯N, at each moment. From equation (17), this means thatn¯Nmust
decrease with the strengthening of IPR protection for any givenI¯in order for the Southern labor market to clear.
up-wards, modification of the IPR protection policy moves the intersection from E to E in figure 2. Since the new intersection after the policy change is located rightward of the orig-inal, we can confirm that tightening IPR protection in the South unambiguously increases
¯
I.
However, the figure provides no information about whethern¯N increases or not.
There-fore, we next compute∂n¯N/∂γto examine its sign. Using equations (20) and (21), we can eliminate the termdI¯and obtain:
⎡ ⎢ ⎣1 + L N +a Nmγ+aNρ LSA( ¯I+mγ+ρ)2Ψ(¯I;γ)2 ⎤ ⎥ ⎦dn¯N = (1−δ)(λ−1) AaL( ¯I+mγ+ρ)2 (LN +aNmγ+aNρ)B−m(LN −aNI¯)A dγ. (22) Because(LN+a
Nmγ+aNρ)B−m(LN−aNI¯)Ais positive, we can confirm that∂n¯N/∂γ >
0from equation (22). This result and equation (17) imply that both∂¯ι/∂γ and∂(¯ιn¯N)/∂γ are negative. In other words, license activities are stimulated by a strengthening IPR protec-tion.
Hence, the above analysis is summarized in the next proposition.
Proposition 1 Strengthening intellectual property rights protection through restrictions on
imitation promotes innovation and technology licensing to developing countries.
This proposition enhances Yang and Maskus’ (2001b) result regarding the strengthening of IPR protection. Instead of assuming a policy parameter of the Southern government authorities, Yang and Maskus (2001b) have indirectly regarded both a rise in the probability of success in license negotiations under the same labor inputs (the cost-reducing effect) and a rise in royalty payments to the licensor (the distribution effect) as the effects of strengthening IPR protection. Based on such a formulation, they concluded that stronger IPR protection promotes innovation and licensing through two effects. In contrast, our model explicitly takes into account the possibility of imitation by other firms, and interprets the lower speed
of exogenous imitation as the result of stronger IPR protection by the Southern government. As a result, we obtain proposition 1 which implies that the developing country’s authority that aims to encourage licensing of state-of-the-art products should regulate copies targeting licensed products.13
We can also show that restrictions on imitation raise the Southern wage rate in the steady state. From equation (13),∂w¯S/∂γ satisfies the following equation:
∂w¯S ∂γ =− (1−δ)(λ−1) aLλ( ¯I+mγ+ρ)2 m+ ∂I¯ ∂γ <0. (23)
To interpret this equation, recall that the Southern wage rate relates closely to profitability in the negotiation activities of the license because of free entry. This equation then shows that a rise ofγ causes the Southern wage rate to change through two channels. First, tighter enforcement of IPR protection (a fall inγ) mitigates the threat of imitation by other firms, so that a licensee can enjoy the longer expected duration of the monopoly. This causes the stock value of a licensee firm that has a one-to-one correspondence to the Southern wage rate to increase directly. However, since strengthening IPR protection activates innovation in the North as stated in proposition 1, the higher frequency of innovation shortens the expected duration of the monopoly. In consequence, this second indirect effect induces the Southern wage rate to decrease and depresses the first effect. However, we can verify that the first positive effect dominates the second negative effect under restriction (19). Substituting equation (21) into (22) and rearranging the terms, we have:
∂I¯ ∂γ =−m× (LN −a NI¯) +LS(B/m)(¯I+mγ+ρ)2 Ψ(¯I;γ)2 (LN +a Nmγ+aNρ) +LSA( ¯I+mγ+ρ)2 Ψ(¯I;γ)2.
We can show that the numerator of the fraction on the right-hand side is smaller than the
13Another feature of our model is to confirm the local stability of the steady state. We prove in the appendix
that the steady state of our model has a unique converging path. However, and as mentioned in the Introduction, the steady state in Yang and Maskus (2001b) is totally unstable.
denominator from condition (19), and∂I/∂γ¯ is larger than−m. Thus, from equation (23), we can conclude that the Southern wage rate w¯S is decreasing with γ (that is, increasing
with the degree of IPR protection).
4.2 Effects of Subsidy Policies
In this subsection, we explore the effects of industrial policies through subsidies on R&D and technology transfer. In the previous subsection, we confirmed that the Southern govern-ment can encourage innovation and technology transfer by restricting imitation activities. In addition, government authorities are probably also concerned with subsidizing license negotiations and R&D for the sake of more directly promoting innovation and technology transfer. Hence, we examine whether or not governments can promote such activities by partly bearing the cost of license negotiations and R&D. Throughout the analysis in this section, the subsidies are assumed to be financed by lump-sum taxes.
4.2.1 Subsidies on license negotiation
We first consider the effects of subsidies on license negotiations by the Southern govern-ment. Let sL ∈ [0,1) be the subsidy rate on the cost of license negotiations. The subsidy
improves the profitability of Southern follower firms under license negotiation. That is, by engaging in license negotiations, a Southern follower firmican earn the instantaneous ex-pected profit[(1−δ)VL−(1−sL)wSa
L]˜ιi. Therefore, the introduction of subsidies modifies
the zero-profit condition and yields the following relation:
¯
wS = (1(1−−δ) ¯VL sL)aL.
(24)
IfsLis equal to zero, this equation reduces to equation (13). Moreover, this equation shows that an increase in the rate of subsidy, other things being equal, pushes the Southern wage rate up because Southern follower firms wish to negotiate harder license contracts with the
Northern patent holder owing to a reduction in the cost of negotiation.
To determine a new pair ofI¯andn¯N, we compute new NL and SL curves. From equa-tions (10), (12), and (24), we have the following new NL curve:
¯ nN = (1−δ)(λ−1) aL ˆΦ(¯I;sL), (25) where ˆΦ(¯I;sL) ≡(LN −a NI¯)/[(1−sL)(¯I+mγ+ρ)]. Similarly, substituting (12), (17),
and (24) into (11), we obtain the new SL curve as follows:
¯ nN = 1−(1−δ)(λ−1)L S aL ˆ Ψ(¯I;sL), (26) whereΨ(¯ˆ I;sL)≡( ¯I+mγ)/[(1−sL)(¯I+mγ+ρ)( ¯I+mγλ) + (1−δ)(λ−1)¯I( ¯I+mγ)].
The labor market clearing of both countries requiresI¯andn¯N to satisfy both equations (25)
and (26).
Next, we totally differentiate equations (25) and (26) and examine the effects of the subsidies on license negotiation. Totally differentiating equation (25) implies that:
dn¯N = (1−δ)(λ−1) aL(1−sL) −LN +aNmγ+aNρ ( ¯I +mγ+ρ)2 dI¯+ ˆΦ( ¯I;sL)dsL . (27)
This equation shows that n¯N must increase with an increase in the subsidy rate sL for a
givenI¯to maintain equilibrium in the Northern labor market. Namely, the NL curve rotates clockwise with an increase in the subsidy rate as shown in figure 2. This is because an increase insLenables each Northern leader to set higher prices through the increase in the Southern wage rate and leads to lower labor demands by incumbent leaders for any givenI¯ andn¯N. As a result, n¯N must be higher than before to clear the Northern labor market, if
Meanwhile, from equation (26), we have: d¯nN = (1−δ)(λ−1)LSΨ(¯ˆ I;s L) 2 aL × [(1−sL)A+sL(1−δ)(λ−1)]dI¯− ( ¯I+mγ¯+ρ)( ¯I+mγλ) I+mγ dsL .(28)
This equation shows that ¯nN must decrease with an increase in the subsidy rate sL for a given I¯to maintain equilibrium in the Southern labor market. Thus, the SL curve moves downwards as in figure 2. This is due to the same reasoning as shown in the Northern labor market: namely, an increase in sL decreases the labor demands of incumbent producers
through an increase in the Southern wage rate for any givenI¯andn¯N, so that¯ι¯nN, which is
equal toI¯(1−n¯N)from equation (17), must be higher than before. Therefore,1−n¯N must increase with the increase in the subsidy rate in order to clear the Southern labor market ifI¯ is unchanged by the policy modification.
An increase in the subsidy rate moves the intersection in figure 2 from E to E. As a consequence, we can immediately confirm that innovation intensity increases in the new steady state. However, whethern¯N increases or not is again unclear from the figure, so we
next compute∂n¯N/∂sL. For tractability, we suppose that the initial subsidy rate is set equal
to zero and examine the effect of a marginal increase in the rate. Substituting equation (28) into (27) and applyingsL = 0, we obtain:
⎡ ⎢ ⎣1 + L N +a Nmγ+aNρ ALS( ¯I+mγ+ρ)2Ψ(¯ˆ I; 0)2 ⎤ ⎥ ⎦dn¯N =− (1−δ)(λ−1) aL (LN +a Nmγ+aNρ)(¯I +mγλ) A( ¯I+mγ)(¯I+mγ+ρ) −ˆΦ(¯I; 0) dsL.
This equation implies that∂n¯N/∂sL|sL=0 <0because(LN+a
Nmγ+aNρ)( ¯I+mγλ)/[A( ¯I+
mγ)(¯I + mγ+ ρ)] > Φ( ¯I;γ) = ˆΦ( ¯I; 0) from condition (19) and from the assumption thatLS ≥ (a
∂(¯ιn¯N)/∂sL|sL=0 are positive: that is, a marginal increase in the subsidies on license
nego-tiation from zero can also promote licensing. These results are summarized as follows.
Proposition 2 Suppose that the initial rate of a subsidy on license negotiation is zero. Then,
a marginal subsidy on license negotiation can promote innovation and licensing.
How does the subsidy on license negotiation affect the Southern wage rate w¯S? The
subsidy has an effect on the Southern wage ratew¯S through two channels:
∂w¯S ∂sL = 1−δ (1−sL)2aL ¯ VL+ 1−δ (1−sL)aL ∂V¯L ∂sL = (1−δ)(λ−1) (1−sL)aLλ( ¯I+mγ+ρ)2 ¯ I+mγ+ρ 1−sL − ∂I¯ ∂sL . (29)
The first term represents a direct effect, whereas the second term is an indirect effect through
¯
VL. Since an increase insL, other things being equal, reduces negotiation costs, the Southern
wage rate must be higher than before to attain zero profits in the negotiation activities. On the other hand, the highersLalso raises innovation intensityI¯, so that it lowers the stock value
of licensee firmsV¯L through increasing the danger of being replaced by a higher-quality
product. This second effect has a negative influence on the Southern wage rate.
Although the two effects have different signs to each other, the direct positive effect always dominates the indirect negative effect if the initial subsidy rate is zero and condition (19) is satisfied. Substituting (27) into (28) and applyingsL = 0, we have:
∂I¯ ∂sL sL=0 = (¯I+mγ+ρ) (¯I+mγ)(LN−a NI¯) +LS(¯I+mγλ)(¯I+mγ+ρ)2 ˆΨ(¯I; 0)2 (¯I+mγ)(LN+aNmγ+aNρ) +LSA(¯I+mγ)(¯I+mγ+ρ)2ˆΨ(¯I; 0)2 . Using this equation and condition (19), we can show that∂I/∂s¯ L|sL=0<I¯+mγ+ρ. Thus, from equation (29),∂w¯S/∂s
L|sL=0 >0, namely, the marginal rise of the subsidy rate from
4.2.2 Subsidies on R&D
We now turn our analysis to the effects of subsidies on R&D by the Northern government. LetsR ∈ [0,1) denote a subsidy rate on R&D chosen by the Northern government. As in the subsidies on license negotiation, subsidies on R&D improve the profitability of Northern firms engaging in R&D. Namely, a Northern follower firmithat undertakes R&D can earn the instantaneous expected profit[VN −(1−sR)wNaN] ˜Ii. Hence, introduction of subsidies
alters the zero-profit condition and replaces equation (14) with the following:
¯
wN = (1−V¯N sR)aN.
However, this modification does not bring any change in both the NL and SL curves be-cause the labor market-clearing conditions in both countries are independent of the Northern wage rate (see equations (10) and (11)). Thus, neitherI¯nor¯ιare influenced at all by subsi-dies on R&D. We can summarize this result as the following proposition.
Proposition 3 Subsidies on R&D have no influence on innovation and licensing.
In addition, because innovation intensity is not influenced by the policy modification, the stock value of Southern licensee firms, V¯L, is also unchanged. As a result, a subsidy on
the cost of R&D has no influence on the Southern wage rate. Hence, the subsidy policy on R&D, which is intended for promoting innovation in this model, can only affect the wage gap between the North and the South.
4.3 Effects of a Change in Profit Division
The determination of a profit division rule between a licensor and a licensee has been as-sumed to be dependent on the bargaining power between the licensor and a licensee. The bargaining power may be affected by a change in the contracting environment, for example, the revision of commercial law and a change in the enforcement of patent law. Hence, in
this subsection, we examine how an alteration of the rate of license fee influences innovation and licensing.
Consider that the licensors’ share of profitδincreases marginally from the initial value. Because the lower expected return induced by the higher license fee is insufficient to pay the negotiation cost, a higher licensors’ share deteriorates the profitability of Southern firms en-gaging in negotiation. Therefore, to restore zero profits in negotiation activities, the Southern wage ratew¯S must fall to a new equilibrium ifI¯were to be left unchanged. Because of the
limit-pricing strategy, the decrease of the Southern wage rate leads to higher labor demand by each incumbent leader. Hence, the improvement of licensors’ share of profit makes the fraction of products manufactured in the North,n¯N, impossible to retain at the same level as before for a givenI¯, so the NL curve is pressured to rotate counterclockwise. In fact, by totally differentiating the NL curve (16), we obtain:
d¯nN =−λ− 1 aL (1−δ)(LN +a Nmγ+aNρ) ( ¯I +mγ+ρ)2 dI¯+ Φ(¯I;γ)dδ . (30)
From this relationship, we can confirm thatn¯N must fall with a rise ofδ for any givenI¯to
be consistent with equilibrium in the Northern labor market.
A similar argument to the NL curve is also applied to the SL curve. Totally differentiat-ing the SL curve (18) gives the followdifferentiat-ing relation:
dn¯N = LS(λ−1)Ψ(¯I;γ)2 aL (1−δ)AdI¯+ ( ¯I+mγ¯+ρ)( ¯I+mγλ) I+mγ dδ . (31)
Because of the pricing rule, the fall of the Southern wage rate generates additional labor demand by each Southern firm to manufacture the product. Therefore, the rise ofδ makes the fraction of products manufactured in the South,n¯L+ ¯nM, inevitably to decrease for a givenI¯. In consequence, the SL curve is required to shift upwards.
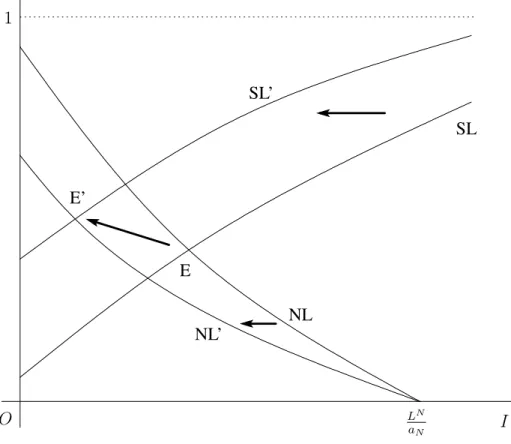
figure shows, a rise in the rate of the license fee δ induces the intersection to move left-wards and the innovation intensity I¯to unambiguously decrease. However, figure 3 does not explain whether the change raisesn¯N or not. Therefore, we must compute∂n¯N/∂δto determine the signs of∂¯ι/∂δand∂(¯ιn¯N)/∂δ.
Substituting equation (31) into (30) to eliminate the term ofdI¯, we have: ⎡ ⎢ ⎣1 + (L N +a Nmγ+aNρ) ALS( ¯I+mγ+ρ)2Ψ(¯I;γ)2 ⎤ ⎥ ⎦dn¯N = (λ−1) aL (LN +a Nmγ+aNρ)( ¯I+mγλ) A( ¯I+mγ)(¯I+mγ+ρ) −Φ( ¯I;γ) dδ. Recall that (LN +a Nmγ+aNρ)(¯I +mγλ)/[A( ¯I+mγ)( ¯I +mγ+ρ)] > Φ( ¯I;γ)from
condition (19) and from the assumption thatLS ≥(a
L/aN)LN. Hence, this equation implies
that∂n¯N/∂δ >0. Moreover, from the result and equation (17), we obtain∂¯ι/∂δ < 0and ∂(¯ιn¯N)/∂δ <0. Namely, a higher license fee rateδreduces licensing activities.
We can summarize these results into the following proposition.
Proposition 4 A higher rate of license fee becomes an obstacle to both innovation and the
conclusion of license agreements.
This proposition contains a seemingly counterintuitive assertion: that is, the higher licen-sor’s share of profit deters not only licensing, but also innovation. However, in fact, the result is fairly natural in this model. A higher licensor’s share of profit, other things being equal, raises the stock value of a Northern leader owing to an improvement in the expected payoff the leader can obtain by reaching license agreement. This effect on the stock value must be exactly offset by a change of the Northern wage rate since innovators always attain zero profits. However, these changes do not have any influence on the degree of innovation because innovation intensity depends neither on the stock value of a Northern leader nor on the Northern wage rate (see equation (10) and (11)). In addition, more Northern labor is de-voted to manufacturing by incumbent leaders than before for two reasons. First, incumbent
leaders become less likely to reach license agreement because of a reduction in negotiation efforts by Southern follower firms. In consequence, more leaders operate in the North than before. Second, a rise inδforces the Southern wage rate down, as later verified. As pointed out earlier, a decrease in the Southern wage rate leads to higher labor demand by each in-cumbent leader. Thus, less labor can engage in R&D activities than before, and the economy incurs the situation of less innovation, despite the favorable change to the licensors.
We now examine how an increase in the licensor’s profit share δ affects the Southern wage rate. As discussed previously, this change lowers the Southern wage rate. We compute the partial derivative ofw¯S with respect toδto verify it:
∂w¯S ∂δ =− ¯ VL aL +1−δ aL ∂V¯L ∂δ =− (1−δ)(λ−1) aLλ( ¯I+mγ+ρ)2 ¯ I +mγ+ρ 1−δ + ∂I¯ ∂δ . (32)
This equation shows that an increase in δ brings about two effects on the profitability of license negotiation. First, other things being equal, higherδ directly impinges on licensees’ profitability, which is expressed by the first term of equation (32). On the other hand, the indirect effect through the value of a licensee firm improves profitability, as represented by the second term. This is due to an increase in the licensee’s stock value induced by the decrease in the risk of replacement by a new invention. As a result, increase inδcauses two conflicting effects. However, by computing∂I/∂δ¯ , we can confirm that the second positive effect is insufficient to compensate for the first negative effect. Substituting (30) into (31) and eliminating the termdn¯N, we have:
∂I¯ ∂δ =− ¯ I +mγ+ρ 1−δ (¯I+mγ)(LN−a NI¯) +LS(¯I+mγλ)(¯I+mγ+ρ)2 Ψ(¯I;γ) 2 (¯I+mγ)(LN+aNmγ+aNρ) +LSA(¯I+mγ)(¯I+mγ+ρ)2Ψ(¯I;γ) 2. Noting thatΨ(¯ˆ I; 0) = Ψ(¯I;γ), we can show that ∂I/∂δ >¯ −( ¯I +mγ +ρ)/(1−δ)in the same way as the proof of∂I/∂s¯ L|sL=0 <I¯+mγ+ρ. Thus, we can conclude that the
Southern wage rate is decreasing with the profit share of licensors from equation (32), that is,∂w¯S/∂δ <0.