Robust and Resilient Strategies for Managing Supply Disruptions in an
Agribusiness Supply Chain
Golnar Behzadi*a, Michael Justin O’Sullivana, Tava Lennon Olsenb, Frank Scrimgeourc, Abraham Zhangc,d
aDepartment of Engineering Science, Faculty of Engineering, The University of Auckland, Auckland 1010, New Zealand bInformation Systems and Operations Management, Business School, The University of Auckland, Auckland 1010, New Zealand
cUniversity of Waikato Management School, Hamilton 3240, New Zealand
dAuckland University of Technology (AUT) Business School, AUT, Auckland 1010 New Zealand
Abstract
Agribusiness supply chains involve more sources of uncertainty than typical manufacturing supply chains due to attributes such as long supply lead-times, seasonality, and perishability. Therefore, it is critical but challenging to mitigate risks in agribusiness supply chains. However, the extant literature includes limited quantitative research on robust and resilient strategies for agribusiness supply chain risk management, particularly when perishability is explicitly modeled. In this paper, we investigate the effectiveness of a mixed set of robust and resilient strategies for managing rare high-impact harvest time and yield disruptions. We develop a two-stage stochastic programming model, which integrates an exponential perishability function, to conduct our analysis. The model maximizes the expected profit by selecting optimal risk management strategies and making tactical supply chain planning decisions. The model is applied to a numerical case study of a real-world kiwifruit supply chain. The results suggest that a mixed combination of robust and resilient strate-gies are most effective for mitigating supply-side disruption risks. Furthermore, as perishability increases, risk management strategies provide a greater relative improvement in the expected profit. Keywords:
Agribusiness supply chain, Risk management, Robust, Resilient
1. Introduction
During the past two decades, supply chain risk management has attracted considerable attention for several reasons [13]. First, globalization has increased the length and complexity of supply chains, and consequently their exposure and vulnerability to risks. Second, the lean management philoso-phy has been widely adopted in supply chains. It has made supply chains more vulnerable under adverse events due to the removal/reduction of redundancies. Finally, many supply chains have been severely disrupted by catastrophic events including the September 11 terrorist attacks in 2001 and the Fukushima nuclear disaster in Japan in 2011. As a result, more and more businesses have recognized the importance of supply chain risk management [40, 42, 13].
Risk management is especially important to agribusiness supply chains (ASCs) as they involve more sources of uncertainty in comparison with typical manufacturing supply chains. Agricultural products face inherent uncertainties in their biological production processes [11, 9]. Variable weather conditions, diseases, and pests all could significantly affect the timing, yield, and quality of a har-vest. In addition, uncertainties may arise because of animal welfare legislation [30] and bio-security control for imports/exports. Further, agriculture products have particular attributes such as long supply lead-times, seasonality, and perishability. Long supply lead-times limit the possibility of a quick replacement in case of a shortage [32]. Perishability means ASCs are time-critical [24] and require advanced planning for harvesting, storage, and transportation. Seasonality results in unbal-anced supply and demand cycles (i.e., the production is seasonal but the consumption is all year round). It also makes post-harvest management very demanding because of supply spikes and time pressures [2, 4, 44].
Broadly speaking, risk management strategies can be categorized as either robust or resilient. A robust supply chain is able to withstand disturbances, maintain its original structure, and stay functional in uncertainties; while a resilient supply chain can quickly return to its original state or move to a new and more desirable state after being disrupted [12, 41, 10, 29]. Two recent conceptual papers [22, 23] suggested that both robustness and resilience are essential capabilities for effective supply chain risk management. However, to our surprise, extant studies in ASC risk management have largely treated them separately. As an exception, [24] considered both robust and resilient strategies for a dairy supply chain and will be discussed in Section 2. However, they do not consider holding inventory, so perishability is not explicitly present in their model. However, they recognize that perishability is an important consideration for ASCs. In fact, generally, despite the importance of the concept, perishability has been underdeveloped in most relevant quantitative works.
To address the above-mentioned research gap, this research develops an optimization model to aid ASC planners to choose from a set of robust and resilient strategies with a realistic consideration of perishability. Our optimization method guarantees an optimal decision, which may be a robust strategy, a resilient strategy, or a combination of both. To achieve sufficient depth in the investiga-tion, we focus on two important supply-side risks: harvest time disruption and yield disruption. A harvest time disruption results in a harvest delay that is much longer than usual. A yield disruption reduces the yield of a harvest to an extent that is much greater than business-as-usual variations. This research does not consider “business-as-usual” supply uncertainties which are relatively easy to manage. In addition, demand-side risks (e.g., price-uncertainty) are outside of the scope this study. Although price uncertainty is important under some other ASC problem settings, for the cur-rent setting involving a premium fresh produce supply chain, price is considered as a known input
and no price promotion is proposed; hence, if the quality of product is reduced below the required level, products are disposed of. In addition, for premium produce, market capacities are often ahead of supply, which protects against downside demand risks.
This study is motivated by the supply disruption risks faced by Zespri, a leading kiwifruit ex-porter and brand based in New Zealand. In the early 2010s, the kiwifruit vine disease Psa-V de-stroyed almost all the gold Hort 16A kiwifruit variety in the country, which accounted for about 30 percent of export kiwifruit value [16]. We address the following research questions:
• Which robust/resilient strategies are effective for managing risks of harvest time and yield disruptions?
• How would the effectiveness of robust/resilient strategies vary for harvest time disruption and yield disruption?
• How does perishability impact on the effectiveness of these strategies?
We build a two-stage stochastic programming model to conduct an analysis for answering these questions. In the first stage, the optimization model selects risk management strategies from a set of robust/resilient strategies. In the second stage, the model makes sourcing, inventory, distribution, and sales decisions based on the actual realization of disruption scenarios. The model maximizes the expected profit while satisfying constraints in supply, demand, and transport capacities. Perishabil-ity is modeled through an exponential perishabilPerishabil-ity function with qualPerishabil-ity barriers. We apply the model to Zespri’s kiwifruit supply chain to investigate the effectiveness of robust/resilient strate-gies under harvest time and yield disruptions. We provide answers to the research questions after extensive sensitivity analysis of perishability and the cost of implementing robust/resilient strate-gies. Although our findings are derived from a specific ASC, we expect them to be generally valid for typical ASCs under a similar setting.
The remainder of this paper is organized as follows. Section 2 reviews the literature and high-lights the research gap. Section 3 describes the ASC risk management problem, develops the model, and explains the solution approach. Section 4 applies the model to a numerical case study and presents results and managerial insights. Section 5 concludes the paper.
2. Literature Review
Extensive studies have been conducted on supply chain risk management [13]. However, relatively few works dealt with specific risks in ASCs. The risks that were dealt with in ASCs are predomi-nantly high probability, business-as-usual uncertainties (with low impact) rather than rare (i.e., low probability), harsh (high impact) disruptions.On the demand side, risks related to selling price or
market capacity have received considerable attention ([27], [33], [15]). Uncertain arrival time of demand has also been investigated ([31]). On the supply side, risks are mostly referred to as un-certainties in yield quantity and supply spot price ([27], [6], [5], and [28]). A few other studies also considered production and transportation related failures and uncertainties in yield quality, harvest duration, and maturation time ([45], [39], [25], [8]). Despite their merits, all of the aforementioned studies addressed perishability superficially at best (and mostly not at all). Note that there is a fun-damental difference between yield uncertainty and perishability. Yield uncertainty is realized at the end of harvesting and does not depend on the rest of the supply chain, whereas perishability occurs throughout the supply chain and is dependent on transport and storage conditions and lead-times.
From a modeling perspective, perishability is similar to product depreciation, which requires special considerations in supply chain planning, especially in inventory management [43]. Depre-ciation has three forms, namely physical degradation (e.g., in fruit, dairy), functional loss (e.g., in medicine), and value loss (e.g., in fashion and high-tech products whose sales prices decrease over time) [37]. Depreciation can happen under different patterns, e.g., lose all utility at a certain time, lose utility at a few discrete time intervals, lose utility gradually (continuous deterioration [20]), and continuous deterioration with rework/disposal time-intervals [37]. Depreciation is often modeled by a fraction formulation or an index transformation. The former applies an exponential shrinkage or loss of a certain fraction of inventory, either using a fixed ratio (e.g.,π) or a time-dependent ratio (e.g., πt) [38]. The latter often applies a life-time variable (L) to restrict the product’s life-time to avoid deterioration in the first place using a fixed or time-dependent index(πL, πtL) [18].
Clearly, the wide range of approaches developed for modeling depreciation could be adapted to model perishability. However, the number of stochastic models that consider both perishability and disruption risk is very limited[37]. Those disruption risk studies that incorporated perishabil-ity used very basic approaches such as a newsvendor problem formulation (see [27]) or setting a maximal storage time (see [17]). Article [24] did consider time criticality caused by perishability; however, the paper did not consider inventory holding and related challenges. As an exception, [8] modeled perishability using an exponential decay cost. The study incorporated two shelf-life met-rics, namely best-before-date and good-until-time, in a vegetable supply chain problem when the main transportation link is disrupted.
Given that perishability is a critical concern in ASC risk management, there is a clear need to consider a variety of more sophisticated perishability functions for developing more realistic quan-titative models. Further, due to perishability, fresh products require special treatment in the design of supply chain strategies [3].
works in ASC risk management, e.g., the use of multiple-sourcing ([26], [25], and [7]). In recent years, however, an increasing number of studies started to embrace a resilient strategy. For instance, [27] proposed the use of a backup supply after the realization of uncertainties in yield, yield de-pendent cost, and selling price. Article [17] analyzed the same backup supply strategy for a dairy supply chain under milk supply uncertainty. Article [8] suggested a resilient strategy to reroute fruit between two markets after a disruption.
Nevertheless, except [24], little modeling research has considered both robust and resilient strate-gies. This important work analyzed a robust strategy (multiple sourcing) and two resilient strategies (backup distribution center and expensive emergency transportation) for an Australian dairy sup-ply chain. It focused on dynamic recovery policies under conditions of ripple effect from potential natural disasters in Australia. It employed an operative predictive control model and illustrated a number of risk management policies on a simulation-based example. These strategies are utilized by informing appropriate preventive or reactive adoption levels under disruptions. Although mixed robust and resilient risk management strategies are considered in [24], they do not consider holding inventory, so perishability is not explicitly present in their model.
To sum up, the scope of risk management studies is particularly limited in the context of ASCs, especially when appropriate measures for perishability are integrated for managing harsh rare dis-ruptions. This limitation is a critical omission given the additional vulnerability of ASCs associated with their particular product characteristics and inherent uncertainties. Moreover, as supply chains operate under various types of uncertainties, it is necessary to consider a mixed set of robust and resilient strategies that are compatible with each type of risk. Further, there is an obvious lack of optimization research that considers both robust and resilient strategies for ASC risk management, particularly while explicitly including perishability. The following sections address this gap by de-veloping an optimization model that integrates an exponential perishability function. The model is applied for analyzing a mixed set of robust/resilient strategies for managing supply-side harsh disruptions in an ASC.
3. Problem Definition and Model Formulation
In this section, we define the research problem and model assumptions in §3.1. §3.2 formulates the two-stage stochastic optimization model. §3.3 describes the solution procedure.
3.1. Problem Definition and Model Assumptions
The proposed research problem is a strategic-tactical planning problem in an ASC network. At a strategic level, decision makers need to select optimal risk management strategies from a mixed set
of robust/resilient strategies. As mentioned earlier, we focus on two types of supply-side disruption risks: harvest time disruption and yield disruption. Based on learnings from seasoned practitioners, we consider the following three strategies that are likely to be effective to mitigate risks of these two disruption types.
1. Backup supply (BU.Sup.) – this is a resilient strategy that provides flexibility to obtain supplies from one or more backup sources in the event of a harvest time or yield disruption. The backup sources are activated only in case of a supply disruption.
2. Moderating disruption probability (M od.P r.) – this is a robust strategy that moderates the probability of a disruption on a vulnerable supply chain node/arc. For example, an orchard could install high-tech planting and irrigation systems to reduce the chance of being disrupted by harsh weather [19].
3. Multiple suppliers (M u.Sup.) – this is a robust strategy that mitigates disruption risk by sourc-ing from multiple suppliers, or by enlargsourc-ing the supply base to include new suppliers. In case a supply node is disrupted, market demand could still at least be partially fulfilled by the remaining suppliers.
For comparison purposes, we also consider a risk acceptance strategy (m0), which does not do
any-thing to mitigate disruption risks and simply accepts the risk consequences.
Figure 1 presents tactical decision variables in a simplified multi-period multi-commodity ASC network. The two-echelon network consists of pairings of a supply location and a commodity (an aggregation of growers, pack-houses, and supply-side storage facilities for a given commodity) and pairings of a demand location and a commodity (an aggregation of markets and market-side storage facilities for a given commodity).
, , , , , Period , , , , , Period , Period Sup., Comm. Dem., Comm. Period
Figure 1: The simplified ASC network with tactical decision variables
In Figure 1 ,siktωmdenotes the supply variable for the commodityk∈Kat supply locationi∈I in periodt ∈ T under scenarioω ∈ Ωand risk management strategy m ∈ θ. Note that the supply
variable is dependent on the strategy selected; however, other supply chain variables are indepen-dent of strategy selected. These variables includehiktωandhjktω (the inventory of commodity held at supply storageior demand storagejin the time periodtand scenarioω),xijktω(i.e., the shipment of commoditykfrom supply locationito demand locationj in the time periodtand scenarioω ), andyjktω (i.e., the sales of commoditykat the demand locationj in the time periodtand scenario
ω ). Variables ϕi(k, t−1,1), ϕj(k, t+l(i, j)−1,1), andϕij(k, t, l(i, j))show the decay process in different supply chain stages. A summary of notation is provided in Appendix A.
As reviewed in §2, a comprehensive set of formulations have been developed for modeling prod-uct depreciation. Among these well-established formulations, we adopt a fractional formulation to model perishability. However, the fraction we use is neither fixed nor time-dependent but is commodity-dependent, denoted byπ(k). In addition to the perishability fraction, our perishability function depends on the following elements: k- the type of commodity; t0- the time that a
com-modity starts a particular stage in the ASC network (e.g., inventory holding/shipping); and ∆t -the duration that a commodity spends in -the stage. We consider homogeneous perishability (e.g.,
π(k, t) =π(k);∀t) given that cold storage is often used throughout an ASC. The perishability func-tion (ϕ(k, t0,∆t)) is defined in (1) . ϕn(k, t0,∆t) =ϕij(k, t0,∆t) =ϕ(k, t0,∆t) = t0+∆t Y t=t0 (1−π(k)) = (1−π(k))∆t,∀locationsn,
∀pairs of supply/demand locations(i, j).
(1)
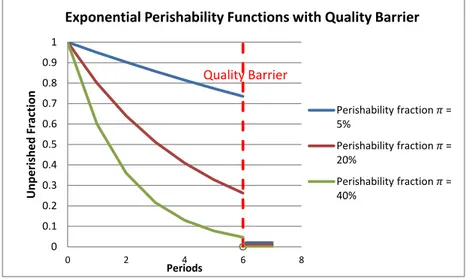
The unperished fraction is determined only by the duration of inventory holding/shipping with a constant exponential commodity-dependent loss rate. However, we limit the maximal duration by an upper-bound (i.e., quality barrier) as depicted in Figure 2. As illustrated, all products that are over 6 months old will be considered as perished. This policy is set in line with the high quality standard of a premium brand.
0 0.1 0.2 0.3 0.4 0.5 0.6 0.7 0.8 0.9 1 0 2 4 6 8 Unp e ri sh e d Fr ac tion Periods
Exponential Perishability Functions with Quality Barrier
Perishability fraction 𝜋 = 5% Perishability fraction 𝜋 = 20% Perishability fraction 𝜋 = 40% Quality Barrier
Figure 2: Examples of Exponential Perishability Functions
In this problem, we define a product unit as a fruit tray. Therefore all quantity related parameters and variables are measured by fruit trays. All unit cost/price parameters and variables are measured per fruit tray. The model also has the following assumptions.
• All shipments (xijktω) are made at the end of a time period.
• The sales price (p(j, k, t, ω), i.e., price of commoditykin marketjat timetunder scenarioω) is taken from the market and is treated as an input parameter.
• The decay process is considered on supply only during inventory holding and shipping stages – noted by ϕi(k, t−1,1)andϕj(k, t+l(i, j)−1,1)for supply-side and demand-side inven-tory holding respectively and byϕij(k, t, l(i, j))for shipping (herel(i, j)is transport lead-time between supply and demand locations).
• Products that are perished or more than six months old are discarded at the end of a time period.
• Disruptions occur one at a time at all supply regions.
3.2. Two-stage Stochastic Model Formulation
Our two-stage stochastic model includes first stage here-and-now decision variables and second stage wait-and-see decision variables that are described as follows.
Here-and-Now Variables. These variables are independent of scenarios or need to be determined be-fore a scenario is realized (i.e., strategy variables and tactical supply, inventory, shipment, and sales decisions – combined inXωtbeforet˜(ω)):
zm := Binary variable for selection of strategym.
Wait-and-See Variables. These variables are determined after a scenario is realized. These are tactical supply chain decisions (Xωt) in time-periods after˜t(ω):
Xωt, t≥˜t(ω) := Set of tactical variables after realization of a scenario.
The following equation defines the profit (Pω(Xω)) under scenario-dependent tactical decisions of
Xω≡ {Xωt, t∈T}given each scenarioω∈Ω.
Pω(Xω) = X j∈J X k∈K X t∈T p(j, k, t, ω)yjktω | {z } Sales Revenue −X j∈J X k∈K X t∈T ch(j, k, t)hjktω | {z }
Holding Cost at Demand Nodes
−X i∈I X k∈K X t∈T X m∈θs∪{m 0} cs(i, k, t, m)siktωm | {z } Supply Cost −X i∈I X k∈K X t∈T ch(i, k, t)hiktω | {z }
Holding Cost at Supply Nodes
−X i∈I X j∈J X k∈K X t∈T cx(i, j, k, t)xijktω | {z } Transportation Cost ,∀ω∈Ω. (2)
There is a fixed cost (fm) associated with implementing a risk management strategy (zm). The total cost of implementing risk management strategies (F(zm)) is defined by equation (3).
F(zm) =
X
m∈θ
fmzm. (3)
There are technical challenges associated with selecting a mixed set of robust/resilient strategies. To overcome the challenges, we classify all robust/resilient strategies as being supply-based (m∈θs) and probability-based (m ∈ θpr). A given strategy must belong to at least one of these two sets. A risk acceptance strategy (m0) is independent of the strategy sets defined.
Supply-based Risk Management Strategy Setθs.
The supply-based strategiesm ∈θsaffect both the supply costcs(i, k, t, m)and the supply bounds
s(i, k, t, ω, m) ands(i, k, t, ω, m). Where supply-bounds appear in the model constraints, they are multiplied by a term related to our strategy-selection decision variable (i.e.,zm as described in
con-straints (4) and (5)). s(i, k, t, ω, m0)(1− X m∈θs zm)≤siktωm0 ≤s(i, k, t, ω, m0)(1− X m∈θs zm), ∀i∈I, k∈K, t∈T, ω ∈Ω. (4) s(i, k, t, ω, m)zm≤siktωm ≤s(i, k, t, ω, m)zm, ∀i∈I, k∈K, t∈T, ω∈Ω, m∈θs. (5)
Because of the interaction of supply bounds, the model does not allow more than one supply-based strategy to be selected (although this may occur in practice). To overcome this technical issue, we defineM B.Sup=BU.Sup.∩M u.Supin the supply-based strategy set. By selectingM B.Sup, the model is still technically selecting one strategy and not two strategies (i.e.,BU.Sup.andM u.Sup).
Probability-based Risk Management Strategy Setθpr.
The probability-based strategiesm ∈ θpr reduce the disruption likelihood (P r(ω)) and conversely increase the probability of the base scenario (P r(ω0)). Thus, for eachm ∈ θpr there are probability
adjustments ∆P r(ω, m) for all ω ∈ Ωthat affect the expected total profit. As similarly explained for supply-based strategies, to prevent the interaction of the probability adjustments, at most one probability-based strategy can be selected in a risk management plan.
X
m∈θ
fmzm
| {z }
fixed cost for risk management + [P r(ω0) + X m∈θpr ∆P r(ω0, m)zm] | {z }
adjusted probability for base scenarioω0
Pω0(Xω0)
| {z }
adjusted performance for base scenarioω0
+ X ω∈Ω\{ω0} [P r(ω)− X m∈θpr ∆P r(ω, m)zm] | {z }
adjusted probability for scenarioω
Pω(Xω)
| {z }
adjusted performance for other (disruption) scenarios
= X m∈θ fmzm+ X ω∈Ω P r(ω)Pω(Xω) | {z }
unadjusted performance for all scenarios + X m∈θpr ∆P r(ω0, m)zmPω0(Xω0) | {z } adjustment toω0 − X ω∈Ω\{ω0} X m∈θpr ∆P r(ω, m)zmPω(Xω) | {z }
adjustment to other (disruption) scenarios
.
(6)
Form∈θpr, the effective adjustment to the expected profit is obtained by (7).
X m∈θpr ∆P r(ω0, m)zmPω0(Xω0)− X ω∈Ω\{ω0} X m∈θpr ∆P r(ω, m)zmPω(Xω). (7)
Based on the definitions given above, we can now formulate the two-stage stochastic optimiza-tion model. Maximize: X m∈θ −f(m)zm+ X m∈θpr ∆P r(ω0, m)zmPω0(Xω0)− X ω∈Ω\{ω0} X m∈θpr ∆P r(ω, m)zmPω(Xω) + X ω∈Ω P r(ω)Pω(Xω) (8) Subject to: Pω(Xω) = X j∈J X k∈K X t∈T p(j, k, t, ω)yjktω − X j∈J X k∈K X t∈T ch(j, k, t)hjktω− X i∈I X k∈K X t∈T X m∈θs∪{m 0} cs(i, k, t, m)siktωm −X i∈I X k∈K X t∈T ch(i, k, t)hiktω− X i∈I X j∈J X k∈K X t∈T cx(i, j, k, t)xijktω,∀ω∈Ω. (9) X m∈θs∪{m 0} sik1ωm=hik1ω+ X j∈J,t+l(i,j)≤|T| xijk1ω, ∀i∈I, k∈K, ω∈Ω (t= 1). (10) X m∈θs∪{m 0}
siktωm+ϕ(k, t−1,1)hikt−1ω=hiktω+
X j∈J,t+l(i,j)≤|T| xijktω, ∀i∈I, k∈K, t∈T, t >1, ω∈Ω. (11) X i∈I,l(i,j)=0 ϕ(k, t−l(i, j), l(i, j))xijkt−l(i,j)ω =yjktω+hjktω, ∀j∈J, k∈K, t∈T, t−l(i, j)∈T, ω ∈Ω. (12) X i∈I,t>l(i,j) ϕ(k, t−l(i, j), l(i, j))xijkt−l(i,j)ω+ϕ(k, t−1,1)hjkt−1ω=yjktω+hjktω, ∀j∈J, k∈K, t∈T, t >1, ω ∈Ω. (13) s(i, k, t, ω, m0)(1− X m∈θs zm)≤siktωm0 ≤s(i, k, t, ω, m0)(1− X m∈θs zm), ∀i∈I, k∈K, t∈T, ω ∈Ω. (14)
s(i, k, t, ω, m)zm≤siktωm ≤s(i, k, t, ω, m)zm, ∀i∈I, k∈K, t∈T, ω∈Ω, m∈θs. (15) X m∈θs zm≤1 (16) X k∈K(r) yjktω ≤d(j, r, t),∀j∈J, r∈R, t∈T, ω ∈Ω. (17) X m∈θpr zm≤1 (18) X j∈J,t+l(i,j)≤|T| xijktω≤x(i, k, t), ∀i∈I, k∈K, ω∈Ω, t∈T,∃j∈J, t+l(i, j)≤ |T|. (19) Xωt<˜t(ω)=Xω0t, ∀t <˜t(ω)∈T, ω ∈Ω. (20) siktωm ≥0, i∈I, k ∈K, t∈T, ω ∈Ω, m∈θs∪ {m0}, yjktω ≥0, j ∈J, k∈K, t∈T, ω∈Ω, xijktω≥0, i∈I, j ∈J, k∈K, t∈T, ω ∈Ω, hnktω ≥0, n∈N, k∈K, t∈T, ω ∈Ω, zm ∈ {0,1}, m∈θ. (21)
The objective function in (8) maximizes the expected profit under a supply-side disruption. Con-straint (9) is a linear expression of the scenario-dependent profit. ConCon-straints (10) and (11) balance the flow of products in supply-side nodes by considering inventory holding, shipment, and supply in balance. The perishability function is incorporated to account for perishability loss. Similarly, constraints (12) and (13) balance the flow of products in demand-side nodes by considering inven-tory holding, shipment, and sales. Constraints in (14) set supply bounds under a risk acceptance strategy. Constraints in (15) set supply bounds under a supply-based risk management strategy. Constraint (16) ensures the selection of a maximum one strategy among all supply-based strategies. Constraint (17) is a market capacity constraint. Constraint (18) ensures the selection of maximum one strategy among all probability-related strategies. Constraints in (19) define transport capacities.
Constraint (20) is a non-anticipatory constraint that ensures decisions made in different yield dis-ruption scenarios are consistent before a disdis-ruption occurs. Constraint (21) defines non-negative and binary variables.
3.3. Model Transformation and Solution Method
The model presented above is difficult to solve directly because it has quadratic termszmPω(Xω)and
zmPω0(Xω0)in the objective function (8). Although mixed-integer quadratic programming (MIQP)
problems can be solved optimally, it is easier in general to solve a mixed-integer linear programming (MILP) problem. Thus, we employ the Big-M method to transform the model to from a MIQP problem to a MILP problem. We define new variablesKω0mandKωm, ω ∈Ω\ω0 as the changes in
the expected profit whenm ∈θpr is applied under base-case and disruption scenarios respectively. We then rewrite the objective function as follows.
X m∈θpr fmzm+ X ω∈Ω P r(ω)Pω(Xω) + X m∈θpr Kω0m− X m∈θpr X ω∈Ω\ω0 Kωm. (22)
The following additional constraints (23) to (26) are required for the model transformation. In these constraints,M is defined as a sufficiently large number.
Kωm−∆P r(ω, m)Pω(Xω)≤M(1−zm),∀ω∈Ω, m∈θpr. (23)
Kωm−∆P r(ω, m)Pω(Xω)≥ −M(1−zm),∀ω∈Ω, m∈θpr. (24)
Kωm≤M zm,∀ω∈Ω, m∈θpr. (25)
Kωm≥ −M zm,∀ω∈Ω, m∈θpr. (26)
The model’s computational complexity is largely determined by the number of integer variables. Due to the relatively small number of scenarios in our problem, we are able to use the branch-and-cut algorithm to solve the deterministic equivalent of the stochastic model. The branch-and-branch-and-cut algorithm integrates the branch-and-bound and the cutting plane algorithms. It can efficiently solve the problem by recursively dividing the original problem into sub-problems, which correspond to nodes of an enumeration tree [49]. The solution method is implemented using the COIN-OR Branch and Cut (CBC) solver. The scenarios applied to our problem are designed based on interviews with Zespri employees and historical data on harvest time and yield. The scenario details are provided in the following case study section.
4. Numerical Case Study
In this section, we apply the model to study Zespri’s kiwifruit supply chain [47]. We first describe the simplified case in §4.1 and then present the results and managerial insights in §4.2.
4.1. Case Description
Zespri supplies over 120 million kiwifruit trays every year, about 30 percent of the global production volume [47]. Its primary supply base is New Zealand, especially the Bay of Plenty (BoP) region [21], [48]. In recent years, Zespri has started to source globally and risk mitigation has been one of the reasons behind the move [1]. To simplify the case, we aggregate all New Zealand supplies into two sources: Bay of Plenty and other NZ suppliers. We consider Italy a backup supply source under a resilient backup supply strategy. Cold storage is used throughout the supply chain to keep the fruit fresh.
Zespri sells kiwifruit in more than 53 countries. This case study considers its three largest mar-kets: Europe, Japan, and the rest of Asia [48]. These markets are also the most profitable, with sales prices averaging $9.39, $16.57, and $14.05 per fruit tray respectively [36]. To protect its premium brand image, Zespri fixes sales prices in each market in a sales season regardless of supply sources. It does not use price promotions to clear fruits that have a deteriorated quality but instead disposes of them. Figure 3 provides a schematic diagram of the ASC network with supply (S) and demand (D) nodes shown. D1 D3 D2 S3 S2 S1 Key:
Supply locations (red squares)
S1 = Bay of Plenty, S2 = Other NZ suppliers, S3 = Italy, Demand locations (blue circles)
D1 = Europe, D2 = Japan, D3 = Other Asian markets
Figure 3: Simplified ASC network nodes
The planning horizon includes 12 monthly periods. In New Zealand, kiwifruit are usually har-vested in March, April, May, and June. These months form our base harvest time scenario. Given
the base scenarioω0 and risk acceptance strategy m0, supply upper-bounds are presented in Table
1. Note that all kiwifruit varieties are aggregated into a single product (r= 1) but the commodity is differentiated by supply sources and harvesting times. Hence, the case study is a multi-commodity problem.
Table 1: Supply upper-bounds(i, k, t, ω0, m)(million trays)
Supply Commodity RM MAR APR MAY JUN
Locationi k≡(i, r,ˆt) Strategiesm t= 3 t= 4 t= 5 t= 6 1 (1, 1, 3) ∀m∈θ\ {M u.Sup.} 40 0 0 0 1 (1, 1, 4) ∀m∈θ\ {M u.Sup.} 0 40 0 0 1 (1, 1, 5) ∀m∈θ\ {M u.Sup.} 0 0 15 0 1 (1, 1, 6) ∀m∈θ\ {M u.Sup.} 0 0 0 5 2 (2, 1, 3) ∀m∈θ 8 0 0 0 2 (2, 1, 4) ∀m∈θ 0 8 0 0 2 (2, 1, 5) ∀m∈θ 0 0 3 0 2 (2, 1, 6) ∀m∈θ 0 0 0 1
Source: Compiled by the authors from [35, 14].
For suppliers from New Zealand (i = 1,2), Zespri has a legal obligation to take a minimum of
80%of supplies that meet its quality specifications [14]. However, it has no such an obligation for the backup supply (Italy). Thus, we have supply lower-bounds defined as follows.
s(i, k, t, ω, m) = 0.8s(i, k, t, ω, m0) i= 1,2 0 i= 3 , k∈K, t∈T, m∈θ\ {M u.Sup.}.
Data for demand upper-bounds are estimated in Table 2. Note that the early periods have the highest demand capacities because of the different harvest times in the Northern Hemisphere (i.e., less competition) [14]. Table 3 presents estimated transport lead-times and costs per tray. Table 4 presents supply costs paid to growers and inventory holding cost parameters.
Table 2: Demand upper-boundd(j, r, t)(million trays)
Demand Product JAN FEB MAR APR MAY JUN JUL AUG SEP OCT NOV DEC
Locationj r t= 1 t= 2 t= 3 t= 4 t= 5 t= 6 t= 7 t= 8 t= 9 t= 10 t= 11 t= 12
1 1 11 11 11 11 11 9 9 4 4 4 4 4
2 1 8 8 8 8 4 4 4 2 2 2 1 1
3 1 9 9 9 9 6 5 5 3 3 2 2 2
Table 3: Supply to market transport lead-timelij(months) and costscx(i, j, k, t) Demand Locationj Supply Locationi 1 2 3 1 2 ($0.20) 1($0.10) 1($0.10) 2 2($0.20) 1($0.10) 1($0.10) 3 2($0.20) 1($0.10) 1($0.10)
Source: Compiled by authors from [21, 46, 34, 14].
Table 4: Supply cost ($ per tray) and inventory holding cost parameters for allk∈K, t∈T and the RA strategym0 (if applicable)
Parameter Location Value
Supply costcs(i, k, t, m0) ∀i= 1,2,$1.20
Supply costcs(i, k, t, m0) ∀i= 3, $1.00
Supply-side inventory holding costch(i, k, t) ∀i= 1,2,$0.12 Supply-side inventory holding costch(i, k, t) ∀i= 3, $0.10 Demand-side inventory holding costch(j, k, t) ∀j ∈J, $1.00
Source: Compiled by authors from [21, 46, 34, 14].
We consider a harvest time disruption scenario in which the harvest at the BoP (S1) is delayed by one month but the yield is unaffected. The disruption probability is 40%. Conversely, the base scenario probability is 60%. This disruption scenario is important to Zespri because it suffers sub-stantial sales loss whenever there is a delay of bringing new season kiwifruit into its major markets. We assume a fixed cost of $8M (million) to apply a moderating disruption probability (M od.P r.) strategy to reduce the probability of a harvest time disruption by 20%. We denote the specific real-ization ofM od.P r.under harvest time disruption asm=M od.P r.H.
We consider a yield disruption at the BoP (S1) would reduce yield by 80%, either in March or April. These two scenarios are most concerning to Zespri because most kiwifruit are harvested in these two months and the BoP is its primary supply base. The probabilities of the base scenario and two yield disruption scenarios are 60% (base), 20%, and 20% respectively. Yield disruption in March is the worst-case scenario because it has greater impact on financial performance. Applying a moderating disruption probability (M od.P r.) would reduce the probability of a yield disruption in March and April by 4% (from 20% to 16%) and 16% (from 20% to 4%), respectively. However, the strategy implementation is assumed to incur a fixed cost of $1M. We denote the specific realization ofM od.P r.under yield disruption asm=M od.P r.Y.
If we use the backup supply strategy (i.e., m = BU.Sup.), the fixed cost of reserving a backup supply of eight million trays from Italy in March is estimated to be $5M. Under the multiple supplier strategy (i.e.,m = M u.Sup.), we replace four million trays of the BoP supply by an Italian source. This strategy does not have a fixed cost but an additional variable cost of $0.55 per tray. For the combined strategy (i.e.,m=M B.Sup) the costs are added.
4.2. Results, Findings, and Managerial Insights
The case problem is solved by coding the model in PuLP. The computational platform is a desktop computer that runs on Windows 7 with an Intel Core i7-4770 CPU running at 3.4 GHz and 8 GB of RAM. All experiment scenarios are solved within four CPU seconds. In §4.2.1 and §4.2.2, we present the results of harvest time and yield disruptions, respectively. In §4.2.3, we summarize the findings and managerial insights.
4.2.1. Harvest Time Disruption Experiments
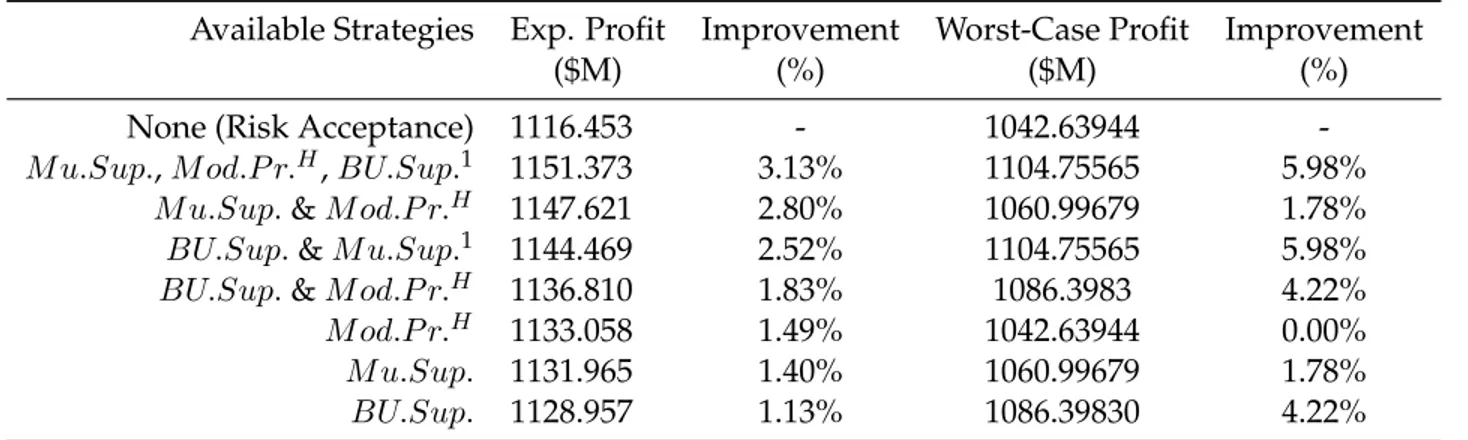
Improved Performance. Table 5 shows the expected profits and the worst-case (harvest time disrup-tion) profits under different risk management strategies. A risk acceptance strategy is used as a base line for comparison in the initial cost settings. In the optimal solution, all robust and resilient strategies are utilized to achieve the greatest improvement in the expected profit. The combina-tion of all three strategies gives a 3.13% improvement. The best improvement over subsets of two strategies is 2.80%. If only a single strategy (i.e., eitherBU.Sup., M u.Sup., or M od.P r.H) is avail-able, the best performance is achieved by utilizing theM od.P r.H; however, improvements from the other two strategies are close (1.49% versus 1.40% and 1.13%). In the worst-case scenario, the best improvement in profit is 5.98% when either all three strategies or bothM u.Sup.andBU.Sup. strate-gies are used. The effect ofM od.P r.H is not observed in the worst-case scenario as it only affects the probability of the disruption scenario, not the profit when the scenario is realized.
Table 5: Results of performance improvement under harvest-time disruption
Available Strategies Exp. Profit Improvement Worst-Case Profit Improvement
($M) (%) ($M) (%)
None (Risk Acceptance) 1116.453 - 1042.63944
-M u.Sup.,M od.P r.H,BU.Sup.1 1151.373 3.13% 1104.75565 5.98%
M u.Sup.&M od.P r.H 1147.621 2.80% 1060.99679 1.78%
BU.Sup.&M u.Sup.1 1144.469 2.52% 1104.75565 5.98%
BU.Sup.&M od.P r.H 1136.810 1.83% 1086.3983 4.22%
M od.P r.H 1133.058 1.49% 1042.63944 0.00%
M u.Sup. 1131.965 1.40% 1060.99679 1.78%
BU.Sup. 1128.957 1.13% 1086.39830 4.22%
While there is a certain degree of substitutability across the strategies (i.e., the improvement of the combined strategies is less than the sum of the individual improvements), the magnitude is rel-atively low. That is, significant benefit can be obtained by implementing the strategies together. StrategiesBU.Sup.andM u.Sup.show the lowest substitution loss, whileBU.Sup.andM od.P r.H
show the greatest substitution loss. Thus, there is no general conclusion to be made on the
tion effects of robust versus resilient strategies.
Strategy Cost versus Strategy Selection for All Strategy Combinations. Now, we conduct sensitivity anal-ysis of the costs of strategies. We vary the fixed costs ofM od.P r.H andBU.Sup.from $5M to $20M and the additional supply cost ofM u.Sup.from $0.55 to $0.75 per tray. Figure 4 shows the % profit improvements (illustrated by the size of the markers) under different cost settings. The smallest pointer (in black) indicates a 0.0% improvement while the largest pointer (in blue) at (5, 5, 0.55) has a 3.13% improvement. 5 10 15 20 25 5 10 15 20 0.55 0.6 0.65 0.7 0.75
Mod. Pr.H Fixed Cost($M) BU. Sup. Fixed Cost($M)
Add. Supp. Cost ($/tray)
All
Mod. Pr.H & BU. Sup. Mod. Pr.H & Mu. Sup. BU. Sup. & Mu. Sup. Mod. Pr.H BU. Sup. Mu. Sup. None
Figure 4: Profit improvements versus costs of strategies under harvest time disruption
Figure 4 shows that profit improvement (%) changes smoothly in relation to the changes in the costs of risk management strategies. There appear to be “zones” in which a particular combination of strategies is preferred. However, there is no observable preference for selecting robust strategies over the resilient strategy.
Impacts of Cost and Benefit of Each Strategy. Figure 5 focuses on each of the robust/resilient strategies separately. It shows how the optimal risk management solution changes as the cost (x-axis) and the ”benefit” of a strategy varies. In all three subfigures, the top left corner is the best (high benefit/low cost). The zone of 3.13% profit improvement corresponds to the initial optimal solution of selecting all three robust/resilient strategies.
(a)BU.Sup.– available amount vs. fixed cost (b) M od.P r.H– reduction in disruption proba-bility vs. fixed cost
(c) M u.Sup.– % of BoP supply transferred to
Italy vs. add. supply cost per tray
Figure 5: Impacts of cost and benefit of each strategy on improvement with risk management under harvest time disrup-tion
An interesting observation from Figure 5(b) is that if M od.P r.H can reduce the probability of disruption by 29% or more, then theBU.Sup.strategy is no longer selected (at its initial cost/ben-efit values) for anyM od.P r.H fixed cost in the range investigated ($1M-$12M) under harvest time disruption.
Sensitivity Analysis of Perishability. Figure 6 shows the impact of perishability. If a higher rate of per-ishability is present, risk management provides relatively more profit. This is intuitive as a higher perishability rate means greater vulnerability, and therefore more benefits with applying risk man-agement strategies. However, Figure 6 also suggests the robust strategy ofM od.P r.H loses its effec-tiveness at high perishability rates. This is because the strategy reduces the probability of a disrup-tion and increases the probability of the base scenario. The overall effect ofM od.P r.H is beneficial only when the increased profit in the base scenario outweighs the reduced profit in the disruption scenario. At high perishability rates, however, the profit changes in both scenarios reduce signif-icantly and become close to each other. Consequently, the overall effect of theM od.P r.H strategy becomes insignificant.
0.00% 1.00% 2.00% 3.00% 4.00% 5.00% 6.00% 7.00% 8.00% 5% 10% 15% 20% 25% 30% 35% 40% Improvement%
BU. Sup. &
Mu. Sup.
All
Perishability increasing
Figure 6: Sensitivity analysis of perishability under harvest time disruption
4.2.2. Yield Disruption Experiments
Improved Performance. Table 6 shows the results under yield disruption. Different from a harvest time disruption, under a yield disruption, implementing the two strategies ofBU.Sup.andM u.Sup.
is almost as good as implementing all three available strategies (2.23% versus 2.25%). This means
M od.P r.Y strategy is ineffective despite its relatively low cost of $1M. Furthermore, under yield disruption,M u.Sup.is twice more effective thanBU.Sup.(1.50% versus 0.79% profit improvement) when only a single strategy is allowed. However, under harvest-time disruption, M u.Sup. and
BU.Sup.have a comparable performance (1.40% versus 1.13% profit improvement).
Table 6: Results of performance improvement under yield disruption
Available Strategies Exp. Profit Improvement Worst-Case Profit Improvement
($M) (%) ($M) (%)
None (Risk Acceptance) 1148.963 - 1125.840
-BU.Sup.,M od.P r.Y, &M u.Sup.2 1174.862 2.25% 1192.067 5.88%
M u.Sup.&M od.P r.Y 1171.945 2.00% 1148.308 2.00%
BU.Sup.&M u.Sup.2 1174.525 2.23% 1192.067 5.88%
BU.Sup.&M od.P r.Y 1159.618 0.93% 1169.598 3.89%
M od.P r.Y 1156.544 0.66% 1125.839 0.00%
M u.Sup. 1166.194 1.50% 1166.194 3.58%
BU.Sup. 1158.076 0.79% 1169.598 3.89%
As in Table 5, while there is a certain degree of substitutability across the strategies, the magni-tude is still relatively low. StrategiesBU.Sup.andM u.Sup.again show the lowest substitution loss, while the substitution loss ofBU.Sup.withM od.P r.H is quite significant.
Impacts of Cost and Benefit of Each Strategy. Similar to Figure 5, Figure 7 shows the impact of the costs and benefits of each strategy under yield disruption. In the three subfigures, the zone of 2.25% profit improvement corresponds to the initial optimal solution of selecting all three robust/resilient strategies.
(a)BU.Sup.– available amount vs. fixed cost (b) M od.P r.Y – reduction in disruption proba-bility vs. fixed cost
(c) M u.Sup.– % of BoP supply transferred to
Italy vs. add. supply cost per tray
Figure 7: Impacts of cost and benefit of each strategy under yield disruption
Sensitivity Analysis of Perishability. Figure 8 shows the impact of perishability. Similar to a harvest time disruption scenario, the robust strategy of modified disruption probability loses its effective-ness at higher perishability rates under yield disruption. In addition, given a high perishability rate above 30%, the performance of utilizing risk management strategies improves as perishability in-creases. Similar to the harvest time disruption scenario, the effect of perishability is much higher above perishability rates of around 30% (and in this case is negligible under lower perishability rates). 0.00% 1.00% 2.00% 3.00% 4.00% 5.00% 6.00% 7.00% 8.00% 5% 10% 15% 20% 25% 30% 35% 40% Improvement% Increasing perishability All
BU. Sup. &
Mu. Sup. 0.00% 0.50% 1.00% 1.50% 2.00% 2.50% 3.00% 3.50% 4.00% 4.50%
Performance Improvement with Increasing Perishability
Fixed Costs: BU. Trans. =$3M , Mod. Pr.=$5M
Improvement%
Increasing perishability
All
BU. Trans.
Figure 8: Sensitivity analysis of perishability under yield disruption
4.2.3. Managerial Insights
The results and findings presented above offer several managerial insights for ASC risk manage-ment. First, a mixed combination of robust and resilient strategies are most effective for mitigating supply-side risks of harvest time and yield disruptions. Although robustness and resilience have a similar nature, robustness makes a supply chain less likely to fail, while resilience enables a supply chain to recover speedily in case of a failure, they are not substitutes. Supply chain planners need to consider both robust and resilient strategies in risk management planing.
Second, the effectiveness of a risk management strategy is dependent on the risk type. For exam-ple, a multiple supplier strategy obviously outperforms other strategies under yield disruption, but not so under harvest time disruption. A moderating disruption probability strategy is the best sin-gle strategy under harvest time disruption. However, it is not very effective under yield disruption. This suggests there is no such a thing as “one strategy fits all risks”. Therefore, businesses need to tailor risk management strategies to match their own vulnerabilities in the supply chain.
Last but not the least, product perishability has an effect on the benefits of implementing risk management strategies. Generally speaking, the higher the perishability rate, the more beneficial it is to manage disruptions due to the increased vulnerabilities. This implies greater loss for the supply chains of agricultural products that are highly perishable (e.g., fresh fruit and vegetables) if they simply ignore disruption risks. It is therefore essential for these supply chains to implement robust and resilient risk management strategies.
We expect these managerial insights to be applicable to typical ASCs as they are derived from the same general pattern as our model. These insights provide a strategic direction on devising effective risk management plans for ASCs. Having said that, as demonstrated in the sensitivity analysis, op-timal risk management strategies may vary depending on cost and perishability parameters. Thus, an ASC needs to adapt our optimization model and customize parameter settings for generating a specific risk management plan that suits its unique business circumstances.
5. Conclusion
Supply chain risk management has become increasingly important in the past two decades. In com-parison with typical manufactured products, agricultural products have special attributes such as long supply lead-times, seasonality, and perishability. In addition, their supply chains involve more sources of uncertainty. It is therefore more critical, but also more challenging, to manage risks in ASCs. The extant literature has studied ASC risk management to a very limited extent, especially in the areas of integrating perishability in risk management modeling and investigating the effective-ness of a mixed set of robust and resilient strategies. This study narrows this gap by developing a
two-stage stochastic programming model that integrates an exponential perishability function. The model is applied to a case study of Zespri’s kiwifruit supply chain to analyze the performance of several robust and resilient strategies under harvest time and yield disruption risks.
This research makes several original contributions. First, it is among the first studies of robust and resilient risk management strategies in an ASC. Given that a mixed combination of robust and resilient strategies are likely to be most effective, this research direction deserves further investi-gation. Second, it deals with two supply-side disruption risks to narrow a knowledge gap in the literature. Existing risk management studies mainly covered business-as-usual uncertainties and have paid limited attention to harsh rare disruptions. Third, it adopts a fractional formulation to integrate perishability and a quality barrier into the optimization model. It makes a methodological contribution to model perishability more realistically in ASC risk management while considering disruptions. Finally, the modeling results and findings offer important managerial insights: 1) a mixed combination of robust and resilient strategies are most effective for mitigating supply-side risks; 2) there is no such a thing as “one strategy fits all risks”; therefore, businesses need to match appropriate risk management strategies with their own supply chain vulnerabilities; and 3) the more perishable an agriculture product is, the more important it is to actively manage disruption risks.
This research has its limitations. It focuses on two specific supply-side disruption risks to en-sure a sufficient depth in the investigation. Future work should consider other types of supply-side uncertainties as well as demand-side risks. In fact, demand-side uncertainty and particularly price uncertainty, although not very relevant to the current study as described in this paper, is significant under some other ASC environments that utilize price promotion and discounting strategies. How-ever, including these would likely require a different modeling approach. In addition, this research considers a mixed set of three robust and resilient risk management strategies; it is worthwhile to extend the study to analyze other risk management strategies.
Acknowledgments
The authors thank the anonymous reviewers for their valuable comments on this paper. We also thank Dr. Jon Pearce in the Department of Engineering Science, University of Auckland, for his support and review of this work. The first author acknowledges both the Research Assistant funding received from Waikato University’s strategic investment fund for her work, which was awarded to the last two authors by the University of Waikato in New Zealand, and that received from the Department of Engineering Science, University of Auckland. The research of the third author was supported in part by Te Punaha Matatini Center of Research Excellence.
Appendix A. Summary of Notation
Indices and Sets. The following indices and sets are used throughout the ASC model.
t∈T is a time periodtwithin the set of periodsT.
r∈R is a productrwithin a set of productsR.
i∈I is a supply locationi, i.e., a combination of growers, packing, and storage facilities, within the set of supply locationsI.
j∈J is a demand locationj, i.e., a demand market, within the set of demand locationsJ.
n∈N is a locationnwithin set of all locationsN ≡I∪J, note thatI ∩J =∅.
k∈K is a commoditykwithin the set of commoditiesK.
ω∈Ω is a scenarioωwithin the set of scenariosΩ θs is the set of RM strategies related to supply levels.
θpr is the set of RM strategies related to disruption probabilities.
We also define some special indices and sets.
ω0 ∈Ω is the “no disruption” or base scenario, all otherω∈Ω\ {ω0}
are disruption scenarios.
m0 is the “risk acceptance” strategy, i.e., no robust or resilient
strategies utilised.
Parameters (Scenario-Independent). These parameters do not depend on the scenario being realized.
l(i, j) is the delivery lead-time betweeniandj,i∈I,j∈J.
ϕi(k, t0,∆t) is the unperished fraction function for commodityk∈Kthat enters
supply-side storagei∈Iin periodt0∈T, for∆tperiods.
ϕj(k, t0,∆t) is the unperished fraction function for commodityk∈Kthat enters
demand-side storagej∈Jin periodt0 ∈T, for∆tperiods.
ϕij(k, t0,∆t) is the unperished fraction function for commodityk∈Kthat enters transportation storageij: i∈I, j ∈J in periodt0 ∈T, for∆tperiods.
π(k, t) is the loss fraction percentage for each commodityk∈K in periodt.
K(r)⊆K is the set of commodities of productr∈R, note that the set{K(r)|r∈R} partitionsK, i.e.,∪r∈RK(r) =KandK(r1)∩K(r2) =∅for any pairr1, r2∈R. d(j, r, t) is the upper bound on the demand for productr∈Rin demand location
j∈J, at timet∈T.
x(i, k, t) is the upper-bound on the capacity of shipments from supply locationi∈I of commodityk∈K, starting at periodt∈T
cs(i, k, t, m) is the supply (=purchase) cost per unit of commodityk∈Kat supply locationi∈I in periodt∈T under strategym∈θ.
ch(n, k, t) is the holding cost per unit of commodityk∈K when held at location
n∈N for one period from periodt∈T.
cx(i, j, k, t) is the transportation cost betweeni∈Iandj∈Jper unit of commodity
k∈Kin periodt∈T.
P r(ω) is the probability of scenarioω.
M is a number big enough to enforce Big-M constraints in the formulation.
Parameters for (Robust and Resilient) Strategies. These parameters are utilized to present risk manage-ment strategies.
f(m) is the fixed cost under risk management strategym∈θ.
∆P r(ω, m) is the change in the probability of scenarioω ∈Ωunder strategym∈θpr, i.e., that affects scenario probabilities. Note we assume that is an increase forω0and a
decrease for all otherω. Hence∆P r(ω0, m) =
X
ω∈Ω\{ω0}
Parameters (Scenario Dependent). These parameters depend on the scenario being realized.
s(i, k, t, ω, m) is the upper-bound for the supply ofk∈Kat supply locationi∈Iat periodt∈T under scenarioω∈Ωwhen utilizing strategym∈θs∪ {m0},
i.e., that affects supply levels.
s(i, k, t, ω, m) is the lower-bound for supply ofk∈Kat supply locationi∈Iat
periodt∈T under scenarioω∈Ωwhen utilizing strategym∈θs∪ {m0},
i.e., that affects supply levels.
p(j, k, t, ω) is the market price for commodityk∈Kat demand locationj∈J in periodt∈T, under scenarioω∈Ω.
˜
t(ω) is the time a disruption scenarioω ∈Ωis known
Tactical Variables. we define the tactical supply chain decisions (scenario-dependent) in the follow-ing.
siktωm is the supply of commodityk∈Kat supply locationi∈Iin periodt∈T under scenarioω∈Ωand strategym∈θs∪ {m0}.
yjktω is the sales of commodityk∈K at demand locationj∈Jin periodt∈T under scenarioω∈Ω.
xijktω is the shipment of commodityk∈Kfrom supply locationi∈I to demand locationj∈Jin periodt∈T under scenarioω ∈Ω.
hiktω is the inventory of commodityk∈K held at supply location storage
i∈Iin periodt∈T under scenarioω ∈Ω.
hjktω is the inventory of commodityk∈K held at demand location storage
j∈J in periodt∈T under scenarioω∈Ω.
For ease-of-use throughout the paper, we define notation for all tactical supply chain decisions for a given scenarioω∈Ωin a given periodt∈T:
Xωt ≡ {siktωm, i∈I, k∈K, m∈θs∪ {m0},
yjktω, j ∈J, k∈K,
xijktω, i∈I, j ∈J, k∈K,
hiktω, i∈I, k ∈K,
and for a given scenarioω∈Ω: Xω≡ {siktωm, i∈I, k ∈K, t∈T, m∈θs∪ {m0}, yjktω, j ∈J, k∈K, t∈T, xijktω, i∈I, j ∈J, k∈K, t∈T, hnktω, i∈I, k ∈K, t∈T, hnktω, j ∈J, k∈K, t∈T}
Strategic Variables. we define the strategic risk management decisions (scenario-independent) in the following.
zm := Binary variable for selection of strategym.
References
[1] Assemble des Rgions Europennes Fruitires, Lgumires et Horticoles (cited October 2015). The kiwifruit in the world (AREFLH). http://areflh.org/index.php? option=com_content&view=article&id=63:le-kiwi-dans-le-monde&catid=16: etudes&Itemid=116&lang=en.
[2] Behzadi, G., O’Sullivan, M. J., Olsen, T. L., and Zhang, A. (2016). Agribusiness supply chain risk management: a review of quantitative decision models. Major revision under review.
[3] Blackburn, J. and Scudder, G. (2009). Supply chain strategies for perishable products: the case of fresh produce. Production and Operations Management, 18(2):129–137.
[4] Borodin, V., Bourtembourg, J., Hnaien, F., and Labadie, N. (2016). Handling uncertainty in agri-cultural supply chain management: a state of the art. European Journal of Operational Research, 254(2):348–359.
[5] Boyabati, O. (2015). Supply management in multiproduct firms with fixed proportions technol-ogy. Management Science.
[6] Boyabatli, O., Nguyen, D. Q., and Wang, T. (2014). Capacity management in agricultural com-modity processing and application in the palm industry. Research Collection Lee Kong Chian School Of Business. Working paper available athttp://ink.library.smu.edu.sg/lkcsb_
research/3188.
dependent. Research Collection Lee Kong Chian School of Business. Working paper available at
http://ink.library.smu.edu.sg/lkcsb_research/3771.
[8] Cai, X. and Zhou, X. (2014). Optimal policies for perishable products when transportation to export market is disrupted. Production and Operations Management, 23(5):907–923.
[9] Chandrasekaran, N. and Raghuram, G. (2014). Agribusiness Supply Chain Management. CRC Press.
[10] Christopher, M. and Peck, H. (2004). Building the resilient supply chain.The International Journal of Logistics Management, 15(2):1–14.
[11] Dani, S. and Deep, A. (2010). Fragile food supply chains: reacting to risks. International Journal of Logistics: Research and Applications, 13(5):395–410.
[12] Dong, M. (2006). Development of supply chain network robustness index. International Journal of Services Operations and Informatics, 1(1-2):54–66.
[13] Fahimnia, B., Tang, C. S., Davarzani, H., and Sarkis, J. (2015). Quantitative models for managing supply chain risks: A review. European Journal of Operational Research, 247(1):1–15.
[14] Gardiner, S. (2014). Personal Communication. Supply Chain Manager for Zespri NZ Ltd.
[15] Gebreslassie, B. H., Yao, Y., and You, F. (2012). Design under uncertainty of hydrocarbon biore-finery supply chains: multiobjective stochastic programming models, decomposition algorithm, and a comparison between cvar and downside risk. AIChE Journal, 58(7):2155–2179.
[16] Greer, G. and Saunders, C. (2012). The costs of Psa-V to the New Zealand kiwifruit industry and the wider community. Lincoln University.
[17] Guan, Z. and Philpott, A. B. (2011). A multistage stochastic programming model for the new zealand dairy industry. International Journal of Production Economics, 134(2):289–299.
[18] Hahn, K. H., Hwang, H., and Shinn, S. W. (2004). A returns policy for distribution channel coordination of perishable items. European Journal of Operational Research, 152(3):770–780.
[19] Higgins, A., Miller, C., Archer, A., Ton, T., Fletcher, C., and McAllister, R. (2010). Challenges of operations research practice in agricultural value chains.Journal of the Operational Research Society, 61(6):964–973.
[20] Hsu, V. N. (2000). Dynamic economic lot size model with perishable inventory. Management Science, 46(8):1159–1169.
[21] Hutching, G. (2015). Kiwifruit on the rebound. http://www.stuff.co.nz/business/
farming/cropping/67182698/kiwifruit-on-the-rebound.
[22] Ivanov, D. and Sokolov, B. (2013). Control and system-theoretic identification of the supply chain dynamics domain for planning, analysis and adaptation of performance under uncertainty. European Journal of Operational Research, 224(2):313–323.
[23] Ivanov, D., Sokolov, B., and Dolgui, A. (2014). The ripple effect in supply chains: trade-off efficiency-flexibility-resiliencein disruption management. International Journal of Production Re-search, 52(7):2154–2172.
[24] Ivanov, D., Sokolov, B., Solovyeva, I., Dolgui, A., and Jie, F. (2016). Dynamic recovery policies for time-critical supply chains under conditions of ripple effect. International Journal of Production Research.
[25] Jones, P. C., Kegler, G., Lowe, T. J., and Traub, R. D. (2003). Managing the seed-corn supply chain at syngenta. Interfaces, 33(1):80–90.
[26] Jones, P. C., Lowe, T. J., Traub, R. D., and Kegler, G. (2001). Matching supply and demand: The value of a second chance in producing hybrid seed corn. Manufacturing & Service Operations Management, 3(2):122–137.
[27] Kazaz, B. and Webster, S. (2011). The impact of yield-dependent trading costs on pricing and production planning under supply uncertainty. Manufacturing & Service Operations Management, 13(3):404–417.
[28] Kim, J., Realff, M. J., and Lee, J. H. (2011). Optimal design and global sensitivity analysis of biomass supply chain networks for biofuels under uncertainty.Computers & Chemical Engineering, 35(9):1738–1751.
[29] Klibi, W. and Martel, A. (2012). Modeling approaches for the design of resilient supply net-works under disruptions. International Journal of Production Economics, 135(2):882–898.
[30] Leat, P. and Revoredo-Giha, C. (2013). Risk and resilience in agri-food supply chains: the case of the asda porklink supply chain in scotland. Supply Chain Management: An International Journal, 18(2):219–231.
[31] Lodree, E. J. and Uzochukwu, B. M. (2008). Production planning for a deteriorating item with stochastic demand and consumer choice. International Journal of Production Economics, 116(2):219– 232.
[32] Lowe, T. J. and Preckel, P. V. (2004). Decision technologies for agribusiness problems: A brief re-view of selected literature and a call for research. Manufacturing & Service Operations Management, 6(3):201–208.
[33] Mirzapour Al-E-Hashem, S., Malekly, H., and Aryanezhad, M. (2011). A multi-objective robust optimization model for multi-product multi-site aggregate production planning in a supply chain under uncertainty. International Journal of Production Economics, 134(1):28–42.
[34] Monk, R. (2001). Foreign Agricultural Service - Global Agriculture Information Network (GAIN) report. http://apps.fas.usda.gov/gainfiles/200101/65679396.pdf.
[35] NZBusiness (2015). Kiwifruit industry back on track for growth-Zespri. https://nz. finance.yahoo.com/news/kiwifruit-industry-back-track-growth-203341737. html.
[36] NZHEA (cited October 2015). Kiwifruit Industry Statistics (New Zealand Horticul-ture Export Authority). http://www.hea.co.nz/index.php/2012-05-11-03-05-28/
kiwifruit-trade.
[37] Pahl, J. and Voß, S. (2014). Integrating deterioration and lifetime constraints in production and supply chain planning: a survey. European Journal of Operational Research, 238(3):654–674.
[38] Skouri, K. and Papachristos, S. (2003). Optimal stopping and restarting production times for an eoq model with deteriorating items and time-dependent partial backlogging.International Journal of Production Economics, 81:525–531.
[39] Tan, B. and C¸ ¨omden, N. (2012). Agricultural planning of annual plants under demand, matu-ration, harvest, and yield risk. European Journal of Operational Research, 220(2):539–549.
[40] Tang, C. S. (2006a). Perspectives in supply chain risk management. International Journal of Production Economics, 103(2):451–488.
[41] Tang, C. S. (2006b). Robust strategies for mitigating supply chain disruptions. International Journal of Logistics: Research and Applications, 9(1):33–45.
[42] Tang, O. and Musa, S. N. (2011). Identifying risk issues and research advancements in supply chain risk management. International journal of production economics, 133(1):25–34.
[43] Thron, T., Nagy, G., and Wassan, N. (2007). Evaluating alternative supply chain structures for perishable products. The international journal of logistics Management, 18(3):364–384.
[44] Vlajic, J., Hendrix, E., and van der Vorst, J. (2008). Food supply chain network robustness: a literature review and research agenda.
[45] Wiedenmann, S. and Geldermann, J. (2015). Supply planning for processors of agricultural raw materials. European Journal of Operational Research, 242(2):606–619.
[46] Yu, C.-S. and Li, H.-L. (2000). A robust optimization model for stochastic logistic problems. International Journal of Production Economics, 64(1):385–397.
[47] Zespri Group Limited (cited October 2015a). About Zespri. http://www.zespri.com/
companyinformation.
[48] Zespri Group Limited (cited October 2015b). FAQs Zespri. http://www.zespri.com/
companyinformation/faqs.
[49] Zhang, A., Luo, H., and Huang, G. Q. (2013). A bi-objective model for supply chain design of dispersed manufacturing in china. International Journal of Production Economics, 146(1):48–58.