For Peer Review Only
Supplier Selection Based on Supply Chain Ecosystem, Performance and Risk Criteria
Journal: International Journal of Production Research
Manuscript ID: Draft
Manuscript Type: Original Manuscript Date Submitted by the Author: n/a
Complete List of Authors: nukala, viswanadham; Indian Institute of Science, Computer Science and Automation
Samvedi, Avinash; Indian Institute of Science, Computer Science and Automation
Keywords: SUPPLIER SELECTION, SUPPLY CHAIN MANAGEMENT, FUZZY LOGIC, ANALYTICAL HIERARCHY PROCESS, TOPSIS, RISK MANAGEMENT Keywords (user):
For Peer Review Only
3 4 5 6 7 8 9 10 11 12 13 14 15 16 17 18 19 20 21 22 23 24 25 26 27 28 29 30 31 32 33 34 35 36 37 38 39 40 41 42 43 44 45 46 47 48 49 50 51 52 53 54 55 56 57 58For Peer Review Only
Supplier Selection Based on Supply Chain Ecosystem, Performance and Risk
Criteria
N. Viswanadham* and A. Samvedi
Department of Computer Science and Automation, Indian Institute of Science Bangalore, Bangalore – 560012, India
*Corresponding author email: n.viswanadham@gmail.com
3 4 5 6 7 8 9 10 11 12 13 14 15 16 17 18 19 20 21 22 23 24 25 26 27 28 29 30 31 32 33 34 35 36 37 38 39 40 41 42 43 44 45 46 47 48 49 50 51 52 53 54 55 56 57
For Peer Review Only
Supplier Selection Based on Supply Chain Ecosystem, Performance and Risk
Criteria
A supply chain ecosystem consists of the elements of the supply chain and the entities that influence the goods, information, and financial flows. These influences come through government regulations, human, financial, and natural resources, logistics infrastructure and management, etc. and thus affect the supply chain performance. Similarly, all the ecosystem elements also contribute to the risk. The aim of this paper is to identify the important and critical decision criteria which are both performances based such as lead time, cost, quality and the risk factors that the supply chain faces from various sources in global supplier selection. A two step approach using fuzzy AHP and fuzzy TOPSIS has been proposed for multi criteria decision making and illustrated using a numerical illustration. The first step does the selection without considering risks and then in the next step suppliers are ranked according to their risk profiles. Later the two ranks are consolidated into one. In subsequent section, the method is extended for multi tier supplier selection.
Keywords: Supply chain risk management, supply chain ecosystem, supplier selection, fuzzy AHP, fuzzy TOPSIS.
3 4 5 6 7 8 9 10 11 12 13 14 15 16 17 18 19 20 21 22 23 24 25 26 27 28 29 30 31 32 33 34 35 36 37 38 39 40 41 42 43 44 45 46 47 48 49 50 51 52 53 54 55 56 57 58
For Peer Review Only
1. Introduction
Over the last two decades, companies had worked hard to reduce costs and improve efficiency of the supply chain processes by which they delivered products to their customers at the right cost and at the right times. They had done this by implementing techniques such as the lean production, just-in-time manufacturing, single-source suppliers, and global outsourcing from low cost countries (Viswanadham and Kameshwaran, 2013). The supply chains were highly connected making the flow of goods, information and funds very smooth and easy. The biggest supply chain challenge pursued was supply demand matching avoiding obsolescent inventory or loss of sales and customer confidence. The supply chains of today face lot more challenges because of the increase in their complexity.
In integrated supply chain networks, connectedness made individuals, services and organizations accessible over distance, sourcing from single supplier helped protect the intellectual property, lean operations lead the way to reduce costs and inventory. But on the negative side, the leaner, global and more integrated supply chains are less resilient uncertainties and accidents in any link. Also the rising costs of human and other resources and the environmental concerns of transport of raw materials and other goods around the globe are counteracting the low cost production advantages. Efficiency encouraged and created giant firms through mergers and acquisitions and geographical concentration through cluster concepts (e.g. low cost manufacturing in China, IT clusters in India etc, Auto and Electronic clusters in Japan). Damage due to an accident is higher for a concentration rather than for separate owners in several locations. Protectionism, the insolvency of suppliers or their banks are other concerns
Supply Chains are complex networks of suppliers, contract manufacturers and third party service providers with interdependencies among these firms, hence inter-organizational coordination of
3 4 5 6 7 8 9 10 11 12 13 14 15 16 17 18 19 20 21 22 23 24 25 26 27 28 29 30 31 32 33 34 35 36 37 38 39 40 41 42 43 44 45 46 47 48 49 50 51 52 53 54 55 56 57
For Peer Review Only
risks a critical requirement. Many companies are making considerable investments in monitoring the security, continuity, regulatory and performance risks of their key suppliers. However there are no appropriate governing structures in place for monitoring and control of the globally dispersed manufacturing and service networks during normal as well as abnormal times. There is a high level of awareness of the potential risk arising from interaction and relationships between supply chain partners. In recent years, a number of writers have sought to broaden the scope of disruption risk management process from the level of the single company to the level of the entire supply chain (Gaonkar and Viswanadham, 2007).
Managing supply risk thus has become a critical component of managing the supply chain. Consequently, it is important to an organization’s success to understand the sources of supply risk and how to best manage them. The risk sources are many and risk avoidance is not a viable strategy. Hence one needs to carefully design the processes to be risk resilient and take appropriate action when an undesirable beyond the control happens. For example, procurement or selection of supplier is an important supply chain process. Supplier selection is generally done based on the performance criteria such as unit cost, quality, delivery times etc. However in global sourcing several factors including political, economical, infrastructural factors; natural and manmade disasters; resource price fluctuations will cause deviations, disruptions or disasters depending on the magnitude of the event. There is a need to identify all such factors and also list them and create awareness among all concerned of the events that can happen and how they can be dealt with. One of the aims of our paper is precisely this. We present the supply chain ecosystem and list all the possible bad events that affect the supply chain. We also develop an understanding of relationships between the countries of the supplier and the manufacturer such
3 4 5 6 7 8 9 10 11 12 13 14 15 16 17 18 19 20 21 22 23 24 25 26 27 28 29 30 31 32 33 34 35 36 37 38 39 40 41 42 43 44 45 46 47 48 49 50 51 52 53 54 55 56 57 58
For Peer Review Only
as free trade agreements and also the transport infrastructure such as ports, roads and also the resource productivity (labor, finance, power etc).
Traditionally supplier selection was done mainly based on performance criteria but due to changing scenario and increased uncertainity, risk factor is getting increasing importance. Also supplier selection process is an inherently multi-objective problem, because usually many tangible and intangible factors (price, quality, delivery performance, service, etc.) need to be considered and evaluated in selecting suppliers and monitoring their performance. Wang and Yang (2009) searched supplier selection in a quantity discount environment using multi objective linear programming, analytical hierarchy process (AHP), and fuzzy compromise programming. Chan and Kumar (2007) identified and discussed some of the important and critical decision criteria including risk factors for the development of an efficient system for global supplier selection using fuzzy AHP. Lu et al. (2007) adds environmental principles into supplier selection process by applying fuzzy AHP. Chan et al. (2008) proposed a fuzzy AHP approach for global supplier selection. Chena et al. (2006) used fuzzy technique for order of preference by similarity to ideal solution (TOPSIS) for supplier selection. Kaya and Kahraman (2011) proposed a modified fuzzy TOPSIS for selection of the best energy technology alternative.
1.1 Contribution
In this paper, we concentrate on the procurement process which is global and is managed as an inter-organization network. This paper is a significant contribution to the literature on this topic. We present a methodology for choice of suppliers based on performance criteria and also to minimize the risks. Our methodology is based on the ecosystem framework and applies fuzzy AHP and fuzzy TOPSIS in a unique way, by separating out the performance criteria from the
3 4 5 6 7 8 9 10 11 12 13 14 15 16 17 18 19 20 21 22 23 24 25 26 27 28 29 30 31 32 33 34 35 36 37 38 39 40 41 42 43 44 45 46 47 48 49 50 51 52 53 54 55 56 57
For Peer Review Only
risk ones and then solving each part separately before consolidating the scores. The performance criteria such as lead time, cost and quality are evaluated using all the ecosystem parameters. Generally costs in supply chain include inventory, transport and unit costs. In our case they include trade related, resource related and infrastructure related costs and coordination costs as well. Similarly, quality in our case includes quality on delivery rather than at the factory thus including spoilage, theft and damage during transport, loading, unloading etc. The risk criteria classification used in this study also differentiates it from other previous studies. Most of the supply chain risk studies, which have tried to do this, consider only supply failures, partner risks, logistics failures, sharp fall in demand etc. But risks for the supply chain can arise from all the four elements of the ecosystem rather than the supply chain alone. The risks come from governments, political and social networks, resources and delivery systems such as logistics and IT (Viswanadham and Kameshwaran, 2013). Therefore risk mitigation or avoidance strategies should include all the ecosystem entities and plan the strategies accordingly. The best way of risk avoidance strategy is to take care of risks when selecting the suppliers. This is because of the huge amount of risks the individual chains of these upstream suppliers bring to the system.
This paper is organized as follows: In section 2, we present the ecosystem model. We show how the performance is affected by the human, financial, infrastructural and natural resources, government actions and also the delivery logistics. Similarly all the ecosystem elements contribute to the risk. We then proceed in section 3 to select the suppliers to minimize the risk and enhance the performance. This section presents the proposed integrated methodology which uses fuzzy AHP and fuzzy TOPSIS. In section 4 we present a numerical illustration to show the applicability and usability of the approach. Finally, section 5 concludes the paper with future research directions. 3 4 5 6 7 8 9 10 11 12 13 14 15 16 17 18 19 20 21 22 23 24 25 26 27 28 29 30 31 32 33 34 35 36 37 38 39 40 41 42 43 44 45 46 47 48 49 50 51 52 53 54 55 56 57 58
For Peer Review Only
2. Ecosystem Model
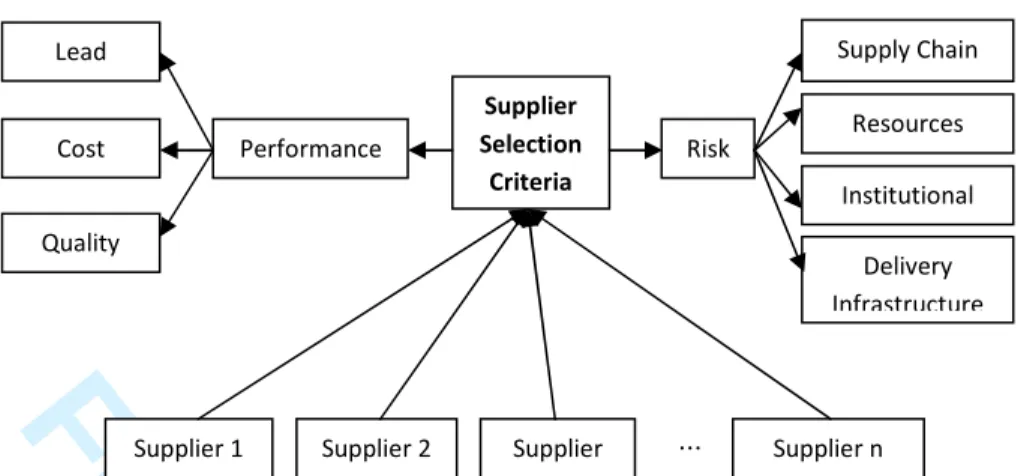
A supply chain ecosystem consists of the elements of the supply chain and the entities that influence the goods, information, and financial flows through regulations, technology, management, etc. Accordingly, the supply chain ecosystem comprises of networks of companies directly and indirectly part of the supply chain, countries of operations/presence and their governments, industrial, social and political organizations, logistics and information technology services infrastructure, the third party service providers that connect the companies and the countries to the external economic and social environment, resources including natural, financial and human resources with talent, connections and knowledge of the industrial environment, industry clusters, universities, etc interacting together with the horizontal and vertical supply chain landscape and economic and social climate. The ecosystem is shown in Figure 1. The four distinct risk sources in manufacturing and service chain networks include
1. Supply chain network
2. Institutions: Governmental and Social
3. Resources including Human, Natural, Financial and Industrial (Clusters) 4. Delivery service mechanisms
We generally conduct the performance, risk and innovation studies using this framework. For this paper the performance and risk are relevant. Specifically, we deal with the supplier selection problem using Fuzzy AHP framework taking into consideration the lead time, cost and quality as well as the risk emanating from all the ecosystem parameters.
2.1 Performance Analysis Using the Ecosystem Model
Performance analysis of supplier’s supply chains depend on all the ecosystem parameters. The desirable enablers in the ecosystem of these suppliers supply chains have been listed in Table 1.
3 4 5 6 7 8 9 10 11 12 13 14 15 16 17 18 19 20 21 22 23 24 25 26 27 28 29 30 31 32 33 34 35 36 37 38 39 40 41 42 43 44 45 46 47 48 49 50 51 52 53 54 55 56 57
For Peer Review Only
Figure 1: Supply chain ecosystem (Viswanadham and Kameshwaran, 2013)
Design and technology improvements such as product modularization, process coordination, supply chain visibility etc., resources such as clusters, banks, trained human resources, power, water etc., government regulations, trade and tariffs, customs, IP protection and inter-country agreements such as free trade agreements and finally the delivery service practices such as good ports, good road connectivity, software providers and logistics companies that provide streamlined procurement, manufacturing and distribution processes have significant impact on customer satisfaction and in increasing the performance of the supply chains. Availability of natural, human and financial resources, clusters and high labor productivity will reduce cost and improve the lead times. A favorable institutional framework like good judiciary, IP protection laws, trade laws etc. will improve the trade, and will help instill the confidence in OEM’s to outsource more work and to help these suppliers with latest technology. Needless to say that good delivery infrastructure such as ports, roads, 3Pls, it, software vendors, soft infrastructure and trade facilitation will result in predictable lead times and low transportation and inventory costs. Product modularization, process standardization, collaboration with partners and the supply chain visibility using sensor networks, call centers and Internet, late customization and
3 4 5 6 7 8 9 10 11 12 13 14 15 16 17 18 19 20 21 22 23 24 25 26 27 28 29 30 31 32 33 34 35 36 37 38 39 40 41 42 43 44 45 46 47 48 49 50 51 52 53 54 55 56 57 58
For Peer Review Only
use of supply hubs will certainly reduce the lead time and increase the efficiencies and product flexibility but may also increase the cost of production. This performance analysis of supply chains is given in Table 1.
Table 1: Ecosystem Enablers for Supplier’s Supply Chain
Supply chain Institutions Delivery
Infrastructure
Resources Enablers Modular products,
JIT, TQM, SRM, SC Visibility, Collaboration FTAs, Customs, IP protection, Good Judiciary, Trade Laws, Social Acceptance
Port, Road & IT Infrastructure, 3PLs, Software Vendors Finance, Power, Water etc., Clusters, High Labour Productivity Cost High Product Design
Cost, Low Production Cost Low Tariffs, High Profits Low Transportation and Inventory Costs
Low Factor Costs
Lead time
Low Low Low Low
Quality High Quality Products
High SC service levels
High SC Service levels & Market reach
High
Management Quality
The total landed cost has the following components: Product cost, Transport (shipping) cost, Trade-related costs (processing, customs clearance, port operations, and the like), pipeline (in-transit) inventory, and safety stock inventory costs and finally the coordination cost. If a particular country has highly variable processing times for port operations, supply chain managers need to hold additional safety stock to maintain desired customer service levels in the face of increased supply uncertainty.
2.2 Risk Analysis Using the Ecosystem Model
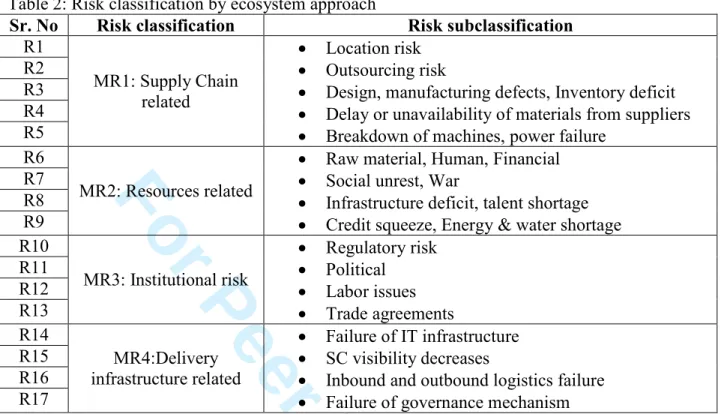
Table 2 gives the list of risks that the supplier’s supply chain faces from the four ecosystem elements. We consider below the three kinds of risks that an integrated supply chain faces apart from the supply chain functions and partners.
3 4 5 6 7 8 9 10 11 12 13 14 15 16 17 18 19 20 21 22 23 24 25 26 27 28 29 30 31 32 33 34 35 36 37 38 39 40 41 42 43 44 45 46 47 48 49 50 51 52 53 54 55 56 57
For Peer Review Only
Table 2: Risk classification by ecosystem approach
Sr. No Risk classification Risk subclassification
R1
MR1: Supply Chain related
• Location risk
• Outsourcing risk
• Design, manufacturing defects, Inventory deficit
• Delay or unavailability of materials from suppliers
• Breakdown of machines, power failure R2 R3 R4 R5 R6 MR2: Resources related
• Raw material, Human, Financial
• Social unrest, War
• Infrastructure deficit, talent shortage
• Credit squeeze, Energy & water shortage R7 R8 R9 R10 MR3: Institutional risk • Regulatory risk • Political • Labor issues • Trade agreements R11 R12 R13 R14 MR4:Delivery infrastructure related • Failure of IT infrastructure • SC visibility decreases
• Inbound and outbound logistics failure
• Failure of governance mechanism R15
R16 R17
2.2.1 Resources related risks
The resources that we consider are the natural, human, financial and industry resources. In the human resources arena skills shortages, employee attrition, communicable diseases and strikes affecting the number of working days, opportunistic behavior by the senior managers and other staff such as theft of intellectual property are some of the risks generally faced by the companies. The input material shortages such as grains, fruits and vegetables, live stock, quality problems due to diseases such as mad cow disease, chicken flu, price fluctuations in oil and food, currency fluctuations all affect the supply chain effectiveness. Equipment failures, failure of power or water resources can lead to unavailability of plants, warehouses and office buildings. Availability of quality producer services such as accounting, management consulting, advertising, venture funding etc is essential for strategy formulation.
3 4 5 6 7 8 9 10 11 12 13 14 15 16 17 18 19 20 21 22 23 24 25 26 27 28 29 30 31 32 33 34 35 36 37 38 39 40 41 42 43 44 45 46 47 48 49 50 51 52 53 54 55 56 57 58
For Peer Review Only
2.2.2 Institutional risks
The economic and political related uncertainties affect businesses across all industries and they include economic factors such as economic slowdown, country ratings, foreign exchange, political issues such as war, country to country relationships, changes in governments, uncertainties in trade agreements (Anti-dumping, voluntary export restrictions). deregulation, etc. Social unrest and regulatory risks are high in emerging markets. In developed countries, the financial crisis has created a situation of oversight by the government.
2.2.3 Risks due to failure of delivery infrastructure
Delay or unavailability of either inbound or outbound transportation to move goods due to carrier breakdown or weather problems will cause the supply demand matching problem. Failure of information and communication infrastructure due to line, computer hardware or software failures or virus attacks, will lead to the inability to coordinate operations and execute transactions While the physical supply chain handles the movement of documents data & physical goods the financial supply chain handles the movement of documents data & money. Thus any credit squeeze by the financial institutions will affect the supply chain. Piracy has increased over the years. Warships to protect ships carrying cars and oil. It is still cheaper & convenient to pay higher insurance fees and take risk being attacked by Somali pirates than to incur the extra cost of diverting vessels around the Cape of Good Hope.
The following hierarchy for supplier selection is being proposed here. This hierarchy simulataneously considers both performance and risk factors and the ecosystem model ensures the inclusivety of all important factors. The hierarchy is described in Figure 2.
3 4 5 6 7 8 9 10 11 12 13 14 15 16 17 18 19 20 21 22 23 24 25 26 27 28 29 30 31 32 33 34 35 36 37 38 39 40 41 42 43 44 45 46 47 48 49 50 51 52 53 54 55 56 57
For Peer Review Only
Figure 2: Combined performance risk based supplier selection hierarchy
3. An integrated fuzzy approach
In this section the proposed methodology has been detailed out. A concise description, of the fuzzy multi criteria methods which form an important part of the methodology, is also given.
3.1 Fuzzy AHP
The Fuzzy-AHP methodology extends Saaty’s AHP by combining it with fuzzy set theory. In the Fuzzy-AHP, fuzzy ratio scales are used to indicate the relative strength of the factors in the corresponding criteria. Therefore, a fuzzy judgment matrix can be constructed. The final scores of alternatives are also represented by fuzzy numbers. The optimum alternative is obtained by ranking the fuzzy numbers using special algebraic operators. In this methodology, all elements in the judgment matrix and weight vectors are represented by triangular fuzzy numbers. Using fuzzy numbers to indicate the relative importance of one risk type over the other, a fuzzy judgment vector is then obtained for each risk. These judgment vectors form part of the fuzzy pairwise comparison matrix which is then used to determine the weight of each risk. Table 3 shows the meaning of linguistic expressions in the form of fuzzy numbers. Experts are asked to
Performance Risk
Supplier Selection
Criteria
Supplier 1 Supplier 2 Supplier ⋯ Supplier n
Cost
Quality
Lead Supply Chain
Resources Institutional Delivery Infrastructure 3 4 5 6 7 8 9 10 11 12 13 14 15 16 17 18 19 20 21 22 23 24 25 26 27 28 29 30 31 32 33 34 35 36 37 38 39 40 41 42 43 44 45 46 47 48 49 50 51 52 53 54 55 56 57 58
For Peer Review Only
give their assessment in the form of these linguistic expressions which are then converted and analyzed to finally get the weights.
Table 3: Triangular fuzzy number equivalents to the corresponding linguistic expressions Linguistic Expressions Equivalent Fuzzy Numbers Triangular fuzzy number (l,m,u)
Equal 1 (1,1,3)
Little importance 3 (1,3,5)
Strong importance 5 (3,5,7)
Very strong importance 7 (5,7,9)
Extreme importance 9 (7,9,11)
Chang’s extent analysis method has been used for determining weights from pairwise comparisons. The extent analysis method is used to consider the extent of an object to be satisfied for the goal, that is, satisfied extent. In the method, the ‘‘extent’’ is quantified by using a fuzzy number. On the basis of the fuzzy values for the extent analysis of each object, a fuzzy synthetic degree value can be obtained, which is defined as follows (Paksoy et al. 2012).
Let X = {x1,x2, . . . ,xn} be an object set and U = {u1,u2, . . . ,um} be a goal set. According to the method of Chang’s extent analysis model, each object is taken and extent analysis for each goal gi is performed. Therefore, m extent analysis values for each object can be obtained as ,
,…, , I = 1, 2, . . ., n. All the , j = 1, 2,. . .,m are triangular fuzzy numbers. The
algorithm of the Chang’s extent analysis model is as follows,
Step 1: The value of fuzzy synthetic extent with respect to the ith object is defined as
3 4 5 6 7 8 9 10 11 12 13 14 15 16 17 18 19 20 21 22 23 24 25 26 27 28 29 30 31 32 33 34 35 36 37 38 39 40 41 42 43 44 45 46 47 48 49 50 51 52 53 54 55 56 57
For Peer Review Only
To obtain ∑ perform the fuzzy addition operation of m extent analysis for a particular matrix such that
, ,
and to obtain ∑ ∑ , perform the fuzzy addition operation of ; j = 1, 2, . . . ,m values such that
, ,
and then compute the inverse of the vector in such that
1 ∑ , 1 ∑ , 1 ∑
The principles for the comparison of fuzzy numbers were introduced to derive the weight vectors of all elements for each level of hierarchy with the use of fuzzy synthetic values. To compare of the fuzzy numbers, following principles are used.
Step 2: The degree of possibility of M2 ≥ M1 is defined as
!" # $ %&'()*+, -./0"1$, ./2"3$45 678"∩ $ ./2":$ = ; 1, +< # 0, # ">0?2$ "2?2$"0>0$, @86ABC+%A 3 4 5 6 7 8 9 10 11 12 13 14 15 16 17 18 19 20 21 22 23 24 25 26 27 28 29 30 31 32 33 34 35 36 37 38 39 40 41 42 43 44 45 46 47 48 49 50 51 52 53 54 55 56 57 58
For Peer Review Only
where M1 = (l1,m1,u1) and M2 = (l2,m2,u2) and d is the ordinate of the highest intersection point D between ./0 and ./2 (see Fig. 3). To compare M1 and M2, both !" # $ and !" #
$ are needed. The comparison is shown graphically in Figure 3.
Figure 3: The intersection between D E,: D
Step 3: The degree of possibility for a fuzzy number to be greater than k fuzzy numbers Mi, (i = 1,2,. . . ,k) can be defined by
!" # , , … , G$ = min !" # $, i=1,2,…,k
Assume that,
:′"H
$ min !" # G$, I 1,2, … , ,; I L +
Then the weight vector is given by
M′ -:′"H
$, :′"H$, … , :′"H$4 N
where Ai, (i = 1,2,. . . ,n) are n elements.
Step 4: Via normalization, the normalized weight vectors are
3 4 5 6 7 8 9 10 11 12 13 14 15 16 17 18 19 20 21 22 23 24 25 26 27 28 29 30 31 32 33 34 35 36 37 38 39 40 41 42 43 44 45 46 47 48 49 50 51 52 53 54 55 56 57
For Peer Review Only
M O:"H$, :"H$, … , :"H$PNWhere W is not a fuzzy number.
3.2 Fuzzy TOPSIS
TOPSIS is a multiple criteria method to identify solutions from a finite set of alternatives. The underlying logic of TOPSIS is to define the ideal solution and the negative ideal solution. The alternatives are then compared with these ideal and negative ideal solutions, to find out the distances. These distances are then used to come up with a score. The one which is closest to the ideal and farthest from the negative ideal generally qualifies for the optimum. Chen (2000) extends the TOPSIS method to fuzzy group decision making situations by considering triangular fuzzy numbers and defining crisp Euclidean distance between two fuzzy numbers. In Chen’s fuzzy TOPSIS, linguistic preferences can easily be converted to fuzzy numbers which are allowed to be used in calculations. The details of the method as given by Kutlu & Ekmekçiog˘ lu (2012) is given below.
It is suggested that the decision makers use linguistic variables to evaluate the ratings of alternatives with respect to criteria. Table 3 gives the linguistic scale for evaluation of the alternatives. Assuming that a decision group has K people, the ratings of alternatives with respect to each criterion can be calculated as
QR S Q1 R"T$QR"T$ … "T$QRU,
where QRU is the rating of the Kth decision maker for ith alternative with respect to jth criterion (Chen, 2000). 3 4 5 6 7 8 9 10 11 12 13 14 15 16 17 18 19 20 21 22 23 24 25 26 27 28 29 30 31 32 33 34 35 36 37 38 39 40 41 42 43 44 45 46 47 48 49 50 51 52 53 54 55 56 57 58
For Peer Review Only
Obtaining weights of the criteria and fuzzy ratings of alternatives with respect to each criterion, the fuzzy multi-criteria decision-making problem can be expressed in matrix format as
V QR⋮ QR QR ⋮ QR ⋯ ⋯ ⋯ QR ⋮ QR , W = [w1,w2,…,wn], j = 1,2,…,n,
where QR is the rating of the alternative Ai with respect to criterion j (i.e. Cj) and wj denotes the importance weight of Cj. These linguistic variables can be described by triangular fuzzy numbers: QR "E , X , Y $. To avoid the complicated normalization formula used in classical TOPSIS, the linear scale transformation is used here to transform the various criteria scales into a comparable scale. Therefore, we can obtain the normalized fuzzy decision matrix denoted by ZR
ZR B̃ )
where B and C are the set of benefit criteria and cost criteria, respectively, and
B̃ E\Y∗ ,XRY∗ ,ỸY∗ , ^_`; B̃ EY,XX,EY , ^_a; Y∗ E1 Y +< ^_`; E +, E +< ^_a.
The normalization method mentioned above is to preserve the property that the ranges of normalized triangular fuzzy numbers belong to [0, 1].
3 4 5 6 7 8 9 10 11 12 13 14 15 16 17 18 19 20 21 22 23 24 25 26 27 28 29 30 31 32 33 34 35 36 37 38 39 40 41 42 43 44 45 46 47 48 49 50 51 52 53 54 55 56 57
For Peer Review Only
Considering the different importance of each criterion, we can construct the weighted normalized fuzzy decision matrix as
!R c\ ) + 1,2, … , ; ^ 1,2, … , ,
Where
c\ B̃ ". $:OaP.
According to the weighted normalized fuzzy decision matrix, we know that the elements
c\ ∀+, ^ are normalized positive triangular fuzzy numbers and their ranges belong to the closed
interval [0, 1]. Then, we can define the fuzzy positive-ideal solution (FPIS, H∗) and fuzzy negative-ideal solution (FPIS, H) as
H∗ "c\∗, c\∗, … , c\∗$,
H "c\
, c\, … , c\$, Where
c\∗ "1,1,1$ E,: c\ "0,0,0$, ^ 1,2, … , ,.
The distance of each alternative from H∗ and H can be currently calculated as
:∗ :" c\ , c\∗$, + 1,2, … , : :" c\ , c\$, + 1,2, … , 3 4 5 6 7 8 9 10 11 12 13 14 15 16 17 18 19 20 21 22 23 24 25 26 27 28 29 30 31 32 33 34 35 36 37 38 39 40 41 42 43 44 45 46 47 48 49 50 51 52 53 54 55 56 57 58
For Peer Review Only
where d(., .) is the distance measurement between two fuzzy numbers calculating with the following formula:
:"e\, f̃$ g13 i"ej f$T "ej f$T "ekj fk$l
where e\ "e, e, ek$ and f̃ "f, f, fk$ are two triangular fuzzy numbers. A closeness coefficient is defined to determine the ranking order of all alternatives once the :m∗ and :m of each alternative H "+ 1, 2, . . . , $ are calculated. The closeness coefficient of each alternative is calculated as
aa :m
:m∗T :m, + 1,2, … ,
Obviously, an alternative H is closer to the (FPIS, H∗) and farther from (FPIS, H) as aa approaches to 1. Therefore, according to the closeness coefficient, we can determine the ranking order of all alternatives and select the best one from among a set of feasible alternatives.
3.3 Proposed Methodology
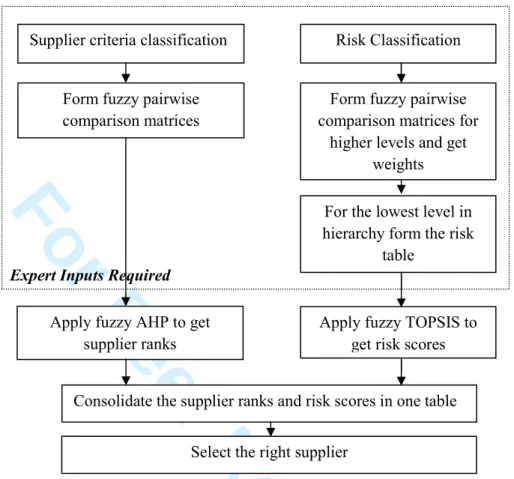
This section proposes an integrated methodology using fuzzy AHP and fuzzy TOPSIS for supplier risk assessment while doing supplier selection. The methodology consists of steps as given in Figure 4. As can be seen from the Figure 4 there are two paths at the start wherein the supplier risk assessment is separated from the supplier performance evaluation. The first path uses the standard fuzzy AHP procedure whereas the second path draws upon the methodology proposed by Samvedi and Jain (2012). The first step in both the paths though requires the firm to come up 3 4 5 6 7 8 9 10 11 12 13 14 15 16 17 18 19 20 21 22 23 24 25 26 27 28 29 30 31 32 33 34 35 36 37 38 39 40 41 42 43 44 45 46 47 48 49 50 51 52 53 54 55 56 57
For Peer Review Only
Figure 4: Proposed methodology for supplier selection
with a comprehensive hierarchy of all the criteria on which the performance of suppliers is tested or the risks are evaluated. This is done by thoroughly studying the considered chain and identifying potential loopholes. These are then analyzed for overlaps and categorized using similar characteristics. This exercise should be repeated whenever a major change is made in the chain. The second step in the process involves assigning weights to the criteria according to their importance. Fuzzy AHP is used for this purpose and expert views are taken as input. For the path 1 that is the performance evaluation this step also provides with the performance scores for the alternatives. But for the path 2 there are two extra steps involved. The first of them requires expert inputs for the risk assessment done for four criteria namely their probability of occurrence, their impact on the performance of supply chain, the effort and time required in
Apply fuzzy AHP to get supplier ranks
Apply fuzzy TOPSIS to get risk scores
Consolidate the supplier ranks and risk scores in one table
Select the right supplier
For the lowest level in hierarchy form the risk
table Risk Classification
Form fuzzy pairwise comparison matrices for
higher levels and get weights Supplier criteria classification
Form fuzzy pairwise comparison matrices
Expert Inputs Required 3 4 5 6 7 8 9 10 11 12 13 14 15 16 17 18 19 20 21 22 23 24 25 26 27 28 29 30 31 32 33 34 35 36 37 38 39 40 41 42 43 44 45 46 47 48 49 50 51 52 53 54 55 56 57 58
For Peer Review Only
recovering from the impact and at what level does the risk affect. This is because, as can be seen from the literature, the risk affecting the strategic level is much more dangerous than one affecting the operational level. The last step in path 2 does the aggregation of these inputs using fuzzy TOPSIS.
The results from the two paths are then aggregated to come up with a decision table which contains supplier alternative ranks and also the individual risk scores for these alternatives under different risk types. Also the aggregated risk score for every alternative is displayed in this table. This helps the managers to make an informed decisionon which supplier to choose. The breakup score for each risk type is provided because sometimes the managers want to pay particular attention to a type of risk. This can be because of several reasons such as that the said risk type is already present in the supply chain in large and managers do not want it to be increased any further.
4. Example
This section gives an illustrative example, to explain the workings of the methodology proposed, and also real time scenarios where such a method can be useful. The Figure 2 depicts the supplier selection hierarchy, which has been proposed in this study. As can be seen from the Figure 4 there are two major paths. One path evaluates the suppliers on their performance criteria and the other evaluates them on their risk assessment. Most of the studies, which also consider risk, do so by adding risk as a performance criterion. But with added emphasis given these days on risk management, due to high vulnerability of businesses these days, it is better to treat risks separately. This helps in risks getting the importance which they deserve.
3 4 5 6 7 8 9 10 11 12 13 14 15 16 17 18 19 20 21 22 23 24 25 26 27 28 29 30 31 32 33 34 35 36 37 38 39 40 41 42 43 44 45 46 47 48 49 50 51 52 53 54 55 56 57
For Peer Review Only
When doing the performance evaluation any multi criteria method can be used. Whereas, for selection through risk assessment, this study uses the approach as explained in the previous section and illustrated through an example here. The approach involves two major steps, namely assigning weights to all the criteria and determining the scores of all the risks at the lowest level in the hierarchy. These two values are then consolidated into one single risk index value. Here we detail out the functioning of methodology proposed to handle risk assessment part of the process. The performance evaluation part is dealt by using Fuzzy AHP, similar to the way first half of described method is solved. The calculation for this part has not been provided here because of the shortage of space. This is also why only those calculations which are necessary for the understanding of the method have been provided here.
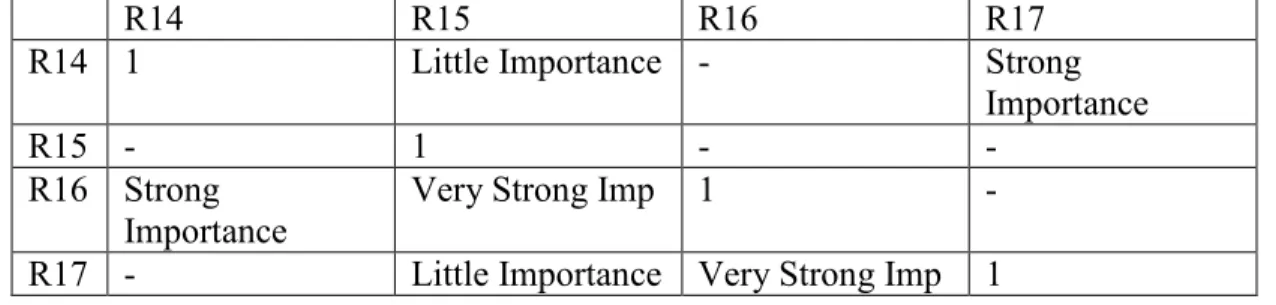
The inputs come in the form of linguistic values. The expert inputs for the fuzzy AHP part are linguistic variables as given in the Table 3. Normally whenever such subjectivity is involved in judgments it is advised to have more than one source of inputs. These inputs can be later aggregated for a better analysis of the system. In this study inputs from three experts are considered. In total there will be 5 fuzzy pair wise comparison tables per expert. These are one for criteria comparison and one each for comparison of sub criteria under a given criterion. The calculations for sub criteria comparison under the criteria delivery infrastructure failure is shown in Table 4. The calculation is provided for the pair wise comparison matrix of one expert. The remaining pair wise comparisons are solved in the similar way.
As seen from Table 4 the two risks are compared only once and the reverse comparison are supposed to take the reverse value automatically. When these linguistic inputs are converted to the fuzzy triangular numbers we get Table 5.
3 4 5 6 7 8 9 10 11 12 13 14 15 16 17 18 19 20 21 22 23 24 25 26 27 28 29 30 31 32 33 34 35 36 37 38 39 40 41 42 43 44 45 46 47 48 49 50 51 52 53 54 55 56 57 58
For Peer Review Only
Table 4: Pair wise comparison matrix for sub criteria under critical delivery infrastructure R14 R15 R16 R17
R14 1 Little Importance - Strong Importance
R15 - 1 - -
R16 Strong Importance
Very Strong Imp 1 - R17 - Little Importance Very Strong Imp 1
Table 5: Pair wise comparison matrix with fuzzy triangular numbers R14 R15 R16 R17
R14 1 (1,3,5) - (3,5,7) R15 - 1 - - R16 (3,5,7) (5,7,9) 1 - R17 - (1,3,5) (5,7,9) 1
The synthetic values are then calculated as shown in step 1 of section 5.2. These synthetic values are then used to reach the final weights. The calculations are done using the step 2, 3 and 4 of the same section. The results are shown in Table 6. Similarly the weights for all the criteria and sub criteria are determined. The weights from different experts are then averaged to get the mean weights. Now the process moves on the second part namely risk assessment inputs. Each risk is measured against four parameters, namely low importance, low probability of occurrence, low impact of the risk on the supply chain if it occurred and less difficulty to mitigate that risk. The criteria are chosen in such a way so that higher value is desired. This helps us in directly adding up the scores to the performance ones. Also this approach goes with the popular one wherein higher values for better alternatives are desired.
Table 6: Synthetic values and corresponding weights Criteira Synthetic Values Weights
R1 (0.0741, 0.4286, 1.1538) 0.3275 R2 (0.0296, 0.1429, 0.3846) 0.1706 R3 (0.1296, 0.3214, 1.3462) 0.3201 R4 (0.0556, 0.1071, 0.5769) 0.1998 3 4 5 6 7 8 9 10 11 12 13 14 15 16 17 18 19 20 21 22 23 24 25 26 27 28 29 30 31 32 33 34 35 36 37 38 39 40 41 42 43 44 45 46 47 48 49 50 51 52 53 54 55 56 57
For Peer Review Only
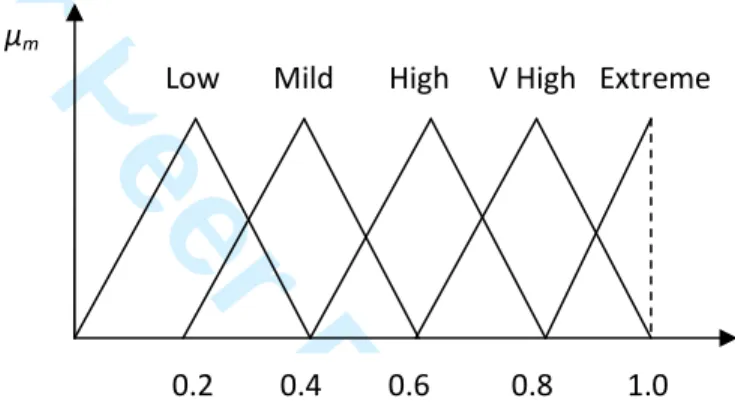
The inputs for the values of these parameters are taken from experts again in the form of linguistic expressions which have earlier been defined as fuzzy intervals, as shown in the Figure 5. The linguistic expressions are randomly generated and the values from three experts are averaged as done in the previous step. The resulting values are shown in Table 7. Each risk input parameter is divided into five linguistic expressions with membership values as shown in Figure 5.
Figure 5: Membership functions of the linguistic expressions
The Table 7 shows the risk input matrix with the expert inputs entered. These inputs are then converted to risk scores using fuzzy TOPSIS method as given in section 5.3.
These scores are then consolidated using the weights assigned to all the risks. These scores are multiplied by the weights assigned to the relative risks. The values obtained are then added up for the first level risks. For example, the values for first five risks are added to give a score for the planning and product related risks. The scores obtained for the first level risks are then again multiplied by the weights assigned to these first level risks and the resulting values summed up to get the final risk index value. The two scores are then consolidated into one. These values are shown in Table 8. Thus it can be seen that supplier 3 is the best in consolidated score and overall risk category. But it ranks second in performance. Also when individual risk categories are
0.2 0.4 0.6 0.8 1.0
µm
Low Mild High V High Extreme
3 4 5 6 7 8 9 10 11 12 13 14 15 16 17 18 19 20 21 22 23 24 25 26 27 28 29 30 31 32 33 34 35 36 37 38 39 40 41 42 43 44 45 46 47 48 49 50 51 52 53 54 55 56 57 58
For Peer Review Only
Table 7: Averaged risk expert input matrix
Risks Type of risk Probability Impact Mitigation Score R1 (0.13, 0.33, 0.53) (0.47, 0.67, 0.80) (0.13, 0.33, 0.53) (0.13, 0.33, 0.53) 0.2955 R2 (0.40, 0.60, 0.73) (0.40, 0.60, 0.80) (0.20, 0.40, 0.60) (0.13, 0.33, 0.53) 0.3864 R3 (0.33, 0.53, 0.73) (0.20, 0.40, 0.60) (0.40, 0.60, 0.80) (0.40, 0.60, 0.73) 0.4545 R4 (0.33, 0.53, 0.73) (0.33, 0.53, 0.73) (0.20, 0.40, 0.60) (0.20, 0.40, 0.60) 0.3636 R5 (0.67, 0.87, 1.00) (0.00, 0.20, 0.40) (0.73, 0.93, 1.00) (0.27, 0.47, 0.67) 0.5682 R6 (0.33, 0.53, 0.73) (0.27, 0.47, 0.67) (0.33, 0.53, 0.73) (0.47, 0.67, 0.87) 0.4773 R7 (0.20, 0.40, 0.60) (0.47, 0.67, 0.87) (0.27, 0.47, 0.67) (0.27, 0.47, 0.60) 0.4091 R8 (0.13, 0.33, 0.53) (0.27, 0.47, 0.67) (0.00, 0.20, 0.40) (0.13, 0.33, 0.53) 0.1818 R9 (0.20, 0.40, 0.60) (0.40, 0.60, 0.80) (0.33, 0.53, 0.73) (0.60, 0.80, 1.00) 0.5227 R10 (0.27, 0.47, 0.67) (0.47, 0.67, 0.80) (0.07, 0.27, 0.47) (0.27, 0.47, 0.67) 0.3636 R11 (0.53, 0.73, 0.87) (0.33, 0.53, 0.73) (0.47, 0.67, 0.80) (0.40, 0.60, 0.80) 0.5909 R12 (0.33, 0.53, 0.73) (0.27, 0.47, 0.67) (0.53, 0.73, 0.93) (0.47, 0.67, 0.80) 0.5455 R13 (0.40, 0.60, 0.80) (0.07, 0.27, 0.47) (0.40, 0.60, 0.80) (0.53, 0.73, 0.93) 0.4773 R14 (0.47, 0.67, 0.80) (0.33, 0.53, 0.73) (0.27, 0.47, 0.67) (0.67, 0.87, 1.00) 0.5909 R15 (0.20, 0.40, 0.60) (0.27, 0.47, 0.60) (0.13, 0.33, 0.53) (0.33, 0.53, 0.73) 0.3182 R16 (0.20, 0.40, 0.60) (0.53, 0.73, 0.80) (0.40, 0.60, 0.80) (0.53, 0.73, 0.93) 0.5682 R17 (0.67, 0.87, 1.00) (0.00, 0.20, 0.40) (0.73, 0.93, 1.00) (0.40, 0.60, 0.80) 0.6136
Table 8: Consolidated table with all the scores. Supplier s Performanc e Scores Risk Scores Consolidate d Scores MR1 MR2 MR3 MR4 Total S1 0.3279 0.3025 0.5337 0.4926 0.4556 0.4328 0.7607 S2 0.1708 0.5571 0.5052 0.3738 0.5119 0.4681 0.6389 S3 0.2976 0.6600 0.4874 0.5341 0.4404 0.5791 0.8767 S4 0.2037 0.5253 0.4453 0.4951 0.4545 0.4892 0.6929
broken down we see that supplier 3 is best for MR1 and MR3 category, whereas it ranks third for MR2 and last for MR4. Such a detailed examination is most of the times very useful. Importance of detailing out the values in such a way is that the managers have the data in front of them and are in a position to make a better informed decision. Sometimes giving only the final value can be a little misleading. This can be explained by considering supplier 3. As we can see that the total value of risk assessment is highest for this supplier. That means this supplier is least risky overall. But suppose that the existing supply chain has a lot of risk from MR4 category and the
3 4 5 6 7 8 9 10 11 12 13 14 15 16 17 18 19 20 21 22 23 24 25 26 27 28 29 30 31 32 33 34 35 36 37 38 39 40 41 42 43 44 45 46 47 48 49 50 51 52 53 54 55 56 57
For Peer Review Only
managers do not want that risk to increase anymore, then giving only the total value can be misleading. Supplier 3 is actually the most risky in MR4 category.
4.1 Extension to multi-tier supplier selection
When a supplier is selected in a supply chain then it is not just that supplier but also its entire sub chain comes into the system. Most of the times this sub chain selection is ignored and the focus is only on the front supplier. This is risky as the entire ecosystem of the sub chain is now the part of the overall supply chain and the risks can also emanate from here. For example Mattel recalled millions of toys in 2007 because high quantity of lead was found in the paint which was used. The problem occurred from one of the sub suppliers of a Chinese supplier to which the work was outsourced. This shows the importance of keeping watch on the sub chains of the selected suppliers and if possible better selects the entire sub chain.
The method given above can be easily extended to multi tier supplier selection. The entire process is rerun for the possible supplier alternatives at every tier in the chain. The numerical example here has three tiers overall with 4 supplier alternatives in the front tier, 5 in the next upstream tier and 3 for the last tier. The calculations were demonstrated for the front tier suppliers and these are now extended to the other two tiers. The details of calculations are similar to the ones above but the hierarchy of criteria can be changed if needed. It is sometimes possible that the importance of criteria is different for different tiers and also in some cases the list of criteria can change even. Tables 9 and 10 tabulate the values obtained for these tiers. Table 9 shows the values for the second tier in the upstream direction and Table 10 shows the last tier in the upstream direction.
3 4 5 6 7 8 9 10 11 12 13 14 15 16 17 18 19 20 21 22 23 24 25 26 27 28 29 30 31 32 33 34 35 36 37 38 39 40 41 42 43 44 45 46 47 48 49 50 51 52 53 54 55 56 57 58
For Peer Review Only
Table 9: Consolidated table with all the scores for second tier upstream. Supplier s Performanc e Scores Risk Scores Consolidate d Scores MR1 MR2 MR3 MR4 Total SS1 0.1932 0.5878 0.6297 0.5002 0.4694 0.5698 0.7630 SS2 0.1477 0.5455 0.6159 0.5411 0.4861 0.5513 0.6990 SS3 0.2713 0.3025 0.5337 0.4926 0.4556 0.4328 0.7041 SS4 0.2264 0.5571 0.5052 0.3738 0.5119 0.4681 0.6945 SS5 0.1614 0.6600 0.4874 0.5341 0.4404 0.5791 0.7405
Table 10: Consolidated table with all the scores for the last tier upstream. Supplier s Performanc e Scores Risk Scores Consolidate d Scores MR1 MR2 MR3 MR4 Total SSS1 0.4182 0.5253 0.4453 0.4951 0.4545 0.4892 0.9074 SSS2 0.3567 0.4741 0.6667 0.5700 0.6125 0.5896 0.9463 SSS3 0.2251 0.3515 0.4537 0.5607 0.4541 0.4428 0.6679
In total then there can be 4x5x3 = 60 possible chains involving these alternatives. But almost always there are other constraints like compatibility issues between different firms, logistical connectivity issues, cultural differences, regional problems etc. Due to these the number of possible alternative chains is always much lower than the total possible chains. In this case this number comes out to be nine feasible chains and they are
C1. S1 – SS2 – SSS1 C2. S1 – SS5 – SSS1 C3. S2 – SS1 – SSS3 C4. S2 – SS4 – SSS2 C5. S3 – SS3 – SSS2 C6. S4 – SS1 – SSS1 C7. S4 – SS3 – SSS3 3 4 5 6 7 8 9 10 11 12 13 14 15 16 17 18 19 20 21 22 23 24 25 26 27 28 29 30 31 32 33 34 35 36 37 38 39 40 41 42 43 44 45 46 47 48 49 50 51 52 53 54 55 56 57
For Peer Review Only
C9. S4 – SS5 – SSS2
The combined overall scores for these chains are given in Table 11 below.
Table 11: Consolidated table with total scores for sub chains. Chains Performanc e Scores Risk Scores Consolidate d Scores MR1 MR2 MR3 MR4 Total C1 0.8938 1.3733 1.5949 1.5288 1.3962 1.4733 2.3671 C2 0.9075 1.4878 1.4664 1.5218 1.3505 1.5011 2.4086 C3 0.5891 1.4964 1.5886 1.4347 1.4354 1.4807 2.0698 C4 0.7539 1.5883 1.6771 1.3176 1.6363 1.5258 2.2797 C5 0.9256 1.4366 1.6878 1.5967 1.5085 1.6015 2.5271 C6 0.8483 1.6077 1.3958 1.3640 1.4209 1.4465 2.2948 C7 0.7001 1.1793 1.4327 1.5484 1.3642 1.3648 2.0649 C8 0.6552 1.4339 1.4042 1.4296 1.4205 1.4001 2.0553 C9 0.7218 1.6594 1.5994 1.5992 1.5074 1.6579 2.3797
These scores are just the additions of the values from the previous three tables. It can be seen from this table that C5 is the best chain followed by C2 and C9. Also the table shows that although C5 is the best overall, C9 scores the highest in risk and thus is a better chain with respect to handling risks. C5 also scores the best in performance category. The scores for all the chains are provided to the managers, who can then take an informed decision by taking all the tradeoffs into consideration and also the current scenario.
5. Conclusion and future research work
Global supply chain networks are frequently hit by severe disruptions. Keeping the performance at acceptable levels during disruptions has become one of the top most concerns for the managers in a supply chain today. Some do so in an ad hoc or reactive fashion, responding to risks as they appear, while others are proactive, planning in advance the risks that they wish to assume and how they can best manage them. Thus supplier selection giving due importance to
3 4 5 6 7 8 9 10 11 12 13 14 15 16 17 18 19 20 21 22 23 24 25 26 27 28 29 30 31 32 33 34 35 36 37 38 39 40 41 42 43 44 45 46 47 48 49 50 51 52 53 54 55 56 57 58
For Peer Review Only
risk factors have become need of the hour. This makes the study unique where performance and risk criteria have been considered together and with equal importance. Also the use of ecosystem approach in defining the criteria makes this paper stand out.
The ecosystem approach used for the classification of risks seems to be the right way to move forward as it not only considers the risks emanating from a supply chain but also from the entire ecosystem which affects a chain. The ecosystem has four elements. All may not be important for all verticals at all times. The weights assigning process uses expert knowledge to assign weights to these criteria based on the perceived affect of these risks to the operations of the supply chain. The resulting consolidated table provides an opportunity to the supply chain managers to make better supplier. The risk score table should be the starting point for the risk management team as it details the weights given to the different risk types and also the present status of the supply chain vulnerability from a particular risk.
This method is generic in nature and can easily be applied to any practical situation. Also the method can easily be extended to other similar selection situations. Multi tier selection has also been handled in this study, but regarding the huge scope of the subject it needs more research and thus is a very promising prospect for a future study. Meta heuristics such as genetic algorithm can be applied to come up with a comprehensive multi tier supplier selection. As the number of possible alternatives of suppliers at each tier is usually large and also these days supply chains have become longer, means that the number of combinations from these alternatives is huge and thus warrants the use of meta heuristics.
3 4 5 6 7 8 9 10 11 12 13 14 15 16 17 18 19 20 21 22 23 24 25 26 27 28 29 30 31 32 33 34 35 36 37 38 39 40 41 42 43 44 45 46 47 48 49 50 51 52 53 54 55 56 57
For Peer Review Only
Acknowledgement: The first author would like to thank INAE for all its support. Second author thanks Prof. Y. Narahari (Chairman CSA Dept., IISc) and DST for their support and funds, which helped in successful completion of this study.
3 4 5 6 7 8 9 10 11 12 13 14 15 16 17 18 19 20 21 22 23 24 25 26 27 28 29 30 31 32 33 34 35 36 37 38 39 40 41 42 43 44 45 46 47 48 49 50 51 52 53 54 55 56 57 58
For Peer Review Only
References
Chan, F.T.S. and Kumar, N., 2007, Global supplier development considering risk factors using fuzzy extended AHP-based approach, Omega, Vol. 35, No. 4, pp. 417-431.
Chan, F.T.S., Kumar, N., Tiwari, M.K., Lau, H.C.W. and Choy, K.L., (2008) ‘Global supplier selection: a fuzzy-AHP approach’, International Journal of Production Research, Vol. 46, No. 14, pp. 3825–3857.
Chen, C., (2000) ‘Extensions of the TOPSIS for group decision-making under fuzzy environment’, Fuzzy Sets and Systems, Vol. 114, No. 1, pp. 1–9.
Chena, C.T., Lin, C.T. and Huang, S.F., (2006) ‘A fuzzy approach for supplier evaluation and selection in supply chain management’, International Journal of Production Economics, Vol. 102, No. 2, pp. 289–301.
E&Y, (2011) ‘Defining the boundaries: Key findings from Ernst & Young 2011 supplier risk management survey’.
Gaonkar, R. and Viswanadham, N., (2007) ‘An Analytical Framework for the Management of Risk in Supply Chains’, IEEE Transactions on Automation Sciences and Engineering, pp. 265-273.
Handfield, R.B. and McCormack, K., (2008) ‘Supply chain risk management: Minimizing disruptions in global sourcing’, Auerbach publications, New York.
Hwang, C.L. and Yoon, K., (1981) ‘Multiple Attributes Decision Making Methods and Applications’, Springer, Berlin Heidelberg.
Kaya, T. and Kahraman, C., (2011) ‘Multicriteria decision making in energy planning using a modified fuzzy TOPSIS methodology’, Expert Systems with Applications, Vol. 38, pp. 6577– 6585. 3 4 5 6 7 8 9 10 11 12 13 14 15 16 17 18 19 20 21 22 23 24 25 26 27 28 29 30 31 32 33 34 35 36 37 38 39 40 41 42 43 44 45 46 47 48 49 50 51 52 53 54 55 56 57
For Peer Review Only
Kleindorfer, P.R. and Saad, G.H., (2005) ‘Managing disruption risks in supply chains’, Production and Operations Management, Vol. 14, No. 1, pp. 53-68.
Kutlu, A. C., and Ekmekçiog˘lu, M., (2012) ‘Fuzzy failure modes and effects analysis by using fuzzy TOPSIS based fuzzy AHP. Expert Systems with Applications, Vol. 39, No.1, pp. 61-67. Lambert, D.M., (2008) ‘Supply chain management: processes, partnerships, performance’,
Sarasota Florida: Supply Chain Management Institute, pp. 6.
Lu, L.Y.Y., Wu, C.H. and Kuo, T.C., (2007) ‘Environmental principles applicable to green supplier evaluation by using multi-objective decision analysis’. International Journal of Production Research, Vol. 45, No. 18/19, pp. 4317– 4331.
Paksoy, T., Pehlivan, N.Y. and Kahraman, C. (2012) ‘Organizational strategy development in distribution channel management using fuzzy AHP and hierarchical fuzzy TOPSIS’, Expert Systems with Application, Vol. 39, No. 12, pp. 2822-2841.
Samvedi, A. and Jain, V., (2012) ‘Quantifying Risks in a Supply Chain through Integration of fuzzy AHP and fuzzy TOPSIS’, International Journal of Production Research, Vol. 51, No. 8, pp 2433-2442.
Spekman, R.E. and Davis E.W., (2004) ‘Risky business: expanding the discussion on risk and the extended enterprise’, International Journal of Physical Distribution and Logistics Management, Vol. 34, No. 5, pp. 414-433.
Viswanadham, N. and Kameshwaran, S., (2013) ‘Ecosystem Aware Global Supply Chain Management’, World Scientific Publishing.
Xanthopoulos, A., Vlachos, D. and Iakovou, E., (2012) ‘Optimal newsvendor policies for dual-sourcing supply chains: A disruption risk management framework’, Computers and Operations Research, Vol. 39, No. 2, pp. 350-357.
3 4 5 6 7 8 9 10 11 12 13 14 15 16 17 18 19 20 21 22 23 24 25 26 27 28 29 30 31 32 33 34 35 36 37 38 39 40 41 42 43 44 45 46 47 48 49 50 51 52 53 54 55 56 57 58