Louisiana State University
LSU Digital Commons
LSU Master's Theses
Graduate School
2014
Using eye-tracking to investigate strategy and
performance of expert and novice control room
operators
Christina Marie Koffskey
Louisiana State University and Agricultural and Mechanical College, [email protected]
Follow this and additional works at:
https://digitalcommons.lsu.edu/gradschool_theses
Part of the
Mechanical Engineering Commons
This Thesis is brought to you for free and open access by the Graduate School at LSU Digital Commons. It has been accepted for inclusion in LSU Master's Theses by an authorized graduate school editor of LSU Digital Commons. For more information, please [email protected].
Recommended Citation
Koffskey, Christina Marie, "Using eye-tracking to investigate strategy and performance of expert and novice control room operators" (2014).LSU Master's Theses. 3353.
USING EYE-TRACKING TO INVESTIGATE STRATEGY AND PERFORMANCE OF
EXPERT AND NOVICE CONTROL ROOM OPERATORS
A Thesis
Submitted to the Graduate Faculty of the Louisiana State University and Agricultural and Mechanical College
in partial fulfillment
of the requirements for the degree of Master of Science
in
The Department of Mechanical and Industrial Engineering
by
Christina M. Koffskey
B.S., Louisiana State University, 2010 May 2014
ii
ACKNOWLEDGMENTS
First and foremost I would like to sincerely thank Dr. Laura Ikuma for her guidance, advice, patience and enthusiastic encouragement. I would also like to thank my other committee members, Dr. Fereydoun Aghazadeh and Dr. Craig Harvey for their valuable time and feedback. This research would not have been possible without funding from the Center for Operator Performance and generous technical assistance and support from Mark Nixon, Emerson Process Management.
ii
TABLE OF CONTENTS
ACKNOWLEDGMENTS ... ii LIST OF TABLES ... iv LIST OF FIGURES ... v GLOSSARY OF ABBREVIATIONS ... vi ABSTRACT ... vii CHAPTER 1. INTRODUCTION ... 1CHAPTER 2. REVIEW OF THE LITERATURE ... 4
2.1 Introduction ... 4
2.2 Insights into Cognitive Processes Using Eye-Tracking ... 4
2.3 Expertise: What It Means to be an Expert ... 5
2.4 Eye-Tracking to Improve Training and Interface Design ... 6
2.5 Using Eye-Tracking to Investigate Expert Strategy... 7
2.6 Basic Eye-Tracking Measurements ... 8
2.7 Eye-Tracking in Aviation and Health Care ... 8
2.7.1 Number of Fixations per AOI ... 9
2.7.2 Gaze Percentage per AOI ... 9
2.7.3 Gaze Duration Mean per AOI ... 10
2.7.4 Scan Path ... 11
2.8 Variability of Eye-Tracking Metrics ... 12
CHAPTER 3. METHODS ... 14
3.1 Background on Previous Research ... 14
3.1.1 Simulation and Interface Design ... 14
3.2 Experiment Overview and Design ... 15
3.3 Participants ... 17
3.4 Eye-Tracking ... 19
3.5 Experimental Procedure (Previous Research) ... 19
3.5.1 How to Address Failures Within Scenarios ... 20
3.6 Experimental Procedure (Current Research) ... 21
3.7 Obtaining Eye Metrics through BeGaze Software ... 22
3.7.1 Fixation Frequency per AOI ... 22
3.7.2 Gaze Duration Mean per AOI ... 23
iii 3.7.4 Scan Path ... 23 3.8 Areas of Interest ... 24 3.9 AOI Mapping ... 26 3.10 Alarm Activity ... 27 3.11 Performance ... 27 3.12 Hypothesis... 28 3.13 Data Analysis ... 29 CHAPTER 4. RESULTS ... 32 4.1 Quantitative Analysis ... 32
4.2 Scan Plot Qualitative Analysis ... 46
CHAPTER 5. DISCUSSION ... 57
5.1 Model 1 ... 57
5.2 Model 2 ... 59
5.3 Correlation ... 59
5.4 Setpoint Change ... 63
5.5 Future Research and Limitations ... 67
CHAPTER 6. CONCLUSION ... 69
6.1 Expertise ... 69
6.2 Interface Design ... 69
REFERENCES ... 71
APPENDIX 1. GREY AND BLACK DISPLAYS ... 75
APPENDIX 2. AOIS ... 77
APPENDIX 3. SEMANTIC GAZE MAPPING ... 78
APPENDIX 4. AOI EDITOR ... 79
VITA ... 80
iv
LIST OF TABLES
Table 1 - Eye-Tracking Metrics and What They Measure Based on Task Type ... 13
Table 2 - Independent and Dependent Variables for Previous and Current Research ... 15
Table 3 - Comparison of the Design Changes for the Grey and Black Interface ... 15
Table 4 - Experiment Design and Predictor Variables ... 16
Table 5 - Demographic Information Collected for Novice Students ... 18
Table 6 - Demographic Information Collected for Expert Control Room Operators ... 18
Table 7 - AOI List for Active and Inactive Periods ... 26
Table 8 - Sample Output for Event Statistics ... 26
Table 9 - Independent T-Test between Thesis Participants and Entire Sample Size ... 28
Table 10 - Independent and Dependent Variables Analyzed Within Each Model ... 30
Table 11 - Descriptive Statistics for Expert and Novice AOI Fixation Details ... 32
Table 12 - Model 1: MANOVA Main Effects Results ... 33
Table 13 - Model 2: MANOVA Main Effects Results ... 33
Table 14 - Single ANOVA Results for Model 1: Main Effects Due to Interface ... 34
Table 15 - Single ANOVA Results for Model 1: Main Effects Due to Expertise ... 35
Table 16 - Single ANOVA Results for Model 1: Main Effects Due to Alarm Activity ... 36
Table 17 - Single ANOVA Results for Model 2: Main Effects Due to Interface ... 38
Table 18 - Single ANOVA Results for Model 2: Main Effects Due to Expertise ... 39
Table 19 - Non-parametric Results: Interface Type ... 40
Table 20 - Non-parametric Results: Expertise ... 41
Table 21 - Non-parametric Results: Alarm Activity ... 42
Table 22 - Correlation Between Fixation Frequency and Gaze Duration ... 43
Table 23 - Correlation Between Gaze Percentage and Dependent Variables ... 44
Table 24 - Correlation Between Speed and Accuracy and Dependent Variables ... 45
v
LIST OF FIGURES
Figure 1 - Sequence and timestamps of failures for the hard workload level ... 17
Figure 2 - SMI eye-tracking glasses used during the experiment (http://eyetracking.tistory.com/14) ... 19
Figure 3 - Location of the setpoint failure ... 24
Figure 4 - Diagram illustrating how AOIs are used to include or exclude data for analysis ... 25
Figure 5 - Participant 1: 60 seconds after setpoint failure ... 47
Figure 6 - Participant 1: 30 seconds before and after opening FP ... 48
Figure 7 - Participant 2: 60 seconds after setpoint failure ... 48
Figure 8 - Participant 2: 30 seconds before and after opening FP ... 49
Figure 9 - Participant 3: 60 seconds after setpoint failure ... 50
Figure 10 - Participant 3: 30 seconds before and after opening FP ... 50
Figure 11 - Participant 4: 60 seconds after setpoint failure ... 51
Figure 12 - Participant 4: 30 seconds before and after opening FP ... 51
Figure 13 - Participant 5: 60 seconds after setpoint failure ... 52
Figure 14 - Participant 5: 30 seconds before and after opening FP ... 52
Figure 15 - Participant 6: 60 seconds after setpoint failure ... 53
Figure 16 - Participant 6: 30 seconds before and after opening FP ... 53
Figure 17 - Participant 7: 60 seconds after setpoint failure ... 54
Figure 18 - Participant 7: 30 seconds before and after opening FP ... 54
Figure 19 - Participant 8: 60 seconds after setpoint failure ... 55
Figure 20 - Participant 8: 30 seconds before / after opening FP ... 55
Figure 21 - Participant 9: 60 seconds after setpoint failure ... 56
Figure 22 - Participant 9: 30 seconds before and after opening FP ... 56
vi
GLOSSARY OF ABBREVIATIONS
AOF: Alarm on FaceplateAOI: Area of Interest
C-FIC-13803: Fuel Oil Controller C-FIC-13804: Fuel Gas Controller
C-TIC-13807: Crude Temperature Controller FP: Faceplate
MOF: Mode on Faceplate
MPDT: Mean Percentage Dwell Time PHV: Process History View
PV: Process Variable ROF: Reading on Faceplate
SCADA: Supervisory Control and Data Acquisition SCLTC: South Central Louisiana Technical College
SMI ETG: SensoMotoric Instruments Eye Tracking Glasses SP: Setpoint
TTC: Time to Complete TTF: Time to Faceplate
vii
ABSTRACT
There is lacking research within the Petrochemical Industry that uses eye-tracking to explore the differences between the strategies of expert and novice control room operators as they monitor and address process parameters that could be used to improve novice training programs and interface design. Scan paths and three eye-tracking metrics (Fixation Frequency, Gaze Duration Mean, and Gaze
Percentage) were used to investigate the differences in eye behavior of three expert control room operators and six novice students as they monitored and corrected a Crude Refinement simulation.
A 2x2x2 mixed factor design was used to explore the effects that expertise (expert and novice), interface type (black and grey), and alarm activity (active and inactive) had on participant eye behavior specifically, fixation frequency, gaze duration mean, and gaze percentage for certain areas of interest. The display was separated into 6 different areas and each area resulted in distinct eye statistics. Scan paths were plotted surrounding a subtle setpoint change within the simulation and were qualitatively analyzed to reveal differences due to expertise, interface type and alarm activity.
The MANOVA revealed no significant differences due to expertise, interface type, and alarm activity. The single ANOVAs revealed that participants had higher fixation frequencies on the Main display during monitoring periods than during active periods revealing that both expert and novice participants’ attention was more divided when there were failures and alarms present than when the process was running at normal conditions. Also, experts spent a larger percentage of time monitoring the critical crude temperature and flow controller than novices. Pearson’s correlation between dependent variables revealed a positive correlation between fixation frequency and gaze percentage that indicated that participants typically had many, quick fixations rather than few, long fixations. Scan path analysis revealed that active monitoring and interface background color influenced how quickly operators discovered the setpoint change on screen. Overall, eye-tracking successfully detected differences between participants and interface types that can benefit novice training and display design.
1
CHAPTER 1. INTRODUCTION
The petrochemical industry experiences losses of up to $10 billion dollars annually due to
preventable work-place accidents. If not controlled and regulated properly, petrochemical processing can be volatile and may lead to catastrophic incidents, which is why safety is such a high priority. Good interface design is a crucial safety factor that contributes to accident prevention (Johannsen, 1997; Yung-Sen & Sheue-Ling, 1995). In critical situations, good interface designs allow operators to easily access and interpret necessary real-time information in a timely manner. By providing displays with appropriate process information, operators can make speedy and correct decisions to avoid damages and losses.
In several accident investigations, inadequate interface designs were identified as contributing factors to the accident. In 2005, a series of explosions took place during the start-up of a hydrocarbon isomerization unit at the BP Texas City refinery killing fifteen workers and injuring 180 more. The investigation determined that a poor computerized control board display contributed to the accident. The display did not provide the flow information in and out of the raffinate unit on the same screen. The failure to have both readings on the same screen impeded the operator from knowing how much liquid was in the unit and that he needed to divert some liquid to storage (U.S. Chemical Safety and Hazard Investigation Board, 2007). Another accident attributed in part to poor interface design occurred in 2008, at the Bayer CropScience facility in Institute, West Virginia, where a runaway chemical reaction caused a methomyl vessel to explode, killing 2 and injuring 8 people. After further investigation by the U.S. Chemical Safety and Hazard Investigation Board (2008), the introduction of a new control system and inadequate board operator training were contributing factors. The new system was supposed to decrease human-related error but operators found it difficult to familiarize themselves with the new display screens and different units of measure than the old system.
Efficient visual displays can contribute to safe operations. Poorly designed console displays have led to tragic accidents as was the case at the BP Texas City refinery. One goal to increase safety is aimed at increasing operator performance by improving the usability of the display/user interface. Interface
2
design strongly influences the ease of access to real-time information allowing operators to make accurate and timely decisions. General interface design research has considered the effects of color, presentation style and location of information (pictorial, numerical, graphical, etc.), as well as navigation on
performance (Burns, 2000; D'Souza & Greenstein, 1999; Wu, Chen, Lee, & Chen, 2010). If the interface used to control and monitor the process is distracting and difficult to navigate operators are more likely to commit mistakes. When critical information is hard to find within the display or there are distracting items on-screen, mistakes or time delays are likely to occur. By considering these common features, designers can create displays that support high performance and ease of use.
Recently, eye-tracking has become a popular technique within Human Computer Interaction (HCI) research to develop improved visual display designs. Eye-tracking allows researchers to identify how users scan a display, locate areas that are frequently looked at versus areas that are often neglected, and detect instances when the user is confused by an object on-screen. Such knowledge would be very difficult to gain through other measurement tools such as observations and surveys (Cooke, 2005). By acquiring information using eye-tracking technology, designers can ensure pertinent information is visible and remove or redesign objects that are difficult to interpret. HCI researchers have also studied color appeal in website design (Cyr, Head, & Larios, 2010), user adaptability to website design (Tzanidou, Petre, Minocha, & Grayson, 2005), and the cognitive processing of visual information during reading and searching tasks (Mele & Federici, 2012). Information obtained from collecting and analyzing eye
movement data can be applied to improve usability of visual displays.
The data recorded from tracking eye movements can be used to improve the usability of a system by identifying differences between expert and novice cognitive processing and describing an individual’s attention allocation. It can also be used to study monitoring and search task strategies and as an indicator of performance (Poole & Ball, 2005). Useful information, such as techniques and strategy, can be attained from studying the eye movements of experts. How experts scan the display or what information experts are focusing on when certain events occur can aid in display design (Poole & Ball, 2005). By
3
knowing what information experts attend to during certain tasks, display designers can ensure such information is salient. Expert strategy can also be useful when training novice operators on how to interact with the display.
Although there is research that uses eye-tracking technology regarding cognitive processing of visual information for general displays, there is little research that uses eye-tracking to evaluate the cognitive processing of displays in SCADA systems. SCADA, Supervisory Control and Data Acquisition, systems are a type of control system that collects and displays data and allows users to manipulate and control the system from a distant location. The petrochemical industry uses SCADA systems to control the petroleum refining process from a centralized control room. Addressing this gap, the goal of this research is to use eye-tracking technology to investigate the strategy and behavior of expert and novice control room operators while managing a simulated petrochemical SCADA system. Using eye-tracking to explore the strategy of experts and novices may lead to insightful improvements to operator interfaces. By identifying their strategy, displays and presentation of information can be
designed in a manner that supports high performance. The scope is limited to investigate the strategies of operators during the crude distillation process within petroleum refining using one SCADA system, DeltaV (Emerson Process Management, Round Rock, TX).
4
CHAPTER 2. REVIEW OF THE LITERATURE
2.1 Introduction
Research into usability and interface design is relevant to the petrochemical industry, which relies on interface consoles to control highly complex systems. The petrochemical industry uses SCADA displays primarily to monitor and control processes. In order for operators to monitor and control the process effectively, the interface needs to provide real-time information rapidly and in a form consistent with their mental model. Operator interfaces should be designed compatibly with the user’s needs (Murphy & Mitchell, 1986). Understanding the cognitive mechanisms behind user behavior is
instrumental when designing effective displays; eye-tracking is a tool that can aid in understanding such mechanisms by helping identify the “whys” behind operator behavior.
2.2 Insights into Cognitive Processes Using Eye-Tracking
Eye-tracking provides insight into the cognitive processing behind human behavior that is not available through observation and think-aloud practices (Cooke, 2005). Just and Carpenter (1976) researched eye fixation and simple cognitive tasks and concluded that what the eye is focused on is assumed to be the thought at the forefront of the mind during cognitive processing. This means that eye-tracking can be used to locate and track the user’s attention (Poole & Ball, 2005). Several industries including aviation and healthcare have used eye-tracking as a way to know exactly what individuals are focused on and the path that the eye takes when looking from one point to the next. The aviation industry has used it to study visual scanning behavior during vigilance tasks (Lavine, Sibert, Gokturk, & Dickens, 2002), pilot monitoring strategies during automated flight simulation (Sarter, Mumaw, & Wickens, 2007), as well as expert aircraft inspection strategy to use as a standard when evaluating novice inspector’s performance (Gramopadhye et al., 2002). The healthcare and medical industries have used eye-tracking to investigate attention allocation of surgeons (Tomizawa, Aoki, Suzuki, Matayoshi, & Yozu, 2012) and surgeon vigilance in the operating room (Zheng et al., 2011). In regard to expertise research, tracking the user’s attention when investigating the strategies of experts and novices is
5
extremely useful since experts’ improved decisions are attributable to their effective attention allocation strategies (Schriver, Morrow, Wickens, & Talleur, 2008). By recording where the experts’ attention is focused, their valuable attention allocation strategy can be extracted and used to improve display designs and training programs as explained in section 2.4.
2.3 Expertise: What It Means to be an Expert
Webster’s Dictionary defines expert as one “having, involving, or displaying special skill or knowledge derived from training or experience” (Merriam-Webster’s online dictionary,n.d.), though researchers in expertise research do not agree on a specific definition of expertise. Different research areas define expertise differently. Cognitive science research views expertise in regard to cognitive functioning (i.e. memory, learning to problem solve and reasoning). Based on these cognitive
measurements, cognitive science researchers find that expert performance is superior to that displayed by novices (Shanteau, 1992). In decision-making research, experts are judged mostly on accuracy and repeatability. When considering the accuracy and repeatability of expert judgments, studies show that experts are often ineffective decision makers with poor quality judgments (Shanteau, 1992). Studies on clinical psychologists (Oskamp, 1962) and court room judges (Ebbesen & Konecni, 1975), found these experts made inaccurate and unreliable decisions. Considering both cognitive sciences and decision-making sciences, it can be reasoned that just because experts have higher cognitive functioning does not mean they always make the best decisions. In general, the agreement is that experts are more skilled, competent, and think in qualitatively different ways than novices do within their specific domain (Cellier, Eyrolle, & Marine, 1997; Glaser & Chi, 1988; Shanteau, 1992).
Although cognitive science research cannot answer all questions regarding expertise, it does give insight into expert performance. Cognitive science investigates expert performance by looking at the cognitive abilities of experts assumed to be attained through an extensive period of training and development (Ericsson, 2005). Experts are able to perceive meaningful patterns within their domain, which does not imply that experts have a general superior perceptual ability but rather have a greater
6
organization of their knowledge base; they are able to recall things in meaningful clusters or chunks (Glaser & Chi, 1988). “Chunking” allows experts to perceive and store information in terms of chunks rather than at the lowest-level unit (Anderson, 1996).
In addition to the ability to “chunk” information, experts are overall faster than novices and solve problems with little error (Glaser & Chi, 1988). There is a large amount of literature that supports the claim of performance differences between experts and novices found predominantly in tasks that are knowledge based (Chase & Simon, 1973; Hampton, 1994; Vicente, 1992). Although experts are faster overall, they are slower in the initial stages of problem solving (Glaser & Chi, 1988). It is common for experts to spend more time analyzing a problem quantitatively trying to understand and retain all facets of the problem (Glaser & Chi, 1988). On the other hand, novices tend to hastily start solving problems without analyzing them (Glaser & Chi, 1988).
Shanteau (1992) describes five different characteristics observed in expert decision strategies. First, experts are more disposed to making adjustments to initial decisions whereas novices tend to blindly commit to initial choices. Second, experts rarely work in isolation and instead work in groups or seek help from others to make better decisions. Operation in groups increases accuracy and confidence of decisions (Sniezek & Henry, 1990). Third, experts often use decision aids to avoid biasing decisions. The fourth characteristic of expert strategies is the effort to avoid making large mistakes. Experts initially make an estimate then make minor adjustments after a more careful analysis. Lastly, experts often operate by breaking larger problems into smaller, more manageable pieces.
2.4 Eye-Tracking to Improve Training and Interface Design
Identification of cognitive mechanisms and strategies of experts has strong implications for novice training. One of the motivations behind expertise research is to improve the training of the less skilled to behave and think like experts (Ericsson, 2005; Klein, 2008). Expert strategies are desirable as they correlate with superior performance. Bellenkes, Wickens, and Kramer (1997) observed that expert
7
and novice aviation pilots utilized different scanning techniques when flying and found higher
performance ratings (measured by reduced flight path error and faster reaction times) were correlated with scanning techniques of expert pilots over novices. This research supports training novices to think and act like experts to increase novice performance. Likewise, Gopher et al. (1994) demonstrated this approach to training in a study on flight cadets’ video game strategy. Cadets were trained in the game task to use strategies based on analysis of expert behavior. The number of errors reported by flight cadets trained to apply the same type of strategy used by expert gamers decreased compared to cadets not trained. The use of eye-tracking to investigate expert strategy can be highly advantageous for training programs for novice individuals with the possibility of expediting the novice to expert process.
Another advantage to using eye-tracking to investigate expert and novice strategy is its implications for improved usability and design of interfaces. Interface deficiencies can be identified when there is a large gap between expert and novice performance on a particular task (MacDorman, Whalen, Ho, & Patel, 2011). Good interface design allows ease of use when interacting with the system and extracting information for all users. If there is a specific task identified where novice performance is highly inferior to experts, certain eye-tracking measurements can identify specific objects that are difficult to interpret or extract information from (Jacob & Karn, 2003; Just & Carpenter, 1976). By investigating eye movements of users, designers can create displays suited to the user.
2.5 Using Eye-Tracking to Investigate Expert Strategy
Eye-tracking has been used to observe expert strategies as an alternative to the think-aloud technique (users vocalize what they are looking at, thinking about, and doing). Eye-tracking allows researchers insight into behavior with minimal interruption and into periods when the users are not aware of their own behavior. In 2007, Fisher and Pollatsek used eye-tracking to study driver attention allocation and found that when novices exploited expert scanning strategies, their ability to identify risky situations increased and drivers allocated more of their attention toward areas of high-risk. Bellenkes et al. (1997) used eye-tracking to investigate the scanning techniques of expert and novice pilots. They found that
8
experts tended to scan to vital instruments more frequently and novices tended to dwell on instruments longer. Fisher and Pollatsek (2007) found that experts had more fixations in high-risk areas indicating their ability to identify risk while driving. Bellenkes et al. (1997) found experts had more fixations on important instruments while flying indicating their ability to attend to relevant information. Both studies used fixation frequency to extract information regarding expert strategy.
2.6 Basic Eye-Tracking Measurements
There are basic elemental measurements used to record eye movements:
1. Area of Interest (AOI) – a defined area within a field of view in which statistics and measurements can be calculated for the individual area. The AOI size and location is at the discretion of the researcher depending on the purpose of the task.
2. Gaze – (or “dwell”) the combination of consecutive fixations within a small prescribed area. 3. Fixation -- a quick stop of the eye or when the eyes are relatively stationary and are most
commonly measured in regard to duration and frequency. 4. Point-of-regard – the location where the eye is actually focused
5. Saccade – the rapid movement of the eye from one fixation point to another.
6. Scan path -- the combination of fixations and saccades. It identifies the order and location of each fixation; it follows a saccade-fixation-saccade pattern (Poole & Ball, 2005).
2.7 Eye-Tracking in Aviation and Health Care
Extensive research in the aviation and healthcare industries uses eye-tracking to investigate the behavior and strategy of expert and novice pilots and physicians. Since the needs of the petrochemical operator are similar to the needs of aviation pilots and physicians in that they all require access to real-time process information to make decisions in stressful, high real-time pressure situations, the research should be applicable to petrochemical operators as well. The most common eye metrics used to investigate pilot and physician strategies are the number of fixations per AOI (or Fixation Frequency per AOI), gaze or “dwell” percentage on each AOI, gaze duration mean for AOIs, and scan path.
9 2.7.1 Number of Fixations per AOI
The number of fixations per AOI is a count of fixations that are located within a defined area. This metric indicates how often participants glance at specific areas; more frequent fixations to an area can indicate its importance (Fitts, Jones, & Milton, 1950). Ottati, Hickox, and Richter (1999) found differences in Fixation Frequency between expert and novice pilots during a navigation flight simulation. Pilots were able to reference a 90° forward field of view map representation of their current location during flight to stay on course which researchers treated as the area of interest. Experts had a higher Fixation Frequency to the reference map than novice pilots. Novices made more frequent fixations outside of the cockpit and also had more difficulty keeping the correct altitude. This may indicate novices’ decreased ability to navigate based on the map; they relied more heavily on terrain features outside of the cockpit to navigate. Experts paid more attention to the map in the cockpit and were able to keep the correct altitude, which may demonstrate the importance of being able to navigate based on the map with less reliance on the terrain. Within the health care industry, Zheng et al. (2011) conducted a study on surgeon vigilance in the operating room and found that expert surgeons glanced more frequently at the anesthetic monitor than novices especially during times when the patient was unstable. Novices tended to focus most on the surgical task. In both studies, higher fixations were associated with more relevant information.
2.7.2 Gaze Percentage per AOI
Gaze or “dwell” percentage per AOI refers to the proportion of time the eyes dwell on a specific AOI for the entire session. Schriver et al. (2008) used mean percentage dwell time (MPDT) per AOI (same as “gaze” percentage) to identify attention allocation between expert and novice pilots during a flight simulation. Pilots encountered failures such as low oil pressure, loss of significant power, and electrical failures while in simulated flight. Pilots participated in 16 trial flights; in 8 of the trials failures occurred and in the other 8 trials no failures occurred. MPDT allocated to AOIs containing information relevant cues of a failure was measured from the onset of the failure until the pilot’s first action to address
10
the failure. They found that experts allocated significantly more attention to problem relevant AOIs when a failure occurred than novice pilots. This indicates pilot expertise led them to look at appropriate
instruments. Expert pilots also allocated more attention to highly relevant diagnostic cues and less to lower diagnostic cues during failure trials; novice pilots showed the opposite trend. This means that during flights where failures occurred, expert pilots paid more attention to critical areas after failures occurred.
Caution should be taken when using Gaze Percentage per AOI as the frequency of fixations and duration of fixations are not differentiated. Two different participants may be found to have the same Gaze Percentage for each AOI but one participant focused on the AOI many times for short durations and the other focused on the AOI a few times but for long periods of time. These metrics are different and should be analyzed separately. According to Fitts et al. (1950), frequency indicates the importance of the element whereas duration indicates the difficulty of interpreting the information. Although the
importance and difficulty of interpretation is difficult to decipher using Gaze Percentage per AOI, this metric can indicate which AOIs are attended to for larger percentages of the time with regard to other AOIs. A post-testing interview can help reveal why the user paid more attention to certain areas.
2.7.3 Gaze Duration Mean per AOI
Gaze duration mean per AOI describes the average length of gazes within an AOI. Longer gazes during encoding tasks may indicate objects are difficult to interpret while shorter gazes can indicate efficiency of the glance. Bellenkes et al. (1997) researched the visual scanning pattern of expert and novice pilots. Eight important flight instruments were designated AOIs. Experts had overall shorter dwell times and more fixations than novices. Shorter dwell times indicate experts’ ability to efficiently extract information and the higher Fixation Frequency, in support of other findings, indicates the importance of the instruments. Novices had significantly longer dwell times on instruments signifying their inefficiency at extracting information (Bellenkes et al., 1997). Gegenfurtner, Lehtinen, and Säljö (2011) found similar results from their meta-analysis of eye-tracking research on expert and novice
11
comprehension of visual displays. In all domains (sports, medicine, aviation, driving, etc.) experts had shorter fixation durations and more fixations of relevant objects and fewer fixations on
task-irrelevant objects in comparison to novices. Interestingly,Taukari, Pant, and Garg (2010) found that when resolving a conflict, expert air traffic controllers (ATC) initially had fewer fixations for longer periods of time then switched to a strategy typical of experts to make more frequent but shorter fixations. They concluded that expert ATCs scattered attention initially to gain more information and then focused attention to process important and relevant information to complete the task. This is in line with previous research that expert strategies are superior in selective attention allocation and more efficient at extracting relevant information (Chapman & Underwood, 1998).
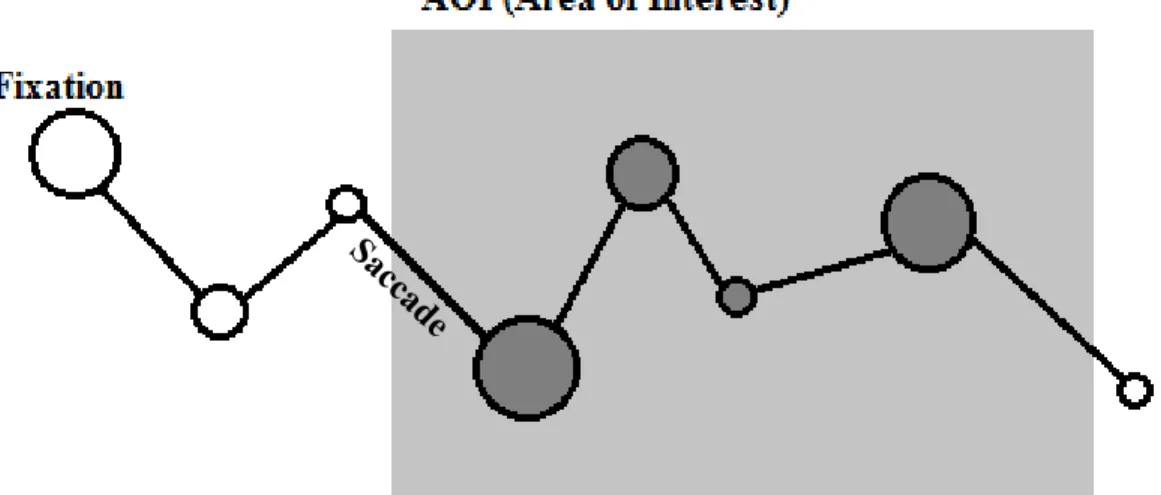
2.7.4 Scan Path
Scan paths identify the order, location, and duration of each fixation and are useful to identify the order in which items are looked at on a display. Circles represent fixations and lines represent saccades. The diameter of each circle is representative of the duration of the fixation. Order is obtained when the scan path is played back; it plots the path of the eye in real-time. Scan paths follow the pattern of fixation-saccade-fixation-saccade, etc. and can be analyzed both quantitatively and qualitatively. Quantitative analysis requires in-depth evaluation such as the string-edit method (Takeuchi & Habuchi, 2007). This technique requires the graphic to be partitioned into multiple grid-like areas (more areas yield more accurate results) and recording the location of successive fixations. Each area is assigned a letter, A-Z. The scan path is denoted by marking the letter for the series of fixations, creating a string (i.e. ABCBDIFGFGHESJDH). The string is further analyzed using a cost function. Quantitative analysis of a scan path does not necessarily analyze the plot but rather the events (fixations, saccades, etc.) that occur during the duration of the scan being plotted.
Qualitative analysis involves reviewing the scan path plot to identify any trends among
participants. Videos can be played back slowed or in real-time and watch as fixations and saccades are plotted. Still images of the complete scan path plotted can identify areas with large clusters of fixations
12
or identify areas with little or no fixations. Sullivan, Yang, Day, and Kennedy (2011) used both quantitative and qualitative methods to analyze the influence expertise had on visual scan patterns of helicopter pilots. Experts were defined by the number of total flight hours (TFH) completed. TFH negatively correlated with mean dwell time indicating that with increased expertise, mean dwell time will decrease indicating efficient data extraction. Qualitatively, expert pilots not only looked at upcoming areas on the map but also looked back at areas of the map they had just flown over. Post-experiment comments strongly supported that pilots looked back to gain confidence in their flight orientation. This is insightful information regarding expert scanning strategy that can be utilized to train novice pilots.
Scan patterns have also been used to explain behavioral differences between expert and novice surgeons examining x-rays. Expert surgeons first examined areas of the x-ray where tumors were most likely to appear while novices tended to examine the x-ray more evenly (Kundel & LaFollette, 1972). With more experienced observers, it appears that searching is often driven by the expectancy of where the target will most likely be found.
2.8 Variability of Eye-Tracking Metrics
Some eye-tracking metrics can be interpreted differently depending on the type of task being performed. For an encoding task, a higher Fixation Frequency indicates higher importance or saliency, whereas during a search task, a higher Fixation Frequency indicates uncertainty and difficulty extracting information (Jacob & Karn, 2003). When considering gaze duration, longer gazes during an encoding task indicate difficulty interpreting the object, but for a search task, longer gazes indicate that the item is more engaging. Table 1 summarizes the common metrics and their meaning based on context.
Eye-tracking has been applied in an array of industries. In health care, researchers used AOI Fixation Frequency of surgeons performing extracorporeal circulation tasks during cardiovascular surgery to interpret attention allocation and found that expert perfusionists distributed their attention to relevant areas better than the intermediates and novices (Tomizawa et al., 2012). In aviation, researchers used
13
Table 1 - Eye-Tracking Metrics and What They Measure Based on Task Type
Eye-Tracking Metric Encoding Task Search Task
Number of Fixations per AOI
More fixations indicate higher importance or is more salient (Jacob & Karn, 2003)
More fixations indicates more uncertainty in recognizing item (Jacob & Karn, 2003)
Gaze duration mean per AOI
Higher duration indicates more difficulty interpreting information (Just & Carpenter, 1976)
Higher duration indicates the item is more engaging (Just & Carpenter, 1976) Encoding & Search Tasks
Gaze Percentage per AOI A positive correlation can indicate difficulty to interpret as well as the relative importance of the element (Fitts et al., 1950)
eye-tracking to analyze pilot automation monitoring patterns and performance. Through AOI dwell time and fixation frequencies, they pointed out deficiencies in pilot’s monitoring strategies (Sarter et al., 2007). Currently, there is extensive research using eye-tracking to investigate expert strategy of aviation pilots and medical surgeons, but there is little research in the area of supervisory control system operators such as petrochemical operators. The demands on operators are similar to pilots and surgeons in that they both need to make decisions based on real-time information that must be extracted from their consoles and/or surroundings and it is here that they differ. Pilots control their aircraft with the board of instruments in the cockpit and receive feedback from their immediate surrounding (i.e. pilots are able to look out the window to aid in orientation discrimination or to determine their heading). Surgeons extract information through physical feedback (i.e. excessive bleeding, patient seizures, etc.) as well as from monitor screens. Petrochemical operators monitor and manipulate the process from a control center through their console, which consists of sets of computer screens. Not all process information is displayed concurrently and operators have to navigate through screen displays to locate and access information and controls. These operators get little feedback from visual contact with the physical system that they control. In this way, the needs of a petrochemical operator are different which is why the current research intends to use eye-tracking methods to investigate the strategy of expert and novice operators of SCADA systems.
14
CHAPTER 3. METHODS
3.1 Background on Previous Research
The current research was an extension of previous research conducted at Louisiana State
University, Mechanical and Industrial Engineering Department by Koffskey, Ikuma, and Harvey (2013), sponsored by the Center for Operator Performance. In the previous study, two SCADA interfaces were evaluated using performance (speed and accuracy), situation awareness, perceived workload ratings, and eye-tracking metrics during three 30-minute crude refinement simulations at three different workload levels (easy, medium, and hard). Each participant encountered only one interface that was randomly assigned. Four expert operators and twenty-four novice students participated. Fixation Frequency per AOI and overall Fixation Frequency were the eye-tracking measurements used and three AOIs were defined (Main display, Alarm Banner, and Faceplate). Each session involved a 30-minute simulation of a crude refining unit in which the operator was instructed to maintain the system and take action when failures occurred. The two types of failures were pumps shutting off (referred to as pump failures) and mode and setpoint malfunctions (referred to as cascade failures). The crude refinement process was simulated using DeltaV, a process management software produced by Emerson Process Management.
The current research focused on the relationship between expertise, eye-measurements and performance when using the two SCADA displays. Two different interfaces (black and grey) at two expertise levels (expert operator and novice student) were evaluated during active and inactive alarm periods. Specific eye measurements and performance metrics were collected. Table 2 summarizes the independent and dependent variables for the previous and current research.
3.1.1 Simulation and Interface Design
The boundaries of the simulated crude refinement process began with the crude storage tanks and ended at the overhead receiver. The simulation consisted of seven displays that the participant could navigate through: overview, crude storage tanks, desalter, heater, tower bottom, tower top, and overhead
15
receiver (See Appendix 1). The two interfaces (grey and black) had both functional and cosmetic differences as displayed in Table 3.
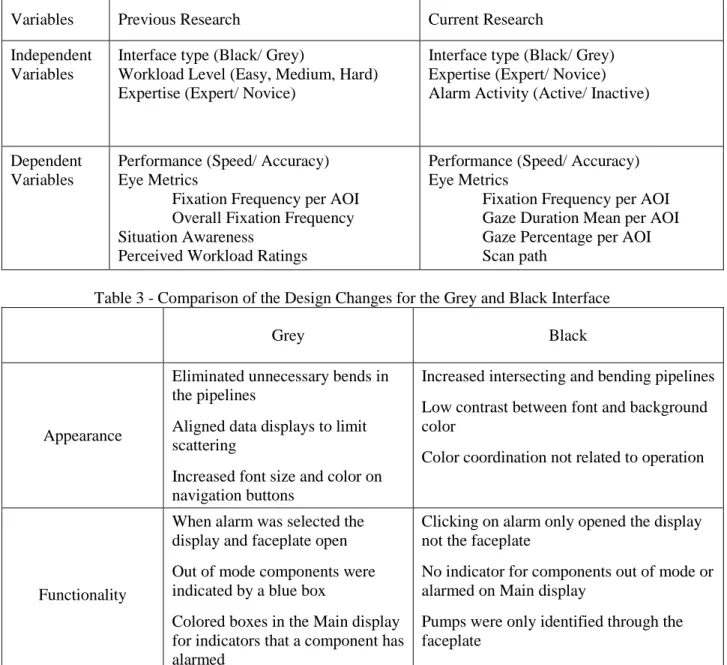
Table 2 - Independent and Dependent Variables for Previous and Current Research
Variables Previous Research Current Research
Independent Variables
Interface type (Black/ Grey)
Workload Level (Easy, Medium, Hard) Expertise (Expert/ Novice)
Interface type (Black/ Grey) Expertise (Expert/ Novice) Alarm Activity (Active/ Inactive)
Dependent Variables
Performance (Speed/ Accuracy) Eye Metrics
Fixation Frequency per AOI Overall Fixation Frequency Situation Awareness
Perceived Workload Ratings
Performance (Speed/ Accuracy) Eye Metrics
Fixation Frequency per AOI Gaze Duration Mean per AOI Gaze Percentage per AOI Scan path
Table 3 - Comparison of the Design Changes for the Grey and Black Interface
Grey Black
Appearance
Eliminated unnecessary bends in the pipelines
Aligned data displays to limit scattering
Increased font size and color on navigation buttons
Increased intersecting and bending pipelines Low contrast between font and background color
Color coordination not related to operation
Functionality
When alarm was selected the display and faceplate open Out of mode components were indicated by a blue box
Colored boxes in the Main display for indicators that a component has alarmed
Clicking on alarm only opened the display not the faceplate
No indicator for components out of mode or alarmed on Main display
Pumps were only identified through the faceplate
3.2 Experiment Overview and Design
The focus of the current research investigated the strategy and behavior of expert and novice petrochemical operators during the experiment sessions described in section 3.1 using eye-tracking and performance metrics. For the current research, three experts and six randomly selected novice
16
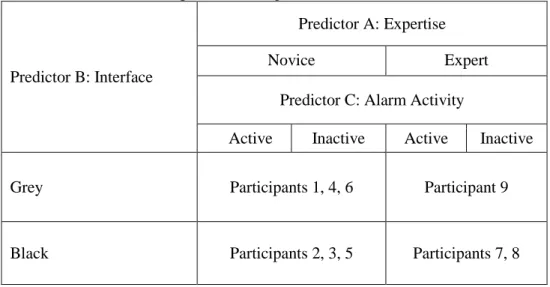
participants’ results were analyzed. A 2x2x2 experiment design was used (See Table 4) to manipulate interface type, expertise level, and alarm activity. Interface type was a between-subjects variable evaluated using two different interfaces: the black interface and the grey interface. Expertise level was a between-subjects variable evaluated at the novice level and the expert level. Alarm activity was a within-subjects variable evaluated for active and inactive periods. Alarm activity refers to periods during the simulation when alarms are active in the Alarm Banner (active) and when there are no alarms active in the Alarm Banner (inactive). The dependent variables were Fixation Frequency per AOI, gaze duration mean per AOI, Gaze Percentage per AOI, scan path, speed and accuracy.
Table 4 - Experiment Design and Predictor Variables
Predictor B: Interface
Predictor A: Expertise
Novice Expert
Predictor C: Alarm Activity
Active Inactive Active Inactive
Grey Participants 1, 4, 6 Participant 9
Black Participants 2, 3, 5 Participants 7, 8
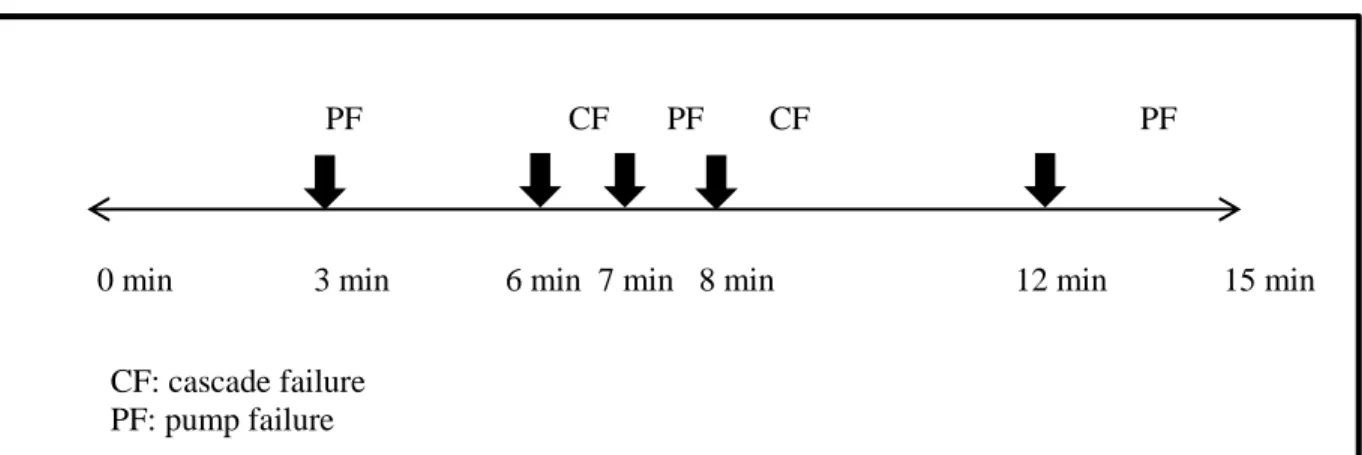
Since eye behavior was investigated at different alarm activity levels (active/ inactive), only the first fifteen minutes of the hard level was used for analysis in order to acquire evenly balanced active and inactive periods; it had approximately 8 minutes active and 7 minute inactive periods. The first fifteen minutes contained five failures (three pump failures and two cascade failures). The last fifteen minutes had a large number of failures that occurred within minutes of each other and would have an
overwhelming number of active periods if the operators fell behind in their corrective actions. For this reason, the last half of the hard workload level was excluded from analysis. The number, type, and timing of events for the first 15 minutes of the hard workload level is illustrated in Figure 1.
17
Figure 1 - Sequence and timestamps of failures for the hard workload level
The specific goals of the current research were as follows.
1. Quantify differences in Fixation Frequency, Gaze Duration, and Gaze Percentage per AOI between expert and novice operators during active and inactive times.
2. Identify differences between scan patterns of expert and novice operators during active and inactive times.
3. Quantify differences in Fixation Frequency, Gaze Duration, and Gaze Percentage per AOI between two different interfaces.
4. Identify differences between scan patterns of operators using two different interfaces. 5. Correlate operator performance (speed and accuracy) with eye behavior specifically Fixation
Frequency, Gaze Duration Mean, and Gaze Percentage per AOIs.
3.3 Participants
A total of 9 participants were used for the study: 3 experts and 6 novices. Four expert operators and twenty-four novice students participated in the previous experiment but due to poor traceability of one expert who wore glasses, eye-tracking data was only collected for three experts. Since only three experts were included, only six of the twenty-four novices were included to keep the sample sizes similar, three were randomly selected from the black and three from the grey. Complete eye-tracking data
included those with a tracking ratio of 95% or higher for the eye-tracker and completed simulations in PF CF PF CF PF
0 min 3 min 6 min 7 min 8 min 12 min 15 min
CF: cascade failure PF: pump failure
18
which all scheduled failures occurred. Tracking ratio is defined as the “number of non-zero gaze
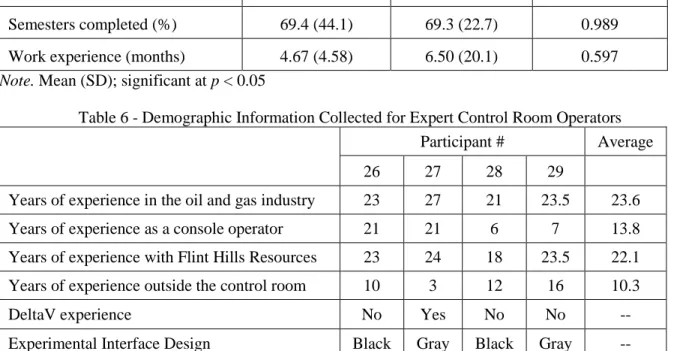
positions divided by sampling frequency multiplied by run duration expressed in percent” (SensoMotoric Instruments, 2011a). Participants with sessions considered to have “glitched” because one or more failures did not occur due to a malfunction of the software were excluded. Console operators were voluntarily recruited from Flint Hills Resources in Corpus Christi, Texas as experts. Novices were recruited from students at South Central Louisiana Technical College in Reserve, Louisiana and Lambton College in Sarnia, Ontario, Canada. Students were recruited from the process technology and instrument technician programs. They had experience with process variables and controls but lacked control room experience, which made them suitable to represent the novice population. Demographic information for novices included number of semesters completed in school, work/ internship experience in the industry, degree in pursuit of, and experience with DeltaV. Expert demographic information included years of experience as a console operator, years with Flint Hills, years in the oil refining industry, and years as a field engineer. Demographic details for novice and experts are captured in Tables 5 and 6.
Table 5 - Demographic Information Collected for Novice Students
Lambton Students (n = 12) SCLTC Students (n = 12) P-value Semesters completed (%) 69.4 (44.1) 69.3 (22.7) 0.989
Work experience (months) 4.67 (4.58) 6.50 (20.1) 0.597
Note. Mean (SD); significant at p < 0.05
Table 6 - Demographic Information Collected for Expert Control Room Operators
Participant # Average
26 27 28 29
Years of experience in the oil and gas industry 23 27 21 23.5 23.6
Years of experience as a console operator 21 21 6 7 13.8
Years of experience with Flint Hills Resources 23 24 18 23.5 22.1
Years of experience outside the control room 10 3 12 16 10.3
DeltaV experience No Yes No No --
Experimental Interface Design Black Gray Black Gray --
19 3.4 Eye-Tracking
Eye-tracking was used to evaluated eye behavior and scanning strategies of novice and expert console operators. Head-mounted SMI ETG, SensoMotoric Instruments Eye-tracking Glasses, (SensoMotoric Instruments, Inc., Boston, MA) recorded and analyzed eye-movement (Figure 2). SMI ETG are portable and allow the head and neck to move freely. SMI ETG are binocular tracking devices that have two small cameras on the rim of the glasses (one camera recording the left eye and one camera recording the right eye) and an HD scene camera on the front of the glasses. The two small cameras capture eye movements and map the point-of-regard (where the eye is focused) into the scene video (SensoMotoric Instruments, 2011b). The SMI ETG system uses iView (SensoMotoric Instruments, Inc., Boston, MA) to record eye-tracking data. SMI’s BeGaze software was used for analysis.
Figure 2 - SMI eye-tracking glasses used during the experiment (http://eyetracking.tistory.com/14)
3.5 Experimental Procedure (Previous Research)
The previous research followed IRB-approved experimental procedures, and the steps pertaining to the current research are reviewed here. During the first session, participants trained to use the DeltaV simulator by reading a training document and practicing a simulated pump failure and cascade failure. Upon training completion, the eye-tracking glasses (ETG) were positioned on the participant and
20
calibrated using 3-point calibration. 3-Point Calibration, the highest level of calibration available in BeGaze, was used for all participants because it is more accurate than 0- or 1-Point Calibration. It requires three triangular calibration points in the same plane for optimal accuracy. To calibrate the ETG, the participant needs be wearing the ETG. The experimenter clicked the “3-Point Calibration” button, then instructed the participants to focus their eyes on a particular object. Once the participant fixated there, the experimenter clicked on the object in the scene and the participant was instructed to look at the next object. The three calibration objects were the top left corner of the screen, the top right corner of the screen, and a green button at the bottom edge of the screen. Eye-tracking data was recorded continuously during the entire 30-minute simulation that followed. The remaining two sessions consisted of a quick reminder of how to address failures followed by the 30-minute simulation. In total, participants completed three sessions using a single interface type, one at each workload level (Table 2).
3.5.1 How to Address Failures Within Scenarios
The operator’s goal was to maintain the system’s steady state so when failures occurred the operator should adjust values to match the original steady state values. The original steady state value was the value at the start of the simulation. When the simulation began, the system was in a steady state meaning all values were in range and no alarms were occurring. The original steady state values could be obtained by opening the process history, which gave live charting of values as well as a history. The two types of failures that occurred were pump and cascade failures. Pumps are used in the crude refining process to push crude through the system. To fix a failed pump, the operator had to acknowledge the alarm, restart the failed pump, and readjust the flow through the down-stream valve to within +/- 50 barrels per day (bpd) of the original steady state value. Cascade failures were failures within a cascade loop, which consisted of two components that were directly affected by each other. The slave
component’s mode is cascade and looks to the master component to make adjustments. The master is in auto and is directly affected by changes in the slave. For example, the heater crude temperature is the master component in the cascade loop with the fuel source (slave). The fuel valve looks to the temp to
21
see what it should be set at. If the temperature is too high, the valve will close to decrease the fuel and if the temperature is too low the valve will open more allowing more fuel into the furnace. To address a failure within a cascade loop, the flow needs to be adjusted to +/- 50 barrels per day (bpd) of the original steady state value and the slave component’s mode must be put back into cascade (CAS).
3.6 Experimental Procedure (Current Research)
The current experimental procedure consisted of the actions required to analyze the eye-tracking data for the 15-minute segment of the hard difficulty level simulation. The AOI Editor and Event Statistic features of BeGaze were used.
1. Participants were randomly selected to be included in the study. Three of the four expert
participants were included; the fourth expert with no eye-tracking data was excluded. Six student participants from the eligible participant pool were randomly selected using the random function generator in Excel. The eligible participant pool excluded participants with a tracking ratio lower than 95%, participants who encountered glitched simulations, and participants whose
eye-tracking recording went corrupt or froze in the middle of recording. In order to make sure the novice participants were split evenly between interface types, three novices were randomly selected from the black interface pool and three from the grey interface pool. Novice participants 1, 6, 8, 15, 23, and 25 were selected. Participants 1, 15, and 25 used the grey interface and participants 6, 8, and 23 used the black interface.
2. AOIs were created and saved using AOI Editor. Each stimulus was opened in the AOI Editor, and the drawing tools were used to create and label the AOIs. Separate AOI’s were created to distinguish between active and inactive periods. AOIs are further discussed in section 3.8. 3. AOIs were mapped for each stimulus video. For each stimulus, relevant AOIs were opened and
irrelevant AOIs were made invisible. AOI mapping was where AOIs were resized and repositioned frame by frame to fit the corresponding area of the scene video. AOI mapping is further discussed in section 3.9.
22
4. Event Statistics were opened to retrieve eye metric data. The AOI Detailed Statistics template under Event Statistics was opened to calculate Fixation Frequency, Gaze Duration Mean, and Gaze Percentage. Certain stimuli and AOIs were highlighted to limit the displayed statistics to specific stimuli and AOIs.
5. Statistics were recorded in the data collection sheet. Statistics collected from Event Statistics were assembled in an Excel spreadsheet and analyzed using SPSS.
The following procedure outlines the steps required to create scan path plots for all participants using Semantic Gaze Mapping.
1. Semantic Gaze Mapping was used to map each fixation to a reference image for each stimulus. Semantic Gaze Mapping allows the user to map each fixation onto a reference image in order to create a scan plot. Semantic Gaze Mapping is further discussed in Section 3.7.4.
2. Scan path plots were created. The scan path plot could only be created after gaze mapping had taken place. Once gaze mapping was complete, the scan path feature was opened which automatically displayed the scan path plot.
3.7 Obtaining Eye Metrics through BeGaze Software
The following sections describe how each eye metric was obtained through BeGaze and what detailed statistics were required to construct each metric.
3.7.1 Fixation Frequency per AOI
Fixation Frequency per AOI for each participant-AOI combination was obtained from the AOI Detailed Statistic template. There was no Fixation Frequency parameter so “Fixation Count” was divided by the AOI visible time to calculate Fixation Frequency. The visible time was the measured time that the AOI was visible and collecting statistics. Active periods and inactive periods were considered separately.
Fixation Frequency per AOI = Fixation Count per AOI Visible time (ms) per AOI
23 3.7.2 Gaze Duration Mean per AOI
Gaze Duration Mean per AOI could not be obtained directly. Instead, it was obtained using dwell time and fixation count. Dwell time “starts at the moment the AOI is fixated and ends at the moment the last fixation on the AOI ends = the sum of durations from all fixations and saccades that hit the AOI” (SensoMotoric Instruments, 2011a). Fixation count is the number of fixations inside the AOI. By
dividing the dwell time by the fixation count for each participant for a specific AOI, Gaze Duration Mean per AOI could be obtained.
Gaze Duration Mean per AOI= Dwell time (ms) per AOI Fixation Count per AOI 3.7.3 Gaze Percentage per AOI
Gaze Percentage per AOI was obtained by dividing the total dwell time for an AOI by the total time. Total time was the entire length of each participant’s eye-tracking video clip which was 15 minutes or 900,000 ms.
Gaze Percentage per AOI= Dwell time (ms) per AOI
900,000 (ms)
3.7.4 Scan Path
Two scan paths were created for each participant from the hard scenario. During testing, it was observed that expert operators were able to detect a setpoint change quickly. To investigate why operators detected the setpoint failure quickly and whether there were differences between experts and novices, both scan plots centered on the setpoint change for C-TIC-13807 that occurred 17 minutes into the hard workload scenario. The setpoint changed from 650°F to 400°F. Figure 3 illustrates the location and subtleness of the setpoint change. Scan paths were only plotted for 1-minute long segments; any longer would yield a cluttered, unreadable plot. The first scan path mapped the eye movement during the 60 seconds after the setpoint for the Crude Temperature decreased from 650°F to 400°F. The second scan path mapped the 30 seconds before and after the faceplate (C-TIC-13807) for Crude Temperature was opened after the setpoint change. This event was very subtle; there were no immediate alarm indicators
24
or alarm boxes that indicated a change. How quickly and in what manner the expert and novice participants noticed the setpoint change was investigated. To construct a scan plot, semantic gaze
mapping was utilized. Semantic gaze mapping maps the location of each fixation onto a reference image. The reference image was a screenshot of the Main display with an opened faceplate. Appendix 3
illustrates the interface of semantic gaze mapping. The video recording plays on the right and freezes at each fixation. The fixation location is then mapped on the reference image on the left. This process was tedious but for accurate results, it is important that the mapping was precise.
3.8 Areas of Interest
AOIs were first created using the AOI editor feature in BeGaze (see Appendix 4 for screenshot of the AOI editor). AOIs are a useful tool allowing certain regions or defined areas to be distinctively analyzed. Figure 4 illustrates how AOIs were used to include and exclude data for analysis. See Table 7 for a complete list of the nine AOIs. The main eye measurements used to analyze the eye-tracking data were Fixation Frequency per AOI, Gaze Duration Mean per AOI, Gaze Percentage per AOI, and scan path. BeGaze software (SensoMotoric Instruments, Inc., Boston, MA) was used to playback and analyze recordings. The defined AOIs were Main display, Alarm Banner, Temp and Flow (T/F), Mode on
Changes from 650°F to 400°F
25
Faceplate (MOF), Alarm on Faceplate (AOF), and Readings on Faceplate (ROF). See Appendix 2 for an illustration of each AOI. When selecting and defining AOIs, the function and importance of the objects on-screen were considered. The faceplate AOIs were selected because this is where operators extract information about current levels, flow, etc. and also input changes. The Alarm Banner AOI is where operators extract information regarding alarms and their current status. The temp and flow AOI was also included because the crude temperature and crude flow are two crucial parameters to be aware of and is why the interface designers included those parameters on each display.
Figure 4 - Diagram illustrating how AOIs are used to include or exclude data for analysis
The steps required to retrieve detailed statistics regarding AOIs is as follows: 1. In AOI Editor, create and save the nine AOIs.
2. The AOIs are mapped for each stimulus or recording in AOI Editor. A stimulus is considered to be a single participant’s video recording. AOI mapping is described in more detail in 3.9. 3. Open the Event Statistics tab and select the AOI Detailed Statistics template. This template
displays statistics as one row per AOI-stimulus combination.
4. Select the appropriate stimuli and AOIs. Table 8 represents the output for the following selection: Participants 1, 2, and 3 fixation count for the Main display during active and inactive periods.
26
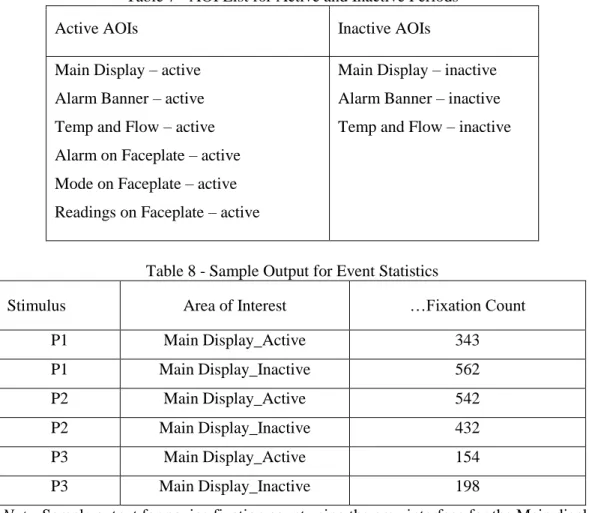
Table 7 - AOI List for Active and Inactive Periods
Active AOIs Inactive AOIs
Main Display – active Alarm Banner – active Temp and Flow – active Alarm on Faceplate – active Mode on Faceplate – active Readings on Faceplate – active
Main Display – inactive Alarm Banner – inactive Temp and Flow – inactive
Table 8 - Sample Output for Event Statistics
Stimulus Area of Interest …Fixation Count
P1 Main Display_Active 343 P1 Main Display_Inactive 562 P2 Main Display_Active 542 P2 Main Display_Inactive 432 P3 Main Display_Active 154 P3 Main Display_Inactive 198
Note. Sample output for novice fixation count using the grey interface for the Main display AOI.
3.9 AOI Mapping
Once the AOIs were created, they were mapped over the recordings. Since the ETG is non-stationary and the computer display is non-stationary, the orientation of the display changes in the scene video depending on the movement of the head wearing the ETG. This complicated the mapping of the AOIs. AOI mapping required frame by frame manipulation of the AOI size and orientation. If the head was relatively still for a series of frames, the AOIs did not require resizing, but once the head tilted to the left, right, or closer to the computer display, the orientation of the computer display changed in the scene video and the AOIs needed to be manipulated. Another consideration during AOI mapping was ensuring that the correct AOIs were visible. Since there were different AOIs for active and inactive times, the active AOIs needed to be visible and the inactive AOIs needed to be invisible. Visibility refers to the
27
capability of the AOI to record data, so when an AOI is visible, fixations that are located in the area of interest are recorded. When an AOI is invisible, the AOI is no longer visible on screen and does not record fixation data. Visibility of the AOI was also considered when the faceplate was not open. All faceplate AOIs were invisible when the faceplate was closed and visible when opened. When faceplates were opened that did not contain the mode buttons or the level readings, the particular AOIs would be turned invisible for the period that the faceplate was opened. Another consideration was the dynamic interface. The system had seven different screens but only one display could be viewed at a time. Different Main display AOIs were not created for each display, instead the same AOI was used for all seven displays. Each display functions quite similarly to the others; operators primarily monitor and scan for information using the displays. Since activities were similar between displays there was no need to use different AOIs so each individual display was considered in terms of a general “main display” AOI.
3.10 Alarm Activity
In order to analyze eye behavior based on alarm activity, separate AOI’s were created for active and inactive periods. Inactive AOI’s included Main, Alarm Banner, and Temp & Flow. Active AOI’s included Main, Alarm Banner, Temp & Flow, AOF, MOF, and ROF. The effect that alarm activity (active/ inactive) had on Fixation Frequency per AOI, Gaze Duration Mean per AOI, and Gaze Percentage per AOI were analyzed. Speed and accuracy could not be assessed during inactive times because there were no failures that occurred during inactive periods. During inactive times when there were no alarms, operators only needed to monitor the process.
3.11 Performance
Performance, in terms of speed and accuracy, was included in the study to test for correlation with eye behavior. Significant differences detected between expert and novice eye behavior and
performance could indicate which eye behavior and strategy is more efficient. It can also be an indicator of which interface type is more efficient in terms of allowing users to complete tasks faster and more accurately. Speed was measured in seconds required to complete tasks. Tasks were defined as the
28
required actions to correct and maintain the system. Task time was measured from the time the alarm was triggered to event completion. Each event had certain requirements to be considered complete. The simulation was preprogrammed to indicate a time stamp when each event was completed, if completed. Accuracy was measured as a percentage using two different metrics: correct steps completed out of the total number of steps required and the total number of events completed out of the total number of events that occurred. Previous analysis found speed to be significantly slower for the black (M = 233s, SD = 147s, p < 0.05) interface versus the grey interface (M = 180s, SD = 123s, p < 0.05). Accuracy for the grey interface (M = 74.4%, SD = 26.2%, p < 0.05) was significantly higher than for the black interface (M = 58.6%, SD = 26.5%, p < 0.05) in regard to the total number of events completed. The sample of 6 novices included in the current experiment were tested for their representativeness of the entire initial group of novices using a t-test (Table 9). % Complete, % Correct, and TTF showed no significant differences between groups. TTC showed a significant difference because of the large deviation in TTC among the six thesis participants.
Table 9 - Independent T-Test between Thesis Participants and Entire Sample Size
Thesis Sample Entire Sample
Mean (SD) n Mean (SD) n p-value
% Complete .494 (.241) 6 .486 (.216) 18 0.751 % Correct .626 (.181) 6 .613 (.107) 18 0.184 TTF 118 (65.8) 6 93.5 (43.3) 18 0.309 TTC 299 (158) 6 287 (68.4) 18 0.016* Note. *Significant at p < 0.05 3.12 Hypothesis
The main hypothesis predicted that there would be a significant difference between expert and novice eye behavior.
H0 : Expert Eye Metrics = Novice Eye Metrics H1 : Expert Eye Metrics ≠ Novice Eye Metrics
29
Individual hypotheses predicted that experts would have higher fixation frequencies than novices, experts would have shorter mean dwell durations than novices, and experts would have more optimal scan paths than novices.
3.13 Data Analysis
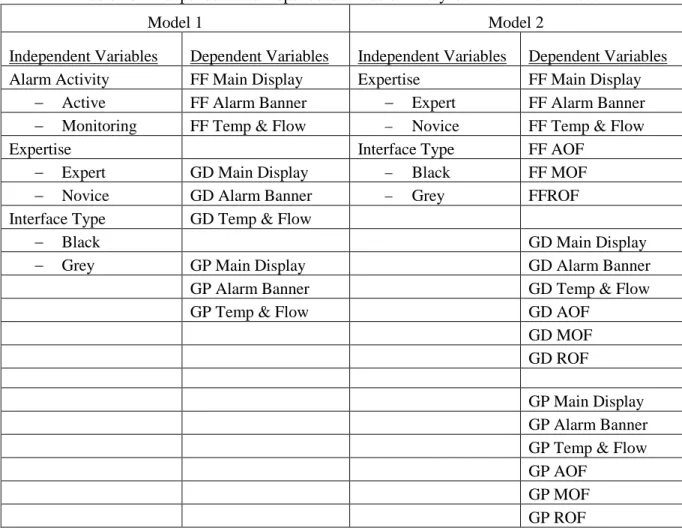
A MANOVA was conducted to test for significance due to main effects of expertise, interface, and alarm activity using IBM SPSS Statistics Version 21, a statistical analysis software. A significance level of 0.05 was used. Due to the small sample size cells had very low number of observations (i.e. expert/grey interface, n = 1) a test for interaction could not be completed; only differences due to main effects were analyzed. The criterion variables were Fixation Frequency per AOI, Gaze Duration Mean per AOI, Gaze Percentage per AOI, speed and accuracy. The criterion variables were assessed for the first fifteen minutes of the hard scenario between experts and novices, black and grey interfaces, and active and inactive periods.
Due to the nature of the alarm activity variable, two models were used for data analysis. Main Display, Alarm Banner, and Temp & Flow AOI’s were visible for the black and grey interfaces, for both expert and novice operators, and during both active and monitoring periods. AOF, MOF and ROF were only visible during active alarm periods for all participants. This means that there is no participant data during monitoring periods for these three AOI’s. Since it was intended to investigate the eye behavior of experts and novices while looking at the faceplate two models were used to analyze data separately. Each model is described in Table 10.
Fixation Frequency, Gaze Duration Mean, and Gaze Percentage were tested for normality (Shapiro-Wilk’s statistic, α = .05) and homogeneity of variance (Levene’s Statistic, α = .05). There were several variables that did not meet the normality assumption. Since MANOVA is typically robust to non- normality only criterion variables that were significant for 2 or more independent variables were