POUR L'OBTENTION DU GRADE DE DOCTEUR ÈS SCIENCES
acceptée sur proposition du jury: Prof. P. Fua, président du jury
Prof. P. Dillenbourg, Dr P. Jermann, directeurs de thèse Dr D. Gergle, rapporteur
Prof. T. van Gog, rapporteuse Prof. A. Billard, rapporteuse
Gaze Analysis methods for Learning Analytics
THÈSE N
O6696 (2015)
ÉCOLE POLYTECHNIQUE FÉDÉRALE DE LAUSANNE
PRÉSENTÉE LE 6 NOVEMBRE 2015À LA FACULTÉ INFORMATIQUE ET COMMUNICATIONS LABORATOIRE D'ERGONOMIE ÉDUCATIVE
PROGRAMME DOCTORAL EN INFORMATIQUE ET COMMUNICATIONS
Suisse PAR
Not everything that can be counted counts, and not everything that counts can be counted
Acknowledgements
This dissertation is a result of the inspirations, efforts, and contributions of many people, who I have worked with and to whom I owe my deepest gratitude. First of all, I would like to thank my thesis advisors, Prof. Pierre Dillenbourg and Dr. Patrick Jermann. My thesis owes its existence to Pierre and Patrick. They both portray the definition of a teacher by Albert
Einstein-“It is the supreme art of the teacher to awaken joy in creative expression and knowledge”. Their continuous guidance and encouragement kept me motivated to work hard everyday for the last four years. In our meetings, I always felt“The older I got, the smarter my teachers became”. -Ally Carter,Out of Sight, Out of Time. Their constructive critique helped me expanding my knowledge and limits. Without their scientific advice and stimulating ideas this research work would have never reached this state of maturity.
I would like to extend my gratitude to the members of my review committee: Prof. Darre Gergle, Prof. Tamara van Gog, and Prof. Aude Billard. I owe them a heartfelt appreciation for their constructive remarks on my dissertation. Their insightful comments helped me a lot to improve my thesis.
During different experiments, there were many people helping me understand, design, and conduct the experiments. I would like to thank Marc-Antoine Nüssli for carrying out the pair programming experiment and helping me understand various technical details about the experiment during my early days in CRAFT. I am grateful to Daniela Caballero Díaz and Himanshu Verma for their support in carrying out the Dual eye-tracking experiment with MOOCs. Without their support I would not have been able to complete the experiment in the given time limit. I also found encouragement from collaborating with Prof. Jérôme Chenal, who let me experiment with his MOOC. He was helpful and gave me useful ideas during the various parts of the experiment. He was also patient enough to use the eye-tracking glasses for multiple testing sessions. Without his help the experiment with displaying teacher’s gaze on a MOOC would not have been realised.
As James Baldwin said inGiovanni’s Room-“Perhaps home is not a place but simply an ir-revocable condition”. I was lucky enough to find friends that made James Baldwin true for my PhD life. Life would have been very difficult in Lausanne had’t I met people to have beer with. These were the people with whom I had uncountable beer talks, numerous coffee room discussions, many ping-pong sessions, and nice dinners- everything a person can find
Acknowledgements
in a “irrevocable condition”. Sharing the workspace with these people was actually fun for me. I heartily appreciate Himanshu Verma, Hamed Alavi, Quentin Bonnard, Andrea Mazzei, Sébastien Cuendet, Frédéric Kaplan, Son Do Lenh, Tabea Koll, Sophia Schwär, Julia Fink, Nan Li, Olivier Guédat, Mirko Raca, Daniela Caballero Díaz, Afroditi Skevi, Lorenzo Lucignano, Sévéin Lemaignan, Engin Bumbacher, Nikolaos Maris, Valerie Bauwens, Luis Pablo Prieto Santos, Łukasz Kidzinski, Mina Shirvani, Ayberk Ozgur, Ashish Ranjan Jha, Lukas Hostettler for their friendship from the beginning of my work at CRAFT and later at CHILI.
Next, I would like express my gratitude to the people who made my life in Lausanne even more worth to leave India and come here. I would like to thank Jessica Delher and Guillaume Zufferey, and Jo’an and Guillaume Bardy, Farzaneh Bahrami, Huong-Ly Mai, Lorin Cuendet, Sonja Raca, María Jesús Rodríguez-Triana, Cristián Mansilla for having nice evenings over beer, food, crazy discussions and dance. I would also like to thank Loreline and Benno Zufferey, Miriam Cuendet, Léanne Bardy, Moud and Zoey Lemaignan, Dimitrije Raca, my tiny friends, who always made me happy with their cute smiles.
Himanshu Verma, I am thankful to him for helping me settle down in Lausanne during my early days, for telling me how to deal within the Swiss offices, banks, post-offices and EPFL HR office; and also for being an awesome flatmate, and for constantly reminding me to keep my room clean.
I am also indebted to all the “anonymous” participants of the studies, for their sincere, preten-sionless, and genuine participation; even though I was forcing them to sit straight with their chins held up by an uncomfortable ophthalmologic rest. I would also like to thank National Science Foundation (NSF) for their support during my thesis.
This acknowledgement can never be complete without mentioning the “real boss” of the team: Florence Colomb. I would like to thank her for efficiently and effectively taking care of every administrative processes, sharing my frustration over visa issues, and taking care of my different names in different offices due to the absence of my surname.
I could never express my gratitude for my parents, Geeta Sharma and Hridai Narayan Sharma, for their love, care, and support. They are and will always be a motivating factor for me to be able to make them proud. I hope this thesis will add a bit to that goal. Enfin, I would like to thank the love of my life, Nisha. She was always there for me. I really cannot thank her enough for coping up with my crazy work schedule, completely changing her life for being close to me, her unfailing love, and unconditional support throughout this adventure. I dedicate my thesis to Nisha.
Lausanne, 13 October 2015 Kshitij Sharma.
Abstract
Eye-tracking had been shown to be predictive of expertise, task-based success, task-difficulty, and the strategies involved in problem solving, both in the individual and collaborative settings. In learning analytics, eye-tracking could be used as a powerful tool, not only to differentiate between the levels of expertise and task-outcome, but also to give constructive feedback to the users. In this dissertation, we show how eye-tracking could prove to be useful to understand the cognitive processes underlying dyadic interaction; in two contexts: pair program comprehension and learning with a Massive Open Online Course (MOOC). The first context is a typical collaborative work scenario, while the second is a special case of dyadic interaction namely the teacher-student pair.
We also demonstrate, using one example experiment, how the findings about the relation between the learning outcome in MOOCs and the students’ gaze patterns can be leveraged to design a feedback tool to improve the students’ learning outcome and their attention levels while learning through a MOOC video. We also show that the gaze can also be used as a cue to resolve the teachers’ verbal references in a MOOC video; and this way we can improve the learning experiences of the MOOC students.
This thesis is comprised of five studies. The first study, contextualised within a collaborative setting, where the collaborating partners tried to understand the given program. In this study, we examine the relationship among the gaze patterns of the partners, their dialogues and the levels of understanding that the pair attained at the end of the task.
The next four studies are contextualised within the MOOC environment. The first MOOC study explores the relationship between the students’ performance and their attention level. The second MOOC study, which is a dual eye-tracking study, examines the relation between the individual and collaborative gaze patterns and their relation with the learning outcome. This study also explores the idea of activating students’ knowledge, prior to receiving any learning material, and the effect of different ways to activate the students’ knowledge on their gaze patterns and their learning outcomes.
The third MOOC study, during which we designed a feedback tool based on the results of the first two MOOC studies, demonstrates that the variables we proposed to measure the students’ attention, could be leveraged upon to provide feedback about their gaze patterns. We also show that using this feedback tool improves the students’ learning outcome and their attention levels.
The fourth and final MOOC study shows that augmenting a MOOC video with the teacher’s gaze information helps improving the learning experiences of the students. When the teacher’s
Acknowledgements
gaze is displayed the perceived difficulty of the content decreases significantly as compared to the moments when there is no gaze augmentation.
In a nutshell, through this dissertation, we show that the gaze can be used to understand, support and improve the dyadic interaction, in order to increase the chances of achieving a higher level of task-based success.
Key words: Eye-tracking, Dual eye-tracking, Massive Open Online Courses (MOOCs), Learning analytics, Program comprehension, Pair programming, Collaborative problem solving.
Résumé
L’oculométrie est un moyen de prédiction de l’expertise, et de la performance de résolution de tâches. Les traces occulaires reflètent également la difficulté de la tâche et les stratégies impliquées dans la résolution de problèmes, aussi bien en mode individuel qu’en mode colla-boratif. En analyse de l’apprentissage, L’oculométrie peut être utilisée comme un outil pour différencier les niveaux d’expertise et de résultats ainsi que pour offrir un feedback constructif aux utilisateurs. Dans cette thèse, nous montrons comment L’oculométrie contribue à la compréhension des processus cognitifs sous-jacents à l’interaction en binôme dans deux contextes : la compréhension d’un programme informatique à deux et l’apprentissage avec un MOOC (Massive Open Online Course ou cours en ligne ouvert à tous). Le premier contexte est un scénario collaboratif classique alors que le second est un cas spécial d’interaction en binôme, soit le binôme enseignant – étudiant.
Nous allons également démontrer par une expérience, comment utiliser la corrélation entre le résultat de l’apprentissage par MOOC et les traces occulaires des étudiants pour créer un outil de feedback qui permet d’améliorer leurs résultats d’apprentissage. L’outil que nous proposons fonctionne en orientant le niveau d’attention des étudiants lors du visionnage de vidéos d’un MOOC. Nous allons aussi montrer que le regard peut être utilisé comme indicateur de références verbales par l’enseignant dans les vidéos MOOC, et de ce fait, nous permettre d’améliorer le processus d’apprentissage par MOOC des étudiants.
Cette thèse comprend cinq études. La première étude se passe dans un contexte collaboratif où les partenaires doivent comprendre un programme informatique. Dans cette étude, nous examinons la corrélation entre les traces occulaires des partenaires, leur dialogue et le niveau de compréhension atteint à la fin de la tâche.
Les quatre études suivantes ont été faites dans le contexte de l’apprentissage avec les MOOCs. La première étude MOOC explore la corrélation entre la performance des étudiants et leur niveau d’attention. La seconde étude, faite avec deux eye-trackers, examine les traces du regard en individuel et en collaboration de même que leurs corrélations avec les résultats de l’apprentissage. Cette étude explore également l’idée d’activer la connaissance des étudiants, avant qu’ils ne reçoivent du matériel éducatif, et l’effet des différentes méthodes d’activation de cette connaissance sur les traces du regard des étudiants et leurs résultats d’apprentissage. La troisième étude, durant laquelle nous avons créé un outil de feedback basé sur les deux premières expériences utilisant des MOOCs, démontre que les variables que nous avons pro-posé pour mesurer l’attention des étudiants peuvent être utilisées pour fournir un feedback sur leurs traces occulaires. Nous montrons également qu’utiliser cet outil de feedback permet
Acknowledgements
d’améliorer les résultats d’apprentissage des étudiants et leurs niveaux d’attention. La qua-trième et dernière étude MOOC montre que l’ajout d’informations concernant le regard de l’enseignant aide les étudiants dans leur processus d’apprentissage. Lorsque l’endroit où se porte le regard de l’enseignant est affiché, la difficulté perçue du contenu diminue de manière significative par rapport aux moments où le regard n’est pas indiqué.
En résumé, par cette thèse, nous démontrons que le regard peut être utilisé pour comprendre, offrir du support et améliorer les interactions en binôme afin d’augmenter la possibilité d’atteindre un niveau de succès plus important dans la résolution de tâches.
Mots clefs : L’oculométrie, oculométrie double, Cours en ligne ouvert à tous, Analyse de l’apprentissage, la compréhension du programme, la programmation en paire, Co-résolution de problèm.
Contents
Acknowledgements i
Abstract (English/Français/Deutsch) iii
List of figures xi
List of tables xv
1 Introduction 1
1.1 Motivation . . . 1
1.2 Research context . . . 2
1.3 Global research questions . . . 3
1.4 Thesis Roadmap . . . 3
2 Related Work 5 2.1 Introduction . . . 5
2.2 Gaze as an analytics tool . . . 6
2.2.1 Gaze and problem solving . . . 6
2.2.2 Gaze in communication and referencing . . . 14
2.2.3 Gaze and program understanding . . . 17
2.2.4 Gaze and online/multimedia learning . . . 17
2.3 Dual eye-tracking and collaborative problem solving . . . 18
2.4 Different levels of analytics using gaze . . . 19
2.4.1 Social granularity . . . 20
2.4.2 Temporal granularity . . . 20
2.5 Discussion . . . 21
3 Pair Program Comprehension 23 3.1 Introduction . . . 23
3.2 Context . . . 24
3.2.1 Pair programming . . . 24
3.2.2 Program comprehension as a problem solving task . . . 24
3.2.3 Program comprehension strategies . . . 25
3.2.4 Elicitations and program understanding . . . 25
Contents
3.3 Problématique . . . 26
3.4 Experiment . . . 27
3.4.1 Subjects . . . 28
3.4.2 Procedure . . . 28
3.4.3 Apparatus and material . . . 28
3.5 Variables . . . 29 3.5.1 Level of Understanding . . . 29 3.5.2 Semantic tokens . . . 29 3.5.3 Gaze transitions . . . 30 3.6 Interaction Episodes . . . 32 3.6.1 Fixations Episodes . . . 32 3.6.2 Focus-similarity episodes . . . 36 3.6.3 Dialogues . . . 37 3.7 Results . . . 39 3.7.1 Temporal interaction . . . 39 3.7.2 Gaze-dialogue coupling . . . 44
3.7.3 Combining gaze, dialogues and understanding . . . 45
3.8 Discussion . . . 50
4 How Students Learn with MOOCs: An Exploratory Study 55 4.1 Introduction . . . 55
4.2 Context: Massive Open Online Courses . . . 55
4.3 Problématique . . . 56
4.4 Experiment . . . 57
4.4.1 Participants and procedures . . . 57
4.4.2 Participant categorisation . . . 57 4.5 Process Variables . . . 58 4.5.1 Content coverage . . . 58 4.5.2 With-me-ness . . . 61 4.6 Results . . . 62 4.6.1 General statistics . . . 62 4.6.2 Content coverage . . . 62 4.6.3 With-me-ness . . . 65 4.7 Discussion . . . 65
5 Dual Eye-tracking Study in MOOC Context 71 5.1 Introduction . . . 71
5.2 Activating student knowledge via priming . . . 72
5.3 Problématique . . . 72
5.4 Experiment . . . 73
5.4.1 Participants and procedure . . . 73
5.4.2 Independent variable: Priming . . . 74
5.4.3 Independent variable: Pair configuration . . . 75 viii
Contents
5.4.4 Dependent variable: Learning gain . . . 75
5.4.5 Process variables . . . 75
5.5 Results . . . 77
5.5.1 Effect of priming . . . 78
5.5.2 Individual with-me-ness, collaborative gaze similarity and learning gains 80 5.6 Discussion . . . 82
6 Gaze Aware Feedback: Effect on Gaze and Learning 85 6.1 Introduction . . . 85
6.2 Context . . . 85
6.3 Problématique . . . 86
6.4 Experiment . . . 86
6.4.1 Participants and procedure . . . 86
6.4.2 Gaze aware feedback . . . 87
6.4.3 Dependent variables . . . 88
6.5 Results . . . 88
6.6 Discussion . . . 88
7 Effect of Displaying the Teacher’s Gaze on Video Navigation Patterns 91 7.1 Introduction . . . 91
7.2 Context . . . 91
7.2.1 Gaze contingency and reference disambiguation . . . 91
7.2.2 Online video navigation profiles and the perceived difficulty of content . 92 7.3 Problématique . . . 92
7.3.1 Research Questions . . . 93
7.4 Experiment Setup . . . 94
7.4.1 Re-localisation of teacher’s gaze . . . 94
7.4.2 Ambiguity in stimulus and teacher’s gaze . . . 95
7.4.3 Measures . . . 97
7.5 Results . . . 97
7.5.1 Comparing user behaviour across different weeks . . . 98
7.5.2 Comparing user behaviour within the video . . . 99
7.6 Discussion . . . 99
8 General Discussions 103 8.1 Scaling up the results . . . 103
8.2 Roadmap of results . . . 103
8.3 Contributions . . . 105
8.3.1 Eye-tracking and learning analytics . . . 105
8.3.2 Interaction styles . . . 106
8.3.3 Collaborative problem solving . . . 106
8.4 Design implications from the studies . . . 107
Contents
8.6 Final words . . . 109
A Program used in the pair program comprehension task 111 B Pretest used for the exploratory eye-tracking study for MOOCs 115 C Posttest used for the exploratory eye-tracking study for MOOCs 121 D Textual pretest used in the dual eye-tracking study for MOOCs 131 E Schema based pretest used in the dual eye-tracking study for MOOCs 133 F Posttest used in the dual eye-tracking study for MOOCs 139
Bibliography 148
Curriculum Vitae 149
List of Figures
1.1 The placement of this dissertation work within the relevant research areas. . . . 2 2.1 (a) Examples of matchstick arithmetic problems used by Knoblich et al. [2001].
The problem “A” is an easy problem, and problems “B” and “C” are the difficult ones. (b) A typical example stimulus for the “Duncker’s radiation problem”. . . . 7 2.2 Car Park problem used by Jones [2003]. The object car is coloured in black.. . . . 7 2.3 Typical example of tumour task used by Grant and Spivey [2003] and Thomas
and Lleras [2007]. In the case of Thomas and Lleras [2007], the authors forced the participants to look in certain way (the numbers represent the order of objects to be looked at); (a) shows the embodied-solution group; (b) shows the areas-of-interest group; (c) shows the repeated-skin-crossing group; and (d) shows the tumour-fixation group. . . . 8 2.4 Different rotation angles used by Just and Carpenter [1976]. . . . 9 2.5 Tasks used by [Kaller et al., 2009]. (a) Type 1: one-move problem. (b) Type 2:
two-move problem. (c) Type 2: three-move problem, without intermediate step. (d) Type 4: three-move problem, with intermediate step.. . . 11 2.6 Arithmetic word problems used by Hegarty et al. [1992]. There were four versions
with consistent and inconsistent language and with relational words "more" and "less". . . . 12 2.7 Chess positions used by Reingold et al. [2001].. . . 13 2.8 Stimulus image used by Allopenna et al. [1998]. In this particular image the
the beaker is the referent, beetle is the cohort, speaker is speaker and carriage is unrelated. . . . 15 3.1 A typical Diagram to show the relation between the gaze, the dialogues, and the
level of understanding of the pair.. . . 23 3.2 A typical Diagram to show the conceptual analogy between the fixations and the
segments, and to show the analogy between different levels of raw gaze aggregation and the behaviour dimensions . . . 27 3.3 A typical example of semantic elements of a program. The identifiers are the
names of the variables and the methods. The structural elements are the punc-tuation elements and the brackets. The expressions contain the relation among the identifiers. . . 30
List of Figures
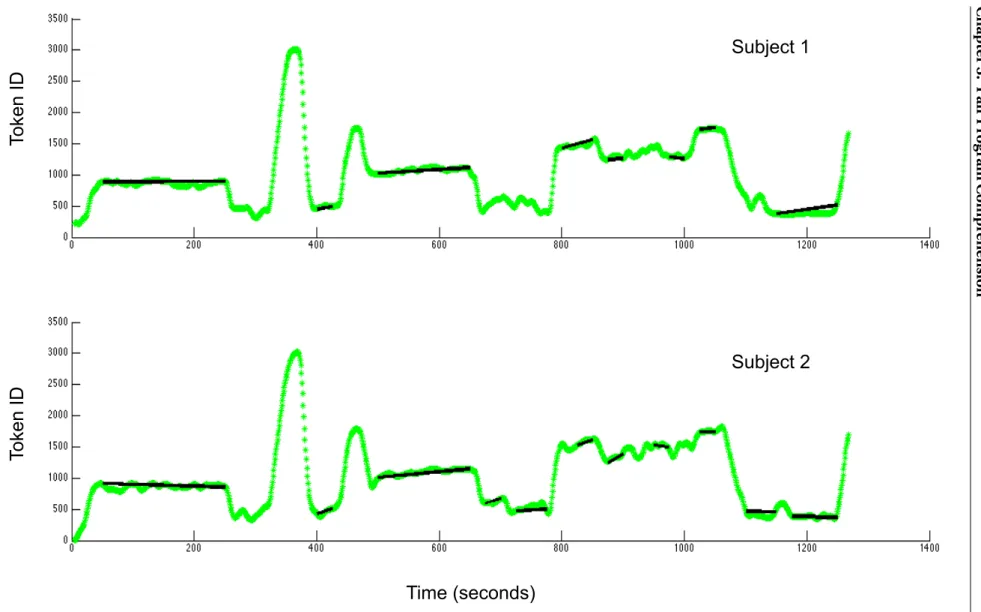
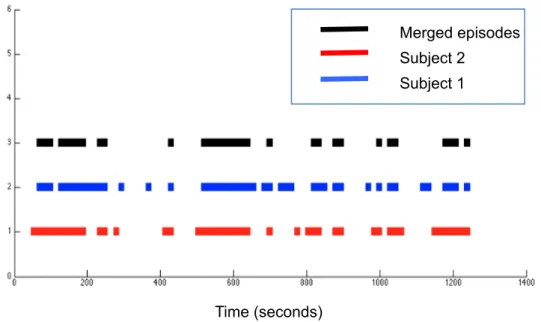
3.4 Fixation episodes computed for individual participants of a pair in the program understanding task. The x axis represents time (sampling rate 50Hz). The y axis represents the average token ID that was gazed at. A horizontal "plateau" (black horizontal lines) means that the subject has been looking at a stable range of tokens over a relatively longer period of time. . . . 34 3.5 Fixation episodes of both the participants aligned in time and the episodes of
inter-action; time on X-axis; Y-axis: 1 for first participant, 2 for the second participant, 3 for the episodes of interaction . . . 35 3.6 A typical example of computing gaze entropy for an individual. The letters are
symbolic semantic tokens. The numbers inside the boxes represent the proportion of the time window spent on the respective semantic tokens. We show the two extreme cases with highest an lowest possible values of entropy. . . . 36 3.7 A typical example of computing gaze similarity for a pair. The letters are symbolic
semantic tokens. The numbers inside the boxes represent the proportion of the time window spent on the respective semantic tokens. We show the two extreme cases with highest an lowest possible values of gaze similarity. . . . 37 3.8 Mean plots and confidence intervals for different transitions for the whole
inter-action. . . . 41 3.9 Mean plots and confidence intervals for data flow for the interaction episodes and
levels of the understanding. . . . 42 3.10Mean plots and confidence intervals for Systematic reading of program for the
interaction episodes and the levels of understanding. . . . 43 3.11Contribution to the triumvirate relationship between the gaze, the dialogues and
the level of understanding (figure 3.1) from analysing the temporal interaction. . 43 3.12Contribution to the triumvirate relationship between the gaze, the dialogues and
the level of understanding (figure 3.1) from the gaze-dialogue coupling. . . . 46 3.13Interaction of the pair divided into different levels of time granularities. . . . 46 3.14Mean plots and confidence intervals for not focused together episodes for different
levels of understanding. . . . 47 3.15Mean plots and confidence intervals for focused together episodes for different
levels of understanding. . . . 47 3.16Interaction effect on DESC (description) dialogues in focused together and not
focused together episodes for different levels of understanding. . . . 48 3.17Interaction effect on MGMT (management) dialogues in focused together and not
focused together episodes for different levels of understanding. . . . 49 3.18Mean plots and confidence intervals for “expression” gaze transitions for different
dialogue episodes. . . . 50 3.19Mean plots and confidence intervals for “read” gaze transitions for different
dia-logue episodes. . . . 50 3.20Contribution to the triumvirate relationship between the gaze, the dialogues and
the level of understanding (figure 3.1) after combining all the three variables. . . 51 xii
List of Figures
3.21Contribution to the triumvirate relationship between the gaze, the dialogues and the level of understanding (figure 3.1) after combining all the three variables. . . 51 4.1 Method to get the attention points and the area of the attention points. . . . 59 4.2 A typical example of a scanpath (left); and the computation of different variables
(right). . . . 60 4.3 Example of a scan-path and Areas of Interest (AOI) definition. The rectangles
show the AOIs defined for the displayed slide in the MOOC video and the red curve shows the visual path for 2.5 seconds. . . . 60 4.4 Temporal description of the two levels of with-me-ness and the sub-levels of
perceptual with-me-ness. . . . 61 4.5 Mean plots and confidence intervals for attention point variables, scanpath
vari-ables and reading time across the different levels of learning strategy and perfor-mance. . . . 64 4.6 Different with-me-ness components and posttest scores.. . . 66 5.1 Schematic representation of the second hypothesis for the experiment. We
hy-pothesise that the students would have higher learning gain provided, they follow the teacher in the video and they collaborate well with their partners during the concept map phase. . . . 73 5.2 Schematic representation of the different phases of the experiment. . . . 74 5.3 Example question from the schema version of the pretest. The corresponding
textual question was “State whether the following statement is true or false: The main cause for the creation of resting membrane potential is more positive ions move inside the membrane than outside of the membrane.” . . . 75 5.4 Example of areas of interest used in the experimental task. Objects 1 and 2 are
textual elements, while object 3 and 4 are schema elements. The main schema in the middle of this snapshot was also divided into different schema elements like “ions”, “membrane” and “channels”.. . . 76 5.5 . . . 79 5.6 . . . 81 6.1 Example of the feedback used in the experiment. The circumscribing red rectangle
were shown if the me-ness of the participant went below the baseline with-me-ness at any given instant during the video. For this particular frame, Teacher: “so you have one force, the concentration driving K out; and another force, the
membrane potential, that gets created by its absence that?s gonna drive it back in.” 87 6.2 . . . 89 7.1 Setup: The teacher is equipped with the SMI mobile eye-tracking glasses (left) and
the MOOC recording studio (right) with the top camera on the ceiling and the tablet used by the teacher. The fiducial markers (top-right) are glued to the tablet to make the re-localisation of teacher’s gaze on the actual content easy. . . . 93
List of Figures
7.2 Process for the re-localisation of the teacher’s gaze on the final video output. . . . 95 7.3 Example of a high ambiguity image from the experimental video. The image is an
aerial view and the teacher is explaining the landscape captured. We rate these type of images because high ambiguity images as disambiguating a reference like “’the school” is difficult without a visual cue. . . . 96 7.4 Example of a low ambiguity image from the experimental video . The image is
typical street view and the teacher is explaining the landscape captured. We rate these type of images as low ambiguity images because disambiguating a reference like “’the tree” is easy without a visual cue.. . . 96 7.5 (a) Proportion of replayed video length, (b) Average number of pauses, (c) Ratio
of pause time and video length, and (d) Average number of seek back events; compared across weeks 10, 11 and 12. . . 98 7.6 Proportions of different types of events compared within the experiment video
across different gaze episodes. . . . 100 7.7 Proportions of different types of events compared within the experiment video
across different ambiguity episodes. . . . 100 8.1 Temporal evolution of perceptual (green curve) and conceptual (blue curve) levels
of with-me-ness and the time spent (red curve) on each 10 second episode of the video. The grey area shows the confidence intervals for 98 students. . . . 104 8.2 The cybernetic control (learning analytics) loop using with-me-ness. . . . 106
List of Tables
2.1 Different factors in problem solving and their gaze correlates. Rows marked with “*” represent the studies where an intervention/feedback was introduced, that
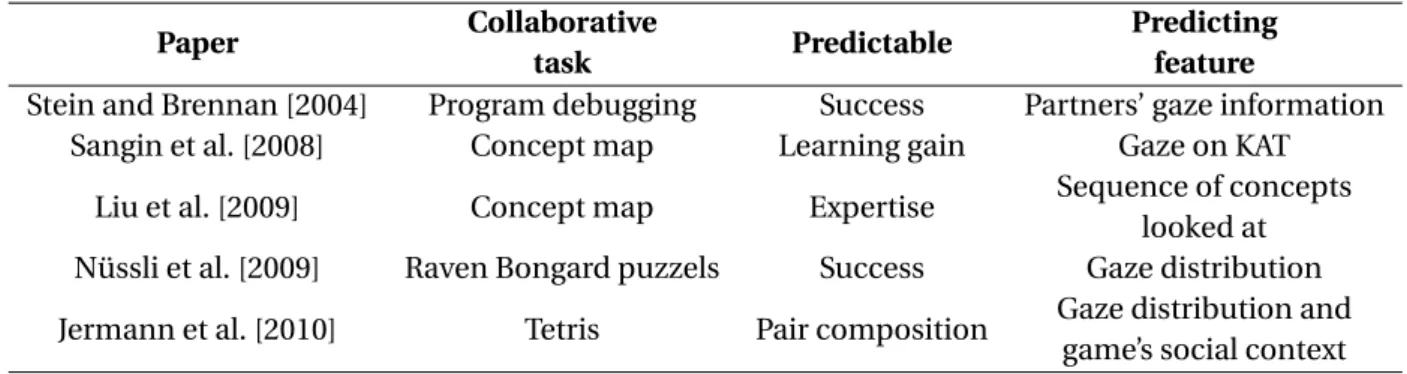
resulted in a significant improvement in task-based success. . . . 14 2.2 Gaze as a predicting variable for success and expertise in collaborative tasks . . . 19 3.1 Categorisation of different transitions among different semantic classes in the
program into different types of flows in the program. (I=Identifier, S=Structural, E=Expression).− >denotes the transition.. . . 31 3.2 Examples of program description dialogues (Excerpts from the audio transcriptions). 39 3.3 Hierarchical linear model fitting for Contingency Table with dimensions
Transi-tion (T), Pair Type (P) and Level of Understanding (UND), for the combined gaze of all the pairs . . . 40 3.4 Mean and standard deviations for the data flow and the linear reading across the
two different levels of understanding. . . . 42 3.5 Proportions of data flow and linear reading transitions (mean and standard
deviation) by type of episode and level of understanding. . . . 43 3.6 Hierarchical linear model fitting for Contingency Table with factors semantic
token (C), abstraction in description (A) and scope of description (S), for the combined dialogues of all the pairs. . . . 44 3.7 Semantic tokens looked at for different levels of abstraction. Numbers in
paren-theses are standardised chi square residuals. Residuals (absolute values) bigger than 1.96 are considered statistically significant. . . . 45 3.8 Scope of description vs. Abstraction in description. Numbers in parentheses are
standardised chi square residuals. Residuals (absolute values) bigger than 1.96 are considered statistically significant. . . . 45 3.9 Means and standard deviations for different gaze episodes across two levels of
understanding. . . . 47 3.10Mixed effect model for dialogue episodes with factors level of understanding
(UND) and focus-similarity episodes (EPGAZE) (NS= Not Significant). . . . 48 3.11Dialogue snippets for pairs having different levels of understanding during
differ-ent gaze episodes to show the differences between verbal communications.. . . . 49 3.12Mean and standard deviations for the different gaze transitions across the different
List of Tables
4.1 Means and standard deviations for the different variables used in section 4.6.2 for learning strategy and performance categories. . . . 63 4.2 Comparison of different variables in terms of automatisation and pre-processing
required. . . . 69 6.1 Mean and standard deviations for learning gains across conditions. . . . 88 6.2 Linear mixed effect model with time and participant ID as fixed and random
effects respectively.. . . 90 7.1 Lengths (in minutes, chi-square residuals in parentheses) of the different episodes
within the experimental video. Residuals (absolute values) more than 1.96 are considered to be significant. . . . 99 7.2 Numbers (chi-square residuals in parentheses) of different types of events, for the
different episodes within the experimental video. Residuals (absolute values) more than 1.96 are considered to be significant. . . . 101
1
Introduction
“The eyes are the mirror of the soul and reflect everything that seems to be hidden.” - Paulo Coelho
1.1 Motivation
What happens during collaboration? When two persons collaborate, they try to build up a shared understanding or to learn a new topic from a particular domain. Very often, the underlying cognitive processes are hidden from the observer. In order to support collaboration, it is important to understand those underlying cognitive processes. The theme of this thesis is to approach this problem using a learning analytic approach.
Our learning analytics view of supporting collaborative work and collaborative learning is like a cybernetic control [Jermann, 2004]. In a cybernetic control, the current value of the controlled environment is compared against a reference, and if need be, some adjustments are made. In terms of collaborative work and learning, we first differentiate the behavioural patterns captured from a collaborative environment between successful and unsuccessful collaboration. Once we know the different behavioural patterns corresponding to a successful collaboration, we might be able to provide constructive suggestions in other collaborative settings. This assumption requires careful experimentation, where we try to understand the cognitive processes underlying collaboration. The major focus of these experiments is to collect behavioural data that can help us build this understanding.
In this thesis, we captured the behaviours of the collaborating partners using their gaze data and the dialogues. In the present decade, the costs and sizes of eye-trackers have decreased down to a level that the experiments are not limited to the laboratory settings. With the current advent in technology, it has been possible to collect high quality gaze data with high accuracy and precision. This data enables us to model the cognition underlying the collaborative work and learning and later to develop feedback systems that can support collaborative activities.
Chapter 1. Introduction
1.2 Research context
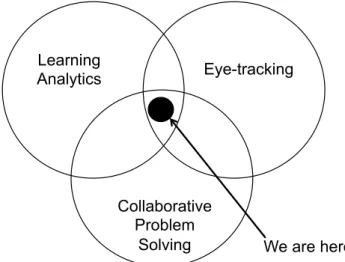
This thesis proposes a learning analytic approach to understand the collaborative processes. The data collection is a major part of this approach. We will use gaze data as the main behavioural measure in our experiments. As shown in figure 1.1 our work lies at the confluents of several domains: We are here Eye-tracking Learning Analytics Collaborative Problem Solving
Figure 1.1 –The placement of this dissertation work within the relevant research areas.
1) Collaborative problem solving, our main problem statement comes from this domain. We study dyadic interaction. The goal of the dyadic interaction, in our case, as will be addressed in this thesis, is to build up a shared understanding. This dyadic interaction can either be with a collaborating partner (pair programming); or it can be a teacher-student pair in a Massive open online course (MOOCs), with the special case of the teacher always being the leader in the interaction.
2) Learning analytics, provides the approach to answer the questions raised from the two contexts: pair programming (collaborative problem solving) and MOOCs (teaching). The prime motive is to approach the dyadic interaction processes as a environment controlled via a cybernetic control. The first stage is to understand the processes and the second stage is to develop the feedback system based upon our understanding.
3) Eye-tracking, provides us the methodology to understand and support dyadic inter-action. We will use the gaze data to explain the differences among different levels of success (level of understanding in pair program comprehension and learning out-come in MOOCs) in such interactions. Later, we will develop the gaze-aware feedback tools based on the different gaze patterns corresponding to the different collaborative outcomes.
1.3. Global research questions
1.3 Global research questions
Through this dissertation, we try to answer the following research questions:
How are gaze patterns, dialogues and shared understanding related to each other in a col-laborative setting?We hypothesise a complex (triangular) relationship between these three constructs. The intertwining of gaze patterns and dialogues leads to a given level of shared understanding; and we are interested in finding the gaze patterns and dialogues that can differentiate among different levels of collaborative success.
How can we measure the attention of a student in a Massive Open Online Course (MOOC) lecture specially considering the teacher-student dyad as a social unit of interaction? More-over, how are these attention measures related to the student performance? Considering the teacher-student dyad as our social unit of interaction, lets us control a post-hoc variable while analysing the collaboration. This variable is the different roles (leader, follower) acquired by the different participants in pairs. The goal of collaboration (mainly for the student) is to build up a shared understanding of the topic at hand. By capturing the attention automatically, we might be able to develop a gaze based “cybernetic control system” as described in Section 1.1.
How can we improve the learning experience in terms of attention in MOOC lectures? Pro-vided, we are able to find differences in gaze patterns of successful and unsuccessful students, the last question we will try to answer is “how can we improve the learning experience in MOOC lectures”. One way to provide a high quality learning experience is to provide the feedback based on the answer of the previous question. In other words, we want to evaluate the effectiveness of the attention measure(s) we will develop in this thesis.
1.4 Thesis Roadmap
This dissertation is organised as follows:
In the next chapter, we will provide a brief overview of the use of eye-tracking to distinguish different levels of task based performance, task difficulty, problem solving strategies, and expertise; both in the individual and collaborative settings. Moreover, we will also give a brief overview of previous work done to understand cognitive mechanisms underlying collaborative problem solving and learning.
Chapter 3 will present a dual eye-tracking study to find the relationship between gaze pat-terns, dialogues and the level of understanding. The study is contextualised within a pair programming setting, where pairs of programmers collaborate to understand a given program. In chapter 4, we will present the design and results from an exploratory eye-tracking study in the MOOC context. The data collected from this study was used to develop measures to capture the students’ attention in a MOOC and to find the relation between these measures
Chapter 1. Introduction
and the students’ performance.
Chapter 5 will present the design and results from the second (dual) eye-tracking study in the MOOC context. We built upon the results from the study in chapter 4 and also introduced some ecologically valid changes in the study presented in chapter 4.
In chapter 6, we will present the design of a gaze-aware feedback system to support MOOC students while watching the video lectures. We will also report on a study, where we compared this gaze-aware feedback system against the absence of any feedback.
Chapter 7 will present a study where we recorded the eye-tracking data from a MOOC teacher, while he was recording his lecture. We describe the effect of showing the teacher’s gaze on the MOOC lecture on the navigation patterns of students.
Finally we will conclude with a summary and general discussion about the contributions of this work. This chapter will also explain the limitations and the implication of our work for future research.
2
Related Work
“Learning analytics is the use of intelligent data, learner-produced data, and analysis models to discover information and social connections, and to predict and advise on learning.”
- George Siemensa aSource: ”http://www.elearnspace.org/blog/2010/08/25/what-are-learning-analytics/”
2.1 Introduction
Eye-tracking provides researchers with an unprecedented access to the users’ attention. The eye-tracking data is rich in terms of the temporal resolution. With the advent in eye-tracking technology, the apparatus has become compact and easy to use without sacrificing much of the ecological validity during the controlled experiments. Previous research had shown that eye-tracking can be useful to unveil the cognition that underlies the interaction between collaborating partners, the different strategies that experts chose to solve problems at hand. Eye-tracking was also shown to be useful to differentiate the strategies which led to success from those which could not. Gaze has also shown to be related to dialogues among collaborat-ing partners.
In this chapter, we will present examples from the previous research showing the usefulness of eye-tracking in learning analytics. We start with reviewing research carried out using gaze as an analytics tool, where we show how different studies used eye-tracking data:1)to find the key moments in an interaction; and2)to find the expert strategies for problem solving. We will then review two exemplar fields where eye-tracking had been used as an analytic tool: program comprehension and online learning. Then we will present examples of studies using eye-tracking data to quantify cognition at different temporal granularities.
We will not present an exhaustive literature review on the previous research done in the field of eye-tracking. Instead, we chose studies that exemplified major topics in the eye-tracking research conducted in major problem solving fields, for example, the insight problem solving (matchstick arithmetic), games and sports (boxing and chess), and the procedural problem
Chapter 2. Related Work
solving (arithmetic word problems and program comprehension).
As we said earlier that another closely related source of data for analytics are dialogues. We will show what relations have previous studies found in gaze data and dialogues (or explicit references) during interactions and problem solving. Moreover, we review the studies carried out using dialogues as a source of analytics data to find different problem solving strategies across different expertise levels or across different performance levels.
2.2 Gaze as an analytics tool
Gaze had been found to be closely related to different strategies, expertise, task-based per-formance and dialogues. In this section, we review past research using gaze data to identify different strategies across the different expertise and performance levels. We also review the studies establishing the relation between the dialogues and the gaze.
2.2.1 Gaze and problem solving
Eye-tracking had been used in numerous studies to find the relation between task-based performance or expertise with the gaze-patterns. In this section, we report a few exemplar experiments.
Knoblich et al. [2001] used eye-tracking to study how participants solved insight problems. As an example of insight problems Knoblich et al. [2001] usedmatchstick arithmetic problems
(Figure 2.1a). In a typical matchstick arithmetic problem, the participant is asked to correct an incorrect arithmetic equation. The equation uses the Roman numerals. The participant had to move one and only one matchstick from one position to other, in order to correct the equation. In figure 2.1a, problem A was solved by changing “IV” to “VI”; problem B was solved by changing “+” to “=”; and problem C was solved by changing “IX” to “VI”. Problems B and C were more difficult than problem A, because solving problem B involved changing one of the operators and solving problem C involved changing the partial structure of a numeral. The major difficulty in the insight problems is occurrence of impasses due to two different reasons. In contrast to usual problem solving where the problems are resolved gradually, the insight problems are solved suddenly [Thevenot and Oakhill, 2008]. The two reasons for impasses are based on this fact only. 1)Usual problem solving involves minimising the distance between the problem state and the solution state. In insight problems, impasses occur when the participant finds that his/her actions do not reduce this distance [MacGregor et al., 2001]. This is also known asprogress monitoring theory; and2)impasses could also occur if the participant starts from an incorrect initial representation of the problem [Knoblich et al., 1999]. This is also known asrepresentational change theory..
Knoblich et al. [2001] measured the fixation time on different chunks (each Roman numeral) of matchsticks in each of the problems. The results showed that during an impasse for difficult 6
2.2. Gaze as an analytics tool
problems (B and C) participants were simply staring at the problem, i.e., they had fewer and longer fixations. Also in the later phases of successfully solved problems Knoblich et al. [2001] found more fixations on the result side of the equations. For example, during successful solutions to problem C, the participants looked more at the “X” part of “IX”, thus showing the more emphasis on the key part of the result side.
Problem A Problem B Problem C (a) Tumor Healthy tissue Skin Outside (b)
Figure 2.1 –(a) Examples of matchstick arithmetic problems used by Knoblich et al. [2001]. The problem “A” is an easy problem, and problems “B” and “C” are the difficult ones. (b) A typical example stimulus for the “Duncker’s radiation problem”.
Jones [2003] used another example of insight problem calledCar Parkproblem (figure 2.2) to find the relation between the problem solving processes and the gaze data. The goal of the car park problem is to manoeuvre a car out of a parking space. The parking space has other cars as well, which can be moved only in their initial orientation. The authors looked at the fixation time three moves prior to the object car move and three moves after the object car move. The fixation time on the problem was longer for the object car move, than that in the prior or succeeding moves to the object car move. Moreover, non-solvers spent significantly more time on the free area than the solvers.
(a) (b)
Chapter 2. Related Work
Grant and Spivey [2003] used another example of insight problem called theDuncker’s radia-tion problem(figure 2.1b), which is defined as follows:
“Given a human being with an inoperable stomach tumour, and lasers which destroy organic tissue at sufficient intensity, how can one cure the person with these lasers and, at the same time, avoid harming the healthy tissue that surrounds the tumour?”- Grant and Spivey [2003]. Grant and Spivey [2003] measured the fixations on the “skin”, “tumour”, “inside” and “outside” (Figure 2.1b). The results showed that there was significantly more time spent on the skin during successful solution, than that during unsuccessful solutions. This showed that the skin is a critical feature in problem solving process. This led the authors to conduct another experiment where they compared highlighting the “skin” (critical feature) versus highlighting the “tumour” (non-critical feature). The results from the second experiment showed that highlighting the critical feature led to significantly more correct solutions than the condition with highlighting the non-critical feature.
Thomas and Lleras [2007] also used the Duncker’s radiation problem to establish the relation between the problem solving processes and the gaze data. The authors manipulated the eye-movements of the participants in four different ways as shown in figure 2.3:1) embodied– solution, where participants’ saccades crossed the skin many times;2) areas-of-interest, where the participants had the same patterns as the previous group but they had shorter saccades;
3) repeated-skin-crossing, where participants crossed the skin between the same two points only; and4) tumour-fixation,where participants looked only at the tumour.
(a) (b)
(c) (d)
Figure 2.3 –Typical example of tumour task used by Grant and Spivey [2003] and Thomas and Lleras [2007]. In the case of Thomas and Lleras [2007], the authors forced the participants to look in certain way (the numbers represent the order of objects to be looked at); (a) shows the embodied-solution group; (b) shows the areas-of-interest group; (c) shows the repeated-skin-crossing group; and (d) shows the tumour-fixation group.
2.2. Gaze as an analytics tool
The results from Thomas and Lleras [2007] showed that by forcing the participants to look only in a specific way the success rate of the solution can actually be manipulated. For example the the success rate was found to be increasing in the following order:1)repeated-skin-crossing,
2)tumour-fixation,3)areas-of-interest, and4)embodied-solution. The two studies, about the Duncker’s radiation problem, showed that given the correct feedback/intervention, the task-based success could be improved.
Just and Carpenter [1976] used eye-tracking to explain different cognitive processes underlying the problem solving in amental rotation task. The participants had to perform asame-different
task for three angles of rotations (figure 2.4). For the participants, there were three main components of the task: first, to figure out what parts were to be rotated; second, how much the parts had to be rotated; and third, whether after rotation the two figures were the same or not. The authors called these three components as search, transformation and comparison, and confirmation.
0
orotation
120
orotation
180
orotation
Figure 2.4 –Different rotation angles used by Just and Carpenter [1976].
Overall results from Just and Carpenter [1976] show that there was a common pattern across the three rotation types (0, 120 and 180 degrees). The participants switched between the figures three times (left-right-left-right). The number of such switches increased with the increase in the rotation angle. Further, the authors divided the fixations into three categories:
1)fixations at the center,2)fixations at the arm with the third face of the cube visible (open), and3)fixations at the arm with the third face of the cube not visible (close). The authors
Chapter 2. Related Work
constructed the scan paths from these categorised fixations; and further categorised the scan paths to represent the three components of the problem solving process. The results showed that the time intervals for the three processes were different and they increased with the increase in the rotation angle.
Ripoll et al. [1995] used eye-tracking data to analyse the different visual search activities of the boxers across the different levels of expertise (expert, novice and intermediate) and task complexity in two different experiments. The participants had to solveFrench boxing 1situations. The opponent (virtual) was filmed and projected on the screen. The participants
had to respond using a joystick. Each participant was asked to respond to five situations: left and right attacks, left and right feints and the openings. The authors divided the fixations onto different body parts like: head, trunk, arms/fists, pelvis and legs. The results showed that the experts made significantly more fixations on head than the novices and intermediates; while they had no fixations on the lower body parts. The authors suggested that the information about the lower parts might had come from the peripheral for the experts. Moreover, the novices focused more on the arms/fists than the experts and the intermediates; while the intermediates focused more on the trunk than the novices and experts.
Abernethy and Russell [1987] used racquet sports to explore the relationship between the gaze patterns and the different levels of expertise (experts and novices). The participants were all badminton players. The stimulus for the gaze experiment was prepared in a similar manner as in Ripoll et al. [1995]. The only difference between the two experiments was that some of the frames in the stimulus used by Abernethy and Russell [1987] were occluded. The occlusions were deliberately placed either at the body of the player or at the entire frame prior/after the racquet-shuttle contact. The experimental task was to predict the landing position of the shuttle. The analysis was carried out by categorising the fixation into five categories: racquet/arm, shuttle, trunk, head, legs/feet. The results showed that the experts focused more on the racquet and arm of the opponent; while novices focused more on the head and the trunk of the opponent. These results were the opposite of the results found by Ripoll et al. [1995]; this shows the sensitivity of the gaze patterns towards the task specificities. Kaller et al. [2009] compared the gaze patterns of participants across the different task difficulty levels during a visuospatial task ofTowers of London(Figure 2.5). The order for the presentation of the start and the goal was a between subject variable used by [Kaller et al., 2009]. Half of the participant saw the problem with start on the left (as shown in the figure 2.5, SG group). The other half saw the opposite representation (figure2.5, GS group). The authors did not find any differences in terms of performance across the two experimental groups. However, the participants initially (first 144 observations per participants) looked more at the left diagram more than the right diagram irrespective of the state (start or goal) it was displaying. Considering the gaze shifts between left and right sides during initial thinking time (time between the presentation of the problem and onset of the first action), the authors found that the gaze shifts were highly influenced by the fact whether the participant first looked at the
1French boxing, also known as French kickboxing or French foot fighting, for details, see here
2.2. Gaze as an analytics tool
goal or start state. There were more gaze shifts among the states when the participants started from the goal state than those when the participants started from the start state.Moreover, there was a high amount of gaze directed towards the start state during the initial phase of the solution execution phase (when participants started moving the pegs) across both the SG and GS groups. This duration increased with the increase in task difficulty. The authors concluded that there is a strong dependency between the personal preferences and the gaze patterns; and between the task difficulty and the gaze patterns.
Start
Goal
(a)
Start
(b)
Goal
Start
Goal
(c)
Start
Goal
(d)
Figure 2.5 –Tasks used by [Kaller et al., 2009]. (a) Type 1: one-move problem. (b) Type 2: two-move problem. (c) Type 2: three-move problem, without intermediate step. (d) Type 4: three-move problem, with intermediate step.
Hegarty et al. [1992] used the gaze data to understand how students solve thearithmetic word problems. To solve the problem shown in figure 2.6, the students had to make the relation using the second sentence as “Price at ARCO=Price at Chevron+5 cents”. The authors used four versions of the same word problem using consistent and inconsistent language (using “this” instead of the shop name); and using two different relational words (“more” and “less”).
The authors give two major problems faced by the students in solving inconsistent problems:
1)using “less” as relational inverses the actual relation;2)students make mistake in assigning the noun to “this”. The authors divided the students using their accuracy (high and low-accuracy) in solving the arithmetic word problems to concentrate more on the high-accuracy students and their gaze patterns. The authors found rereading patterns, for high-accuracy students, were in a way that every rereading iteration had progressively smaller chunks of text on any given line. Moreover, for every rereading iteration, these students focused on numbers
Chapter 2. Related Work
more than the other information. Also, they reread the variable names and the relational terms in inconsistent problems than in the consistent problems.
1. At ARCO gas sells for $ 1.13 per gallon. 2. Gas at Chevron is 5 cents more per gallon than gas at ARCO.
3. If you want to buy 5 gallons of gas, 4. how much will you pay at Chevron?
1. At ARCO gas sells for $ 1.13 per gallon. 2. This is 5 cents more per gallon
than gas at Chevron.
3. If you want to buy 5 gallons of gas, 4. how much will you pay at Chevron?
1. At ARCO gas sells for $ 1.13 per gallon. 2. Gas at Chevron is 5 cents less per gallon than gas at ARCO.
3. If you want to buy 5 gallons of gas, 4. how much will you pay at Chevron?
1. At ARCO gas sells for $ 1.13 per gallon. 2. This is 5 cents less per gallon
than gas at Chevron.
3. If you want to buy 5 gallons of gas, 4. how much will you pay at Chevron?
Consistent language
Inconsistent language
R
el
ati
o
n
al
te
rm
“MO
R
E”
R
el
ati
o
n
al
te
rm
“L
ESS”
Figure 2.6 –Arithmetic word problems used by Hegarty et al. [1992]. There were four versions with consistent and inconsistent language and with relational words "more" and "less".
Ballard et al. [1992] used an eye-tracking to study the hand-eye co-ordination during sequential tasks, such as copying a model. The participants were asked to copy a model using the blocks provided in a separate area on the screen. The participants had to copy a given model in terms of both the colour of the block and its position relative to the other blocks. The task complexity was determined by the number of blocks involved in the model. The authors found that there was a clear cognitive algorithm to complete such tasks:1)participants looked at a block in the model and remembered its colour;2)they looked at the same colour block in the source area;3)they picked up that block;4)they revisited the block in the model and remembered its position;5)they moved the block from the source area to the copying area. The authors observed that the fixations on the blocks were either at the onset of the hand movement or at the end of the movement.
Charness et al. [2001] conducted a study to compare the gaze patterns of expert and inter-mediate chess players. The participants were asked to make the best move for a given chess position as quickly and as accurately as possible. The experts were faster and more accurate than the intermediate players in terms of making the move. The authors observed that the experts looked more at the vacant blocks than the intermediate players; and while fixating on the pieces the experts spent more time than intermediate players on the relevant pieces. Also experts made longer saccades than the intermediate players. Charness et al. [2001] con-cluded that the experts encoded the configurations more than the individual pieces; while the intermediate players encoded the positions of individual pieces.
Reingold et al. [2001] used the gaze data of expert chess players to find out how they encoded 12
2.2. Gaze as an analytics tool
a given chess position. The authors conducted a study with different levels of chess players (novices, intermediates and experts) and two tasks. In the first task, participants were shown two kinds of chess configurations (figure 2.7): random and original game configurations. Each configuration had a modified form as well where the authors modified one of the pieces in the gaze contingent zone, i.e., the zone that was clearly seen by the participants; rest of the visual stimuli was blurred (the bright circular zones in each of the configurations in figure 2.7).
Figure 2.7 –Chess positions used by Reingold et al. [2001].
Participants were asked to detect the modified piece. In the second task, the participants had to detect whether there was acheck situationon a 3 X 3 chess board. For the first task, the authors calculated the area of visual span as the number of squares looked at by the participant. The results showed that, in the original game configurations the experts were faster to detect the modification and had a larger area of visual span, than those in random configurations. Reingold et al. [2001] found no differences for the novices and intermediate players across the two configurations. In the check detection task, experts made fewer fixations on pieces than the less-skilled players. The authors concluded that the experts encode a larger chunk of the configuration than the novices as they use their foveal and parafoveal regions to get inter piece information as suggested previously by Chase and Simon [1973].
cogni-Chapter 2. Related Work
tion worked. The drivers were asked to complete three 4-km drives with additional cognitive task of arithmetic addition: easy, with one digits addition (6+3=9) and difficult, with two digits addition (46+37=83), and no task. The drivers looked more on the forward view in task conditions than in no task condition. However, they paid less attention to the mirrors, instruments and the peripherals during task conditions than in no task conditions. The level of difficulty in the cognitive tasks elevated these differences. Also the subjective ratings about the cognitive load, reduction of safety and distraction was found to be increased from no task to easy task to difficult task conditions.
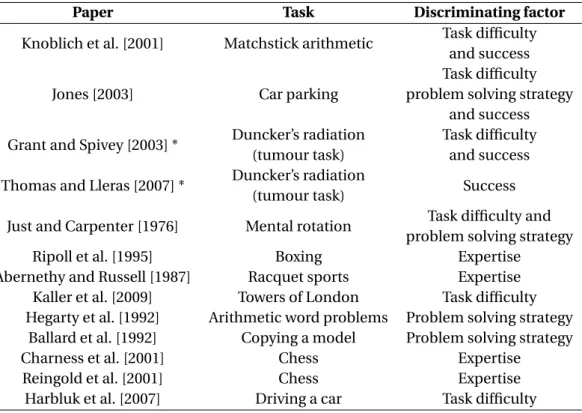
The following table summarises the findings reported in previous studies:
Table 2.1 –Different factors in problem solving and their gaze correlates. Rows marked with “*” represent the studies where an intervention/feedback was introduced, that resulted in a
significant improvement in task-based success.
Paper Task Discriminating factor
Knoblich et al. [2001] Matchstick arithmetic Task difficulty and success
Jones [2003] Car parking
Task difficulty problem solving strategy
and success Grant and Spivey [2003] * Duncker’s radiation
(tumour task)
Task difficulty and success Thomas and Lleras [2007] * Duncker’s radiation
(tumour task) Success
Just and Carpenter [1976] Mental rotation Task difficulty and
problem solving strategy
Ripoll et al. [1995] Boxing Expertise
Abernethy and Russell [1987] Racquet sports Expertise
Kaller et al. [2009] Towers of London Task difficulty
Hegarty et al. [1992] Arithmetic word problems Problem solving strategy
Ballard et al. [1992] Copying a model Problem solving strategy
Charness et al. [2001] Chess Expertise
Reingold et al. [2001] Chess Expertise
Harbluk et al. [2007] Driving a car Task difficulty
2.2.2 Gaze in communication and referencing
Gaze and speech are coupled. Previous studies had shown a strong relation between dialogues and/or speech of the speaker and his/her gaze. Also there were studies showing the relation between the speakers’ dialogues and listeners’ gaze. In this section, we review some of the studies which shed some light on the gaze-speech coupling.
Meyer et al. [1998] showed that the time duration between looking at an object and naming it is between 430 and 510 milliseconds. In their experiment, the participants were shown line 14
2.2. Gaze as an analytics tool
diagrams of a few objects and were asked to name them. Griffin and Bock [2000] showed that there exists an eye-voice span of about 900 milliseconds. The eye-voice span denotes the time between looking at a picture and start to provide a short explanation to it. Zelinsky and Murphy [2000] had shown that there was a correlation between the time spent gazing at an object and the spoken duration for naming that object. In the experiment conducted by Zelinsky and Murphy [2000], the participants were shown objects with one (cat, car) and two (aircraft, basket) syllable names. The authors found that the participants looked at two syllable objects for longer durations than they looked at one syllable object.
Allopenna et al. [1998] conducted an experiment to measure the time duration between the speaker’s verbal reference to an object and the listeners’ gaze-onset on the referred object. The authors used stimulus images as shown in the figure 2.8. The main function for thereferent
and thecohort(figure 2.8) was to provide the same audio cue to the listener. For example, both the words “beaker” and “beetle” would activate the same an initial tendency to look at the object in the image. This introduced a situation where the listener had to pay attention to the whole word. Allopenna et al. [1998] showed that the mean delay between hearing a verbal reference and looking at the object of reference (the listeners’ voice-eye span) was between 500 and 1000 ms.
Figure 2.8 –Stimulus image used by Allopenna et al. [1998]. In this particular image the the beaker is the referent, beetle is the cohort, speaker is speaker and carriage is unrelated.
Richardson et al. [2007] proposed the eye-eye span as the difference between the time when the speakers started looking at the referent and the time when listeners looked at the referred object. In a dual eye-tracking experiment, Richardson et al. [2007] asked one of the participants in each pair to narrate the relationship between the characters in the famous TV series “Friends” to the other participant in the pair. The authors measured the time lag between the speakers looking and referring at a specific actor and the listeners looking at the same actor. This time
Chapter 2. Related Work
lag was termed as the cross-recurrence between the participants. The results show that the cross recurrence was correlated with the correctness of the answers given by the listeners in a comprehension quiz. The average cross-recurrence was found to be between 1200 and 1400 milliseconds. This time was consistent with the additions of eye-voice span found by Griffin and Bock [2000] and voice eye-span found by Allopenna et al. [1998].
Jermann and Nüssli [2012] extended the concept of cross-recurrence in a pair programming task, by enabling the remote collaborators to share their selections on the screen. The authors found the similar levels of cross-recurrence as it was found by Richardson et al. [2007]. The participants in this dual eye-tracking experiment were asked to collaboratively understand a JAVA program of about 200 lines of code. The selections made by one participant in each pair were also shown to the other participant in the pair. Jermann and Nüssli [2012] found that the cross-recurrence levels were higher when there was a selection present on the screen than the times when there was no selections on the screen. Moreover, the cross-recurrence was higher, in the case, when a selection was followed by a verbal explanation.
Gergle and Clark [2011] conducted a dual eye-tracking study where the participants completed a collaborative reference elicitation task. The participants were given four replicas for the same sculpture. The key task for the participants was to find the correct replica. To find the correct replica the participants were required to discuss amongst themselves the different objects in each replica and matching them with the original sculpture. There were three conditions in the experiment:1)the pair was seated side-by-side,2)the pair was seated across the table, and3)the pair was allowed to move. The authors found that the mobile pairs produced more local references (including pronouns like “this”, “here”) while the seated pairs produces more elongated references (with additional modifiers). Moreover, the authors also found that the gaze overlap between the partners was lowest when the references were local as compared to when the references had location modifiers.
Duchowski et al. [2004] compared three modalities of assisting a referrer’s deictic references to his partner in a virtual collaborative environment. The three assisting cues were: head rotation, head and eye rotation, head and eye rotation with the light-spot over the target. The participants were asked to verbally identify the target selected by the referrer. The authors concluded that the reference disambiguation is fastest when the light-spot was shown along with the head and eye rotations.
Cherubini and Dillenbourg [2007] explored the relation between the ability to explicitly refer at something in a collaborative map annotation task, and the success in the task. The participants were asked to plan a music festival around the university campus by annotating a map with parking spots, places for drinks and stages. The participants were given a chat tool. The chat application had two modalities. In one of the modes the participants could link the the places they were talking about in the map with what they wrote in the chat; while in the other mode there was no such facility. The results showed that the with the explicit referencing enabled the pairs were faster in completing the task; and they had more concrete references in the
![Figure 2.2 – Car Park problem used by Jones [2003]. The object car is coloured in black.](https://thumb-us.123doks.com/thumbv2/123dok_us/10996591.2987307/29.892.247.695.760.1008/figure-car-park-problem-jones-object-coloured-black.webp)
![Figure 2.3 – Typical example of tumour task used by Grant and Spivey [2003] and Thomas and Lleras [2007]](https://thumb-us.123doks.com/thumbv2/123dok_us/10996591.2987307/30.892.184.662.643.967/figure-typical-example-tumour-grant-spivey-thomas-lleras.webp)
![Figure 2.5 – Tasks used by [Kaller et al., 2009]. (a) Type 1: one-move problem. (b) Type 2:](https://thumb-us.123doks.com/thumbv2/123dok_us/10996591.2987307/33.892.155.783.313.733/figure-tasks-used-kaller-et-type-problem-type.webp)
![Figure 2.7 – Chess positions used by Reingold et al. [2001].](https://thumb-us.123doks.com/thumbv2/123dok_us/10996591.2987307/35.892.224.713.289.785/figure-chess-positions-used-reingold-et-al.webp)
![Figure 2.8 – Stimulus image used by Allopenna et al. [1998]. In this particular image the the beaker is the referent, beetle is the cohort, speaker is speaker and carriage is unrelated.](https://thumb-us.123doks.com/thumbv2/123dok_us/10996591.2987307/37.892.289.653.562.876/figure-stimulus-allopenna-particular-referent-speaker-carriage-unrelated.webp)