Service Quality Improvement through Business Process
Management based on Data Mining
Sung Ho Ha
Kyungpook National University
1370 Sangyeok-dong, Buk-gu, Daegu, Korea
hsh@mail.knu.ac.kr
Sang Chan Park
Korea Advanced Institute of Science and Technology
373-1 Kusung-dong, Yusong-gu, Daejeon, Korea
sangpark@mail.kaist.ac.kr
ABSTRACT
To improve the quality of service, internal business processes should be managed like the intermediate products are controlled for quality of final products in the manufacturing industry. The Business Process Management (BPM) aims to improve processes and requires both analysis and evaluation of practices. In this paper, we introduce the voice of call center customers (VOC) as a data source for BPM in the service industry. We adopt a VOC management framework that acquires data about business processes performance and quality of services. We develop a Web-based system for analyzing the VOC of a life insurance company, which helps decision makers understand customer needs better and helps them make consistent decisions regarding customer support. It uses conventional statistical and data mining techniques to identify customer voice patterns. We gather actual customer complaints from the service operation of the target company. Using this data, the system pinpoints problematic areas where complaints happened, the relationship among problems, and the root cause of problems.
Keywords
Service quality, business process management, voice of customer, life insurance, customer relationship management, data mining.
1.
INTRODUCTION
While companies try to improve key business processes to maximize their own values, business processes are mostly managed based on experts’ or leaders’ experiences in business practice. Non-value added processes are sometimes over-controlled. In this environment, a structured framework for a systematic BPM is required.
However, there is a surprising lack of an overall framework to support improvements based on the data about the performance of each business process. In service industries such as life insurance, BPM is more salient than in the manufacturing industry. The process of acquiring and receiving services is a product itself in the service industry.
There are some difficulties in applying BPM in a service industry [1]. First, it is difficult to define processes and their flows. Flowcharts and process maps are hardly used in the service industry. Second, it is hard to measure process performance. Third, some noisy or uncontrollable factors such as customer behavior influence service processes.
Although process management aims at improving service quality and necessarily requires both analysis and evaluation of critical practices, most existing packages for BPM focus mainly on process design, configuration, process-aware information systems, and process enactment. They report the simple statistical
summaries about the workflow status. However, they do not support sufficient diagnoses [16]. Because non-measurable factors such as customer responses are not considered, the analytical results are not sufficient to find effective process improvement methods.
To overcome these shortcomings, we have developed the VOC as a new data source for BPM in service industries. The VOC is comprised of all kinds of messages from customers including asking, claiming, complaining, and commending or praising. The VOC tells what customers think about companies’ current offerings. Companies’ offerings are highly related to business processes. It is possible to detect problematic internal business processes through the VOC analysis. However, VOC itself is not suitable for analytical purpose from the viewpoint of knowledge discovery in databases. Therefore, VOC should be converted from the customer-side view to the company-side view.
In addition, we perform a new practice for BPM using VOC in the service industry. We have devised a Family Of Measurements (FOM) as the performance of businesses processes, and have applied the system to financial industry. We have gathered the VOC from call centers of a life insurance company and have constructed a web-based system embedding the VOC analysis function.
2.
LITERATURE REVIEW
According to both academic and practitioner’s literature, research methodologies used for analyzing and utilizing the VOC vary with application domains. Until now, a great deal of research on VOC analysis has deployed the VOC in soliciting and understanding customer requirements in new product development from conceptual design through to manufacturing. This kind of application uses the VOC as input to Quality Function Deployment (QFD) for formalizing the process of listening to the customer.
Tang et al. used QFD to translate the VOC into product design by analyzing customer requirements through the various stages of product development [15]. Haar et al. developed an approach to fine-tune the product or service offering through incorporating the VOC into the design of new products or services in a technology-based multinational company [7]. Matzler and Hinterhuber illuminated a set of methods which ensure better understanding of customer needs as well as procedures to enhance communication by focusing on the VOC within a product development project [11]. Cooper claimed that a high quality new product process is a must in successful product development. He placed emphasis on the VOC to increase new product performance [5]. Cristiano et al. investigated cross-national differences as well as the implications of using QFD as a tool to bring the VOC into the product development process [6].
Several applications, other than new product design and development in manufacturing, also exist. Hongen and Xianwei developed a systematic planning approach for the implementation of total quality management during the product design or development process through a QFD technique which analyzed the VOC [9]. Radharamanan and Godoy used QFD to deploy the VOC in understanding customer requirements and to include them in the continuous improvement of quality in services that are provided by a health care system [14].
There are many applications that incorporate Web technology and artificial intelligence into simple QFD. Huang and Mak proposed a Web-based QFD system which offers remote and simultaneous access on the Internet and which supports more efficient methods in order to listen to the VOC [10]. Chen, Khoo, and Yan developed a prototype system which systematically solicits customer requirements from the VOC and analyzes customer orientation with neural networks in the development of new golf clubs [4]. Myint provided a methodology for the development of intelligent QFD applications in a personal computer assembly environment. He described the needs of VOC in developing intelligent QFD in product creation and expansion [13]. Xie proposed a hybrid system incorporating QFD, an analytic hierarchy process, and fuzzy set theory for the decoding, prioritizing, and inferring of qualitative, vague, or imprecise VOC [17]. Yan, Chen, and Khoo realized a prototype system which combined a laddering technique and a radial basis function neural network for customer requirements acquisition from the VOC. This was done in terms of a multicultural factor evaluation for a refrigerator design [18].
3.
METHODOLOGY
3.1
VOC Management for BPM
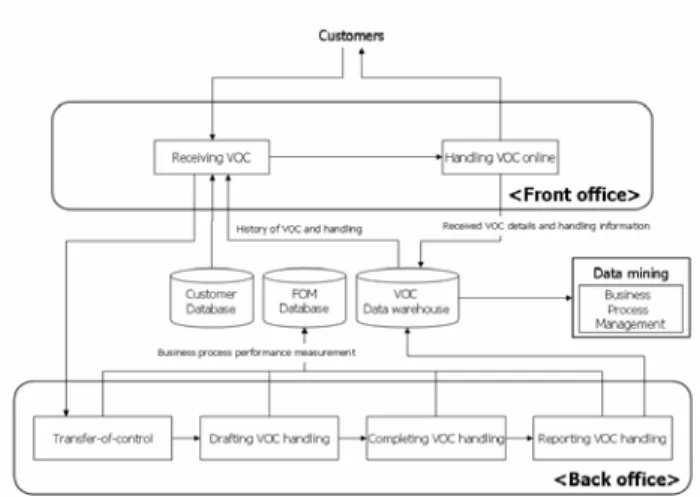
The target company sets up customer supporting centers, which manage VOC over the diverse VOC receipt channels including automatic response service, call centers, and Internet homepages. Some VOC cannot be directly handled on contact points. Customer support representatives cannot handle complicated VOC that requires approvals of the other departments or inquiries to the other institutions. In such cases, the VOC is transferred to the person (or department) in charge in the back office.
There are problems in handling with the transferred VOC: transfers to inappropriate persons, failures to notices, and non-sharing of transferred VOC. Therefore, as depicted in Figure 1, we have implemented the framework of VOC management for BPM with the following features.
z According to the type of VOC, posterior processes required should be mapped to the persons in charge.
z Notices of transferred VOC should be systematically performed in enterprise-wide operating systems that should be integrated on both back- and front-office.
z We construct a data warehouse, in which customer information, received VOC details, and handling information is recorded, to share the status of VOC handling or any feedback.
z From the initial transfer to the end of the VOC-handling, every intermediate process, from drafting a plan to completion, should be monitored. We record business performance measurements in the FOM database.
z The company analyzes the data in both VOC data warehouse and FOM database, and derives information about bottleneck and value-added processes.
Figure 1. The framework of VOC management for business process management.
3.2
VOC Characteristics
Voice of customers is about listening to customers. There is no one monolithic voice of the customer. Customer voices are diverse and include the following: advice, praise/suggestion, complaints, and claims. Some customers can advise the company on a summary or details of consultations about insurance goods or services. Other customers may praise the company or suggest opportunities for improving the services provided. VOC encompasses various specific complaints from customers. These complaints often develop into legal claims, which may result in administrative correction orders from company management. The purpose of gathering VOC is to serve customers by resolving their complaints and identifying their needs. In addition, it aims to prevent similar types of complaints from occurring again. To do so, we should systematically organize the VOC and carefully investigate the subject matter. The mass of interview notes, documents, market research, and customer data needs to be distilled into a handful of statements that express key customer issues. 5W1H is a useful tool to assist in this effort and serves as the basis for organizing the customer complaints into the following: who, when, where, what, why, and how. We can easily identify who, when, where, and what from the VOC. However describing why and how is not that simple.
To express customer complaints in terms of why and how, we use seven types of failure mode errors: information validation omission, process validation omission, reception omission, transmission omission, information feedback omission, process improvement omission, and process exception [3]. They are designed to analyze the customer and server processes and the ways in which they fail to produce the desired results. Each of them occurs mainly due to a lack in either procedure or information. A lack of procedure means that an error (i.e. a complaint) happens because of defects in the prevention system. Even if appropriate procedures exist to prevent errors, a complaint can happen due to a lack of information.
3.3
Business Process Mapping
VOC itself is not suitable for analysis of a business process, because it is expressed by customers who do not care about internal business processes. In addition, a company has its own code structures to record received VOC details in the database. This code structure represents the topic that the received VOC is related with. The existing VOC code structures are not suitable for analytical models, since they are for transaction processing rather than for analysis. In order to produce reasonable and valuable analysis results for decision making, we have devised a code structure that describes the substance of customer complaints. It reflects requisite analytical viewpoints about VOC. For business process management based on VOC, business processes should be mapped to the VOC. The internal business processes may not be the same as customer-perceived external processes. Because customers do not care about internal business processes, the actual processes and their flows should be identified through conversion. In conversion, we use Process Classification Framework (PCF) as the basis. PCF has been developed by the American Productivity & Quality Center, with the assistance of several major international corporations [2]. PCF is a high-level, industry-neutral enterprise model that allows businesses to see their activities from a broad, cross-industry process viewpoint. Many organizations have used PCF in practical ways to understand their processes better. PCF serves as a common reference about business processes.
Through business process mapping, a company can acquire direct feedback of customer evaluation on external processes. Additionally, the company assesses the adequacy and performance of the current approach for fulfilling customer needs, and identifies its strengths and weaknesses. Eventually, the company detects the critical processes that greatly affect customer satisfaction.
3.4
VOC Analysis
In addition to the status of VOC reception, it is also important to handle the received VOC. The company should manage the operational processes which handle VOC and customers properly on back-office. Therefore, it should gather the outputs (or performance) of business processes to identify key business processes and bottleneck processes. To follow up VOC handling, we adopt the FOM concept developed by United Services Automobile Association, as summarized in Table 1 [12].
FOM Description Quantity The number of the VOC occurrences (the absolute
quantity and the relative quantity)
Quality The degree of contribution to customer satisfaction Timeliness
The speed of the VOC handling (the time elapsed from receiving the VOC to the completion of VOC handling).
Cost The amount of money to handle the VOC (e.g., the compensation payment)
Table 1. Family of measurements in service industry.
3.4.1
VOC Analysis Framework
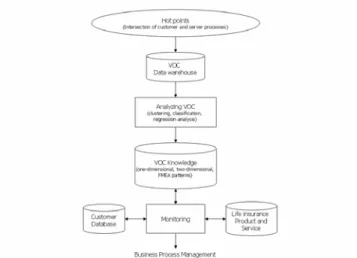
Figure 2 provides a basic understanding of the structure of the proposed system and summarizes the VOC system functions that are necessary for an effective VOC analysis.
Figure 2. Overall procedure for VOC analysis.
The VOC system identifies the customer and server processes in the aforementioned life insurance company, and gathers the VOC at the hot points where the two processes cross each other. It then performs three types of analysis—one-dimensional analysis, two-dimensional analysis, and Failure Mode and Effects Analysis (FMEA)—along with a VOC database. The system utilizes a statistical technique (regression analysis) and machine learning techniques (self-organizing map and C5.0) to extract knowledge of customer needs. Domain experts verify the extracted knowledge in advance of storing them in a VOC knowledge base, which also incorporates other knowledge provided by the domain experts.
The VOC system continuously looks at changes in the knowledge base, customer database, and product or service database, and detects the matching patterns, so that it generates a recommended course of actions including the possibility of an early warning.
3.4.1.1
Customer and Server Processes
The service operation conducted by the life insurance company is generally divided into nine phases: access, registration, diagnosis, exploration, segmentation, maintenance, payment (loan), return to community, and post-sale maintenance. Figure 3 classifies these nine phases into customer process, server process, and hot points. A potential customer chooses a life insurance company in the Access phase. In the Registration phase, the company selected explains life insurance policies and clauses to the customer and receives a written subscription from him or her. The applicant (potential customer) undergoes a medical examination in the Diagnosis phase. The insurance company screens him or her to determine if he or she is a suitable candidate for coverage. The Exploration phase seeks other cross-selling (i.e., opportunities selling new policies) by considering the insured’s characteristics. The Segmentation phase is helpful in dividing the insured into numerous segments and focusing on target customers. The insured
pays a premium in the Maintenance phase. The insured might receive an insured amount or a contract loan in the Payment (Loan) phase. In the Return to Community phase, the insurance expires, and the insured receives insurance and the relationship with the company is completed at the end of this phase. The insurance company solicits the ex-insured for another new subscription in the Post-sale Maintenance phase.
Figure 3. Customer process, server process, and hot points in a life insurance company.
Most VOC occurs at the hot points where a customer and an insurance company meet. Registration, Maintenance, and Payment (Loan) phases are typical hot points.
3.4.1.2
One-dimensional Analysis
A one-dimensional analysis tries to observe how the VOC occurs, attempts to find out the occurrence patterns of types of customer complaints in the hot points, and discerns problematic areas. The VOC system carries out two kinds of one-dimensional analysis: detailed transaction level and lightly summarized level. Analyzing one-dimensional patterns with complaint details identifies the frequency of each complaint. However, the other one-dimensional analysis uses lightly summarized data, such as Recency, Frequency, and Monetary (RFM) values, to extract additional patterns of types of complaints. Recency describes how long it has been since a life insurance company receives a complaint. As recency increases, the importance of the complaint decreases. Frequency is how many times a complaint is received. Monetary value calculates the cost of solving a complaint.
The patterns resulting from one-dimensional analysis can be divided into four categories: chronic, new, cyclical, and one-time. The chronic pattern indicates that the same types of complaints always occur over a period of time. A new pattern is observed when a complaint only happens at a specific point in time within an analysis period, but after that point it is newly recorded. A complaint, which has a cyclical pattern typically, has up and down cycles (i.e. a repeat in the number of increases and decreases). A one-time complaint cannot be described as having a chronic, new, or cyclical pattern. Note that the four types of patterns are not mutually exclusive and that the occurrence pattern of each type of complaint can be changed in accordance with the various time windows in an analysis period.
Each of the patterns can be identified by data visualization and regression analysis based on occurrence frequency during an analysis period. The detailed methods are described as follows: z Chronic pattern: If the estimated y-intercept is above zero and
the estimated slope of the regression line approximately approaches zero in a linear regression, the complaint is said to be of a chronic pattern.
z New pattern: There exists a time interval that shows a zero frequency and another interval shows a linear (or nonlinear) relationship between time and occurrence frequency.
z Cyclical pattern: An analysis period is split into two time intervals and regression analysis is applied to each of the time intervals. If one interval shows a positive (negative) relationship and the other a negative (positive) relationship between time and frequency, a cyclical pattern exists.
3.4.1.3
Two-dimensional Analysis
One-dimensional analysis finds problematic areas at hot points by discerning the patterns of complaints in each area. If several complaints exist in several areas and they are closely related to each other, a one-dimensional analysis is unable to properly determine the relationships among them. Two-dimensional analysis is an alternative, which is necessary to determine their relationship.
To perform a two-dimensional analysis, the VOC system uses a SOM, which is a neural clustering method that divides the complaints into numerous groups. A SOM, also called a Kohonen network, provides unsupervised clustering. It tries to uncover patterns within the set of input fields and clusters the data set into distinct groups without a target field. Records within a group or cluster tend to be similar, and records in different groups are dissimilar.
After segmenting complaints into numerous clusters, the VOC system uses a decision-tree induction technique, such as C5.0, to capture the most distinctive attributes for each cluster. A decision-tree induction technique utilizes a supervised learning method that constructs decision trees from a set of training examples. It finds features of a newly presented object and assigns it to one of the predefined classes. It generates production rules that can classify unseen cases, which have not been included in the training examples. It represents them with nested if-then statements that people can read and understand easily [8].
3.4.1.4
Failure Mode and Effects Analysis
FMEA allows us to find the sources of current problems. It is a series of systematic activities intended to recognize and evaluate the potential failure modes of an insurance good or service and their effects, and to identify actions, which could eliminate or reduce the chance of the potential failure modes occurring. We use four potential failure modes in this study: prior, posterior,
process, and exception failure modes.
z Prior failure mode: This failure has never happened before, but it happens now. It occurs mostly in new insurance goods or services, since new goods or services can be provided to customers without anticipating problems and their solutions. z Posterior failure mode: It indicates that there are no remedies
in place that are able to deal with certain problems which have already happened. Although the same types of complaints already occurred several times in the past,
procedures are not in place to resolve the problems. The existence of a posterior failure mode shows that even the revealed requirements of customers are not satisfied.
z Process failure mode: Customer complaints occur when the problem solving process is too complicated. It is necessary to make the process easy to benefit the customer.
z Exception failure mode: Customer complaints occur at unexpected problematic areas.
4.
APPLICATION OF VOC ANALYSIS
SYSTEM
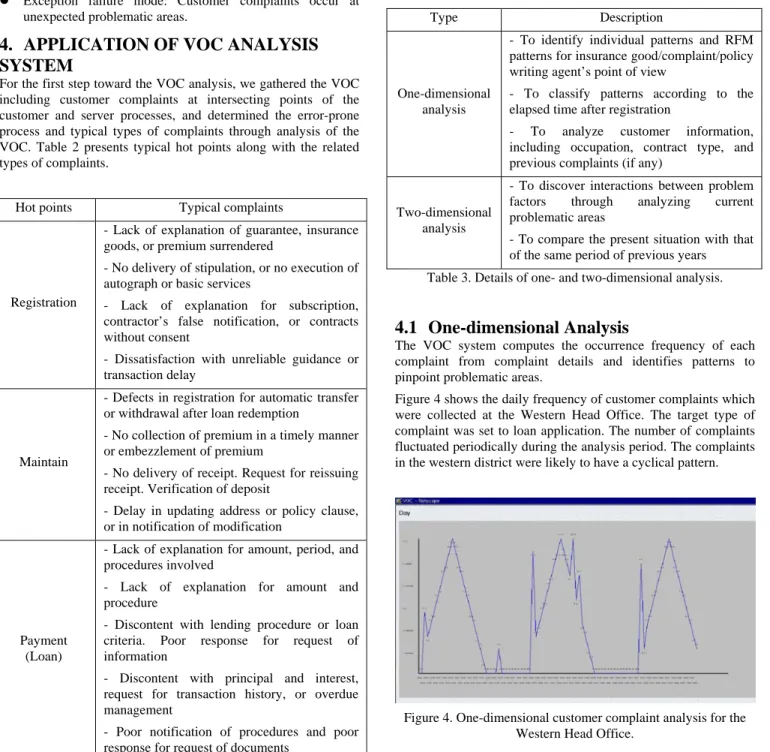
For the first step toward the VOC analysis, we gathered the VOC including customer complaints at intersecting points of the customer and server processes, and determined the error-prone process and typical types of complaints through analysis of the VOC. Table 2 presents typical hot points along with the related types of complaints.
Hot points Typical complaints
Registration
- Lack of explanation of guarantee, insurance goods, or premium surrendered
- No delivery of stipulation, or no execution of autograph or basic services
- Lack of explanation for subscription, contractor’s false notification, or contracts without consent
- Dissatisfaction with unreliable guidance or transaction delay
Maintain
- Defects in registration for automatic transfer or withdrawal after loan redemption
- No collection of premium in a timely manner or embezzlement of premium
- No delivery of receipt. Request for reissuing receipt. Verification of deposit
- Delay in updating address or policy clause, or in notification of modification
Payment (Loan)
- Lack of explanation for amount, period, and procedures involved
- Lack of explanation for amount and procedure
- Discontent with lending procedure or loan criteria. Poor response for request of information
- Discontent with principal and interest, request for transaction history, or overdue management
- Poor notification of procedures and poor response for request of documents
Table 2. Typical customer complaints in a life insurance company. The VOC system performs three types of analysis: one-dimensional analysis, two-one-dimensional analysis, and FMEA. In reality, because it is difficult to perform all three types of analysis
across all areas, it is better to limit the analysis to problematic areas. Therefore, one-dimensional and two-dimensional analyses are good starting points in the preparation of FMEA, since they provide information on problematic areas and their interaction. Table 3 describes details of one-dimensional and two-dimensional analyses.
Type Description
One-dimensional analysis
- To identify individual patterns and RFM patterns for insurance good/complaint/policy writing agent’s point of view
- To classify patterns according to the elapsed time after registration
- To analyze customer information, including occupation, contract type, and previous complaints (if any)
Two-dimensional analysis
- To discover interactions between problem factors through analyzing current problematic areas
- To compare the present situation with that of the same period of previous years Table 3. Details of one- and two-dimensional analysis.
4.1
One-dimensional Analysis
The VOC system computes the occurrence frequency of each complaint from complaint details and identifies patterns to pinpoint problematic areas.
Figure 4 shows the daily frequency of customer complaints which were collected at the Western Head Office. The target type of complaint was set to loan application. The number of complaints fluctuated periodically during the analysis period. The complaints in the western district were likely to have a cyclical pattern.
Figure 4. One-dimensional customer complaint analysis for the Western Head Office.
One way to verify the cyclical pattern is to perform a regression analysis to create trend lines, along with the frequency of complaints. As a result, if a positive correlation between time and frequency changes into a negative correlation (or, conversely, from negative to positive), the complaint follows a cyclical
pattern. After separating the given period into two intervals, the system performs a regression analysis for each interval.
Figure 5 shows a detailed analysis for a type of complaint which was received at the Metropolitan Head Office. The target type of complaint was set to maintenance and modification. The complaint in the metropolitan district is likely to have a new pattern. The new complaint shows different correlations at two time intervals within the analysis period; one interval has no frequency at all and the other has a positive linear (or, non-linear) correlation. It is necessary to investigate the cause of occurrence and to prevent the complaint from becoming serious.
Figure 5. Detailed analysis for the new pattern in the Metropolitan Head Office.
Figure 6. Detailed analysis for an insurance expired complaint in the Eastern Head Office.
As shown in Figure 6, the pattern of complaint, insurance expired, in the eastern region is different from that of the new or cyclical complaint. Since the Eastern Head Office received a similar number of complaints over time (i.e. the estimated y-intercept was above zero and the estimated slope of the regression line
approached zero), the complaint appears to be a chronic occurrence in that district.
Detailed analysis shows that the complaint has a positive linear relationship with time, irrespective of the analysis period including day, week, month, quarter, or year. This indicates that the complaint became chronic, since appropriate action for solving the problem was not taken.
Figure 7. One-dimensional RFM analysis for each head office. Figure 7 shows the results of one-dimensional RFM analysis for each head office selected arbitrarily; they include the Western Head Office, Metropolitan Head Office, Eastern Head Office, and a local head office. Figure 7(a) shows the average recency values of each head office during the analysis period. By definition, as a complaint’s recency increases, the consequence decreases because it occurred a long time ago. The local head office (the rightmost bar) in Figure 7(a) has the greatest recency value during the period. This indicates that the head office has received few recent complaints, as compared with the others. The Metropolitan and Eastern Head Offices (the second and third bars from the left) have received, on the average, more recent complaints than the others. Both of them need special attention.
Figure 7(b) shows that the local head office has the lowest average frequency. When thinking about the results of recency analysis, the Eastern Head Office had many complaints until recently. This means that the region suffers some problems in customer service operation. Figure 7(c) exhibits the average monetary values necessary for resolving customer complaints that occur at each head office.
When considering all three figures, the eastern district is quite likely to have a serious problem with service operations, based on high frequency and monetary values, and low recency value. Since the local head office has low frequency values but relatively high monetary values, the internal process for solving complaints proves to be less efficient in this area. In the Western Head Office, the average cost for solving an individual complaint is very low in comparison with the average frequency in that area. It seems probable that customer complaints in the western region are not as serious as other regions.
4.2
Two-dimensional Analysis
Figure 8 depicts the results of a two-dimensional analysis when the measure of similarity degree was set to 0.8. The measure is one of the execution options in training SOM. It determines the extent of records within a group (i.e., a cluster) that tends to be similar to each other. The bigger the measure, the more similar the records of a group are. As the measure becomes smaller, the records increase in number but become more different. The default value of this measure is 0.9.
Figure 8. Two-dimensional analysis of complaints using SOM and C5.0.
The execution results of SOM are shown in the middle of the figure and assume the form of a 3×3 matrix. In training SOM, output units are restricted to ten or less due to managerial convenience. Generally a SOM ends up with a few output units that summarize many observations, and several units that do not really correspond to any of the observations. The strong units represent probable clusters and have the same color (other than white) in the matrix. In this case, the VOC analysis system derived two dominant clusters.
At the bottom of the figure, a detailed explanation of SOM follows: The first row explains that as a result of executing SOM, two clusters come out and one is bigger than the other. The number of complaints in each cluster determines the size of the cluster. The second and third rows show the characteristics of each cluster. A decision-tree induction technique, C5.0, is used to test which attribute is the most discriminant for each cluster. To do so, C5.0 needs a definition of attributes and classes, and a training set that consists of pre-classified examples, each of which is described by one or more attributes (the frequency of each type of complaints) and exactly one known class (cluster).
When judging from the frequency of complaints, the Western and Metropolitan Head Offices have similar types of complaints, but they definitely differ from the eastern region. This difference comes from the attribute Receipt of Payment, which is classified by C5.0 as the most discriminant descriptor.
4.3
Failure Mode and Effects Analysis
Figure 9(a) shows the frequency of complaints that result from the posterior failure mode and the lack of necessary complaint-preventing procedures at the Western Head Office. Detailed analysis shows that the occurrence pattern of this type of complaint, regarding the loan application, falls into the cyclical category. Periodicity at the western region is due to poor management of posterior failure mode complaints. It is imperative to prepare proper procedures for solving cyclical complaints and to train employees continually for addressing these problems.
Figure 9. Several patterns of complaints revealed by FMEA. Figures 9(b) and (c) show that a complaint, such as maintenance and modification, occurs newly in the metropolitan area. In this area, this type of complaint generally arises from a prior failure mode and a lack in both the complaint-preventing procedures and information. Since most of the prior failure modes reside in new insurance services when developing new services, one method to avoid this kind of complaint is to prepare solutions in advance which can prevent possible problems by using concurrent engineering techniques or sufficient SERVQUAL procedures. Figure 9(d) shows that a complaint, such as the expiration of insurance, has a chronic problem in the eastern area. This type of complaint is attributable to a process failure mode and a lack of procedures. One way to reduce the number of complaints is to simplify complicated procedures and introduce a one-stop service system for customers where they can benefit from efficient services.
5.
CONCLUSIONS
Since analyzing the VOC makes it possible for a target company to identify in advance customer needs and to actively cope with forthcoming opportunities, it has recently attracted attention from organizations. Many other companies have tried to benchmark and to identify their customer needs through analyzing the VOC. The Web-based system developed here offers several characteristics:
z Most companies, until now, have adopted the VOC as input to QFD to solicit and understand customer requirements qualitatively in new product design and development. However, the system for analyzing the VOC contributes to
improving the processing and utilization of the VOC. It derives the problems of service operation in a life insurance company via the VOC and attempts to find out the root cause of the problems. The system can handle customer complaints at hot points as well as prevent those complaints from occurring again.
z Since the production system uses both conventional statistical techniques and data mining techniques, it improves the degree of confidence in the VOC analysis. The system obtains satisfactory results in identifying the types of complaints, such as new, cyclical, and chronic patterns. In addition, it can determine problematic areas (one-dimensional analysis), interactions among problematic areas (two-dimensional analysis), and the root cause of the problems (FMEA).
z The system provides the managerial clues for improving business processes and a course of action through integrating the product or service database, customer database, and knowledge base. Moreover, derived patterns in the knowledge base can be used to identify target customers, help acquire new customers, develop new insurance goods or services, and perform loyalty management.
6.
REFERENCES
[1] Antony, J. Six Sigma in the UK service organisations: results from a pilot survey. Managerial Auditing Journal, 19, 8 (2004), 1006-1013.
[2] APQC Process Classification Framework.
http://www.apqc.org/portal/apqc/site/generic?path=/site/benc hmarking/pcf.jhtml.
[3] Born, G. Process management to quality management. Wiley, New York, 1994.
[4] Chen, C.-H., Khoo, L.P., and Yan, W. A strategy for acquiring customer requirement patterns using laddering technique and ART2 neural network. Advanced Engineering Informatics, 16, 3 (2002), 229–240.
[5] Cooper, R.G. Overhauling the new product process. Industrial Marketing Management, 25, 6 (1996), 465–482. [6] Cristiano, J.J., Liker, J.K., and White, C.C. Customer-driven
product development through quality function deployment in the US and Japan. Journal of Product Innovation Management, 17, 4 (2000), 286–308.
[7] Haar, J.W., Kemp, R.G.M., and Omta, O. Creating value that cannot be copied. Industrial Marketing Management, 30, 8 (2001), 627–636.
[8] Han, J., and Kamber, M. Data mining: concepts and techniques, 2nd eds. Morgan Kaufmann, SF, 2006.
[9] Hongen, L., and Xianwei, Z. A systematic planning approach to implementing total quality management through quality function deployment technique. Computers and Industrial Engineering, 31, 3-4 (1996), 747–751.
[10] Huang, G.Q., and Mak, K.L. Synchronous quality function deployment (QFD) over world wide web. Computers and Industrial Engineering, 42, 2-4 (2002), 425–431.
[11] Matzler, K., and Hinterhuber, H.H. How to make product development projects more successful by integrating Kano’s model of customer satisfaction into quality function deployment. Technovation, 18, 1 (1998), 25–38.
[12] McDermott, R.F., and Teal, T.A. Service Comes First: An Interview with USAA’s Robert F. McDermott. Harvard Business Review, 69, 5 (September-October 1991), 116-127. [13] Myint, S. A framework of an intelligent quality function
deployment (IQFD) for discrete assembly environment. Computers and Industrial Engineering, 45, 2 (2003), 269– 283.
[14] Radharamanan, R., and Godoy, L.P. Quality function deployment as applied to a health care system. Computers and Industrial Engineering, 31, 1-2 (1996), 443–446.
[15] Tang, J., Fung, R.Y.K., Xu, B., and Wang, D. A new approach to quality function deployment planning with financial consideration. Computers and Operations Research, 29, 11 (2002), 1447–1463.
[16] Weske, M., van der Aalst, W.M.P., Verbeek, H.M.W. Advances in business process management. Data & Knowledge Engineering, 50, 1 (2004), 1-8.
[17] Xie, J. An intelligent hybrid system for customer requirements analysis and product attribute targets determination. International Journal of Production Research, 36, 1 (1998), 13–34.
[18] Yan, W., Chen, C.-H., and Khoo, L.P. A radial basis function neural network multicultural factors evaluation engine for product concept development. Expert Systems, 18, 5 (2001), 219–232.
About the authors:
Sung Ho Ha is a professor of business administration at Kyungpook National University. His research interests include machine learning, data mining, e-commerce, agent systems, and intelligent information systems. He received his PhD in industrial engineering from the Korea Advanced Institute of Science and Technology. He is a member of the ACM, the IEEE Computer Society and Computational Intelligence Society, and Decision Sciences Institute (Contact: hsh@mail.knu.ac.kr).
Sang Chan Park is a professor of industrial engineering at the Korea Advanced Institute of Science and Technology. His teaching and research specialties include artificial intelligence, expert systems, machine learning, total quality management, e-commerce, and supply chain management. He received his PhD in management information systems from the University of Illinois. He is a member of the IEEE (Contact: sangpark@mail.kaist.ac.kr).