Vessel fleet size and mix for maintenance
of offshore wind farms
A stochastic approach
Christian Gundegjerde
Ina Blomseth Halvorsen
Industrial Economics and Technology Management Supervisor: Lars Magnus Hvattum, IØT
Co-supervisor: Elin Espeland Halvorsen-Weare, SINTEF
Department of Industrial Economics and Technology Management Submission date: June 2012
El NTNU
Det skapende universitetMASTERKONTRAKT
- uttak av masteroppgave
1. Studentens personalia
Etternavn, fornavn Fødselsdato
Gundegjerde, Christian 26. jun 1985
E-post Telefon
gundegje@stud.ntnu.no 90658778
2. Studieopplysninger
Faku Itet
Fakultet for Samfunnsvitenskap og teknologiledelse I nstitutt
lnstitutt for industriell økonomi og teknologiledelse
Studieprogram Hovedprofil
Industriell økonomi og teknologiledelse Anvendt økonomi og optimering
3. Masteroppgave
Oppstartsdato lnnleveringsfrist
16.jan 2012 11.jun 2012
Oppgavens (foreløpige) tittel
Vessel fleet size and mix for maintenance of offshore wind farms A stochastic approach
OppgavetekstlProblembeskrivelse
The purpose of this thesis is to develop model(s) and solution method(s) to determine an optimal fleet size and mix to be used in the execution of operations and maintenance in the offshore wind industry. The thesis will be based on a stochastic solution approach to be able to capture uncertain factors, e.g. weather conditions and turbine failures, and by this create realistic and robust solutions. The model(s) will then be analysed, and simulations will be used to evaluate different aspects of the solutions and the model(sl.
Hovedveileder ved institutt Medveileder(e) ved institutt Førsteamanuensis Lars Magnus Hvattum
Ekstern bedrift/institusjon Ekstern veileder ved bedrift/instutisjon
SINTEF Elm Espeland Halvorsen-Weare
Merknader
I uke ekstra p.g.a pàske.
atjeg oppfyller kravene for adgang til
a
pâbegynne oppgaven, herunder eventuelle praksiskrav. Partene er gjort kjent med avtalens vilkár, samt kapitlene i studiehàndboken om generelle regler og aktuell studie plan for masterstudiet./I
/1Sted og dato
Student Hovedveileder
Originalen lagres i NTNUs elektroniske arkiv. Kopi av avtalen sendes til instituttet og studenten.
El NTNU
Det skapende universitet
MASTERKONTRAKT
- uttak av masteroppgave1. Studentens personalia
Etternavn, fornavn Fødselsdato
Halvorsen, ma Blomseth 20. apr 1986
E-post Telefon
inabIoms@stud.ntnu.no 91347472
2. Studieopplysninger
Fakultet
Fakultet for Samfunnsvitenskap og teknologiledelse I nstitutt
lnstitutt for industriell økonomi og teknologiledelse
Studieprogram Hovedprofil
Industriell økonomi og teknologiledelse Anvendt økonomi og optimering 3. Masteroppgave
Oppstartsdato lnnleveringsfrist
16.jan 2012 11.jun 2012
Oppgavens (foreløpige) tittel
Vessel fleet size and mix for maintenance of offshore wind farms A stochastic approach
OppgavetekstlProblembeskrivelse
The purpose of this thesis is to develop model(s) and solution method(s) to determine an optimal fleet size and mix to be used in the execution of operations and maintenance in the offshore wind industry. The thesis will be based on a stochastic solution approach to be able to capture uncertain factors, e.g. weather conditions and turbine failures, and by this create realistic and robust solutions. The model(s) will then be analysed, and simulations will be used to evaluate different aspects of the solutions and the model(s’.
Hovedveileder ved institutt Medveileder(e) ved institutt
Førsteamanuensis Lars Mag nus Hvattum
Ekstern bedriftlinstitusjon Ekstern veileder ved bedrift/instutisjon
SINTEF Elm Espeland Halvorsen-Weare
Merknader
I uke ekstra p.g.a pàske.
at jeg oppfyller kravene for adgang til
a
pábegynne oppgaven, herunder eventuelle praksiskrav. Partene er gjort kjent med avtalens vilkàr, samt kapitlene i studiehándboken om generelle regler og aktuell stud ieplan for masterstud let._1
roJ
Sted og datoE...
— StudentILL
-ILL
Hoveciei lederOriginalen lagres i NTNUs elektroniske arkiv. Kopi av avtalen sendes til instituttet og studenten.
ØNTNU
Uet skapende universitet
SAMARBEID SKONTRAKT
1. Studenter i samarbeidsgruppenEtternavn, fornavn Fødselsdato
Gundegjerde, Christian 26. jun 1985
Etternavn, fornavn Fødselsdato
Halvorsen, ma Blomseth 20. apr 1986
2. Hovedveileder
Etternavn, fornavn Institutt
Hvattum, Lars Magnus lnstitutt for industriell økonomi og teknologiledelse
3. Masteroppgave
Oppgavens (foreløpige) tittel
Vessel fleet size and mix for maintenance of offshore wind farms A stochastic approach
4. Bedommelse
Kandidatene skal ha individuell bedømmelse Kandidatene skal ha fe//es bedømmelse
j .I. IL
Sted og dato Christian Gundegjerde
L.
...3
Hov veiIeder ma Blomseth Haivorsen
Originalen oppbevares pa instituttet. Side I av I
Vessel Fleet Size and Mix for Maintenance
Operations of Offshore Wind Farms
a Stochastic Approach
Christian Gundegjerde
Ina Blomseth Halvorsen
Master Thesis
Managerial Economics and Operations Research
Spring 2012
Norwegian University of Science and Technology
Faculty of Social Sciences and Technology Management
Department of Industrial Economics and Technology Management
i
Preface
This master thesis is the final step in achieving a Master of Science degree at the Norwegian University of Science and Technology (NTNU). The degree specialisa-tion is Applied Economics and Optimizaspecialisa-tion at the department of Industrial Eco-nomics and Technology Management. This thesis has been written in cooperation with researchers at SINTEF and MARINTEK as a part of the scientific projects Norwegian Research Centre for Offshore Wind Technology (NOWITECH) and Far Offshore Operation and Maintenance Vessel Concept Development and Optimisa-tion (FAROFF) where one intermediate aim is the development of decision support tools to enable more cost effective operation and maintenance activities for offshore wind farms.
We have received much appreciated help and guidance while working with this thesis, both from professors at NTNU as well as industry contacts. We would like to give special thanks to our supervisors Associate Professor Lars Magnus Hvat-tum from NTNU and Elin Espeland Halvorsen-Weare from SINTEF for their good and inevitable counselling throughout the project. We would also like to thank Bjørn Mo Østgren, Operations and Maintenance Manager for Offshore Wind at Statkraft. Due to limited literature and data available on maintenance of offshore wind farms, his cooperation has been a key part of gaining a better insight into the industry, as well as obtaining realistic input data for the model.
Trondheim, June 8, 2012
iii
Abstract
In recent years the global installed capacity of offshore wind has increased rapidly, due to the world’s green electricity demand. Increasing develop-ments in the offshore wind sector has led to fewer possible locations for new wind farms, forcing the developers to move further and further away from shore. This shift from near-shore to far-shore wind farm locations, increases the complexity and costs of executing operations and maintenance, which can account for 25% of the production cost of power.
The vessels and helicopters that are used to execute preventive and cor-rective maintenance activities are expensive, and a crane vessel can easily cost USD 40 000 per day. The potential savings in determining an optimal fleet size and mix for the execution of maintenance activities on an offshore wind farm are therefore considerable. Using a joint fleet for more than one wind farm, is a way of achieving savings in order to obtain cost-efficient projects. However, uncertain factors, such as turbine failures requiring cor-rective maintenance, vessel spot rates, electricity prices and weather con-ditions limiting the accessibility of the vessels, raise the need for decision support tools.
In this thesis we investigate the possibility of using operations research to determine an optimal fleet size and mix for one or several offshore wind farms. The decisions to be made are how many vessels to acquire or rent in order to meet a given maintenance schedule, in addition to determining whether offshore station concepts are economically viable. Strategic decision support tools in terms of both a deterministic and a stochastic optimisation model are developed and will be presented. Based on different scenarios including turbine failures, vessel and helicopter spot rates, electricity prices and weather conditions, the stochastic model determines the optimal fleet size and mix that should be used to execute maintenance operations on one or several offshore wind farms.
A computational study proves that the stochastic model is able to solve problems for real world wind farms with more than 400 wind turbines. Fur-ther, the value of the stochastic solution and the expected value of perfect information suggest that the stochastic model gives solutions that are fairly well hedged against possible future outcomes, and returns solutions that per-form significantly better than the solutions from the deterministic model. In addition, the stochastic model is shown to have a great economical appli-cability, in terms of determining the willingness to pay for additional wave capacity of the vessels, the possible savings of using offshore station concepts and the potential savings in using a joint fleet on several offshore wind farms. The stochastic optimization model addressing the fleet size and mix prob-lem for offshore wind is the first of its kind, and this thesis has proven that the model has a real world value in terms of being a great strategic decision support tool taking into account the inherent uncertainties of the problem. The model does, however, not consider the logistics of spare parts or the tac-tical day-to-day utilisation of the given fleet, thus further work is suggested on these issues.
v
Sammendrag
De siste årene har global innstallering av offshore vindkraft hatt en kraftig økning, på grunn av verdens etterspørsel etter grønn elektrisitet. Økende ut-bygging av offshore vindkraft har begrenset områdene for nye vindparker, hvilket tvinger utviklerne til å flytte lenger og lenger vekk fra land. Dette skiftet fra near-shoretil far-shorelokasjoner for vindfarmer, øker komplek-siteten og kostnadene ved utføring av drift og vedlikehold, som kan utgjøre 25 % av produksjonskostnaden for kraft.
Fartøyene og helikoptre som brukes til å utføre forebyggende og kor-rektive vedlikeholdsaktiviteter er dyre, og et kranfartøy kan koste mer enn 40 000 USD per dag. De potensielle besparelsene ved å bestemme optimal flåtestørrelse og flåtemiks for utførelse av vedlikehold på en offshore vind-park kan derfor ansees som betydelige. Å bruke en felles flåte for mer enn en vindpark er én måte å oppnå besparelser på, og kan sørge for kostnadsef-fektive prosjekter. Usikre faktorer, som turbinsvikt som krever korrigerende vedlikehold, spotpriser på fartøy, strømpriser og værforhold som begrenser tilgjengeligheten til fartøyene, øker behovet for beslutningsstøtteverktøy.
I denne avhandlingen undersøker vi muligheten for å bruke operasjons-analyse for å bestemme optimal flåtestørrelse og flåtemiks for utførelse av vedlikeholdsaktiviteter på én eller flere offshore vindparker. Beslutningene som skal foretas er hvor mange fartøy som burde leies eller anskaffes for å møte en gitt vedlikeholdsplan, i tillegg til å avgjøre hvorvidt et moderskip-skonsept kan være økonomisk lønnsomt. Strategiske beslutningsstøtteverk-tøy i form av både en deterministisk og en stokastisk optimeringsmodell er utviklet og vil bli presentert. Basert på ulike scenarier, inkludert turbinfeil, spotpriser på fartøy og helikoptre, strømpriser og værforhold, bestemmer den stokastiske modellen optimal flåtestørrelse og flåtemiks som bør brukes til å utføre vedlikeholdsoperasjoner på en eller flere offshore vindparker.
En beregningsorientert studie beviser at den stokastiske modellen er i stand til å løse problemer for virkelige vindparker med mer enn 400 vindtur-biner. Videre, tyder verdien av den stokastiske løsningen og den forventede verdien av perfekt informasjon på at den stokastiske modellen gir løsninger som er godt sikret mot mulige fremtidige utfall, og returnerer løsninger som presterer vesentlig bedre enn løsningene fra den deterministiske modellen. I tillegg har den stokastiske modellen vist seg å ha en stor økonomisk anvend-barhet, i form av å avgjøre villighet til å betale for ekstra bølgekapasitet på fartøyer, mulige besparelser ved bruk av moderskip og potensielle besparelser ved bruk av en felles flåte på flere offshore vindparker.
Den stokastiske optimeringsmodellen som tar opp flåtestørrelse- og flåtemik-sproblemet for offshore vind er den første i sitt slag, og denne avhandlingen har vist at modellen har en reell verden verdi i form av å være et godt strate-gisk beslutningsstøtteverktøy som tar hensyn til den iboende usikkerheten i problemet. Modellen vurderer imidlertidig ikke logistikk av reservedeler eller optimal skiftordning for vedlikeholdspersonell, og videre arbeid består av blant annet disse spørsmålene.
CONTENTS vii
Contents
1 Introduction 1
2 Maintenance of Offshore Wind Farms 7
2.1 Preventive Maintenance . . . 7
2.2 Corrective Maintenance . . . 7
2.3 Vessels and Helicopters Used for Maintenance in Offshore Wind . . 9
2.4 Offshore Station Concepts . . . 11
3 Problem Description 13 3.1 The maintenance activities . . . 13
3.1.1 Execution of the maintenance operations . . . 13
3.2 Composition of the fleet . . . 14
3.2.1 Current and future maintenance fleet concepts . . . 15
3.2.2 Adjustment of the fleet . . . 16
3.3 Location aspect . . . 17
3.4 Uncertainty . . . 17
3.4.1 Weather . . . 17
3.4.2 Vessel spot rates . . . 18
3.4.3 Turbine failures . . . 18
3.4.4 Electricity price . . . 19
3.5 Model Objective . . . 19
4 Literature Review 21 4.1 Strategic fleet planning . . . 21
4.1.1 Maritime FSMP publications . . . 22
4.1.2 FSMP publications addressing uncertainty . . . 23
4.2 Operation and Maintenance Publications . . . 23
4.3 Remarks . . . 25
5 Mathematical Formulation, Deterministic 27 5.1 Assumptions . . . 27
5.1.1 Splitting of The Maintenance Operations . . . 27
5.1.2 Vessel Properties . . . 27
5.1.3 Downtime Cost . . . 28
5.1.4 Efficiency Dependent on the Crew Size . . . 32
5.1.5 Activity Bundles . . . 32
5.1.6 The routing aspect . . . 33
5.2 Definitions . . . 35
5.3 Mathematical model . . . 39
5.3.1 Objective Function . . . 39
5.3.2 Constraints . . . 40
6 Mathematical Formulation, Stochastic 47 6.1 Assumptions . . . 47
6.1.1 Number of stages . . . 47
6.1.2 New sets and variables . . . 48
6.2 Definitions . . . 49
6.3 Mathematical model . . . 53
6.3.1 Objective Function . . . 53
6.3.2 First stage constraints: . . . 53
6.3.3 Second stage constraints: . . . 53
6.3.4 Third stage constraints: . . . 54
7 Method Of Computational Study 59 7.1 Selection of Critical Input Parameters . . . 59
7.1.1 Vessels and Offshore Stations . . . 60
7.1.2 Maintenance Activities . . . 61
7.2 The Generation of Scenarios and Pre-Processing of Input Data . . . 63
7.2.1 The Structure of the Node Tree . . . 63
7.2.2 Fluctuation in Vessel Prices . . . 64
7.2.3 Weather scenario generation . . . 65
7.2.4 Electricity price scenario generation . . . 68
7.2.5 The C++ Application . . . 69
7.2.6 Maintenance Schedule . . . 69
7.2.7 Vessel Determination . . . 71
7.2.8 Other Determined Parameters . . . 72
7.3 Evaluating the models . . . 73
7.3.1 Expected Value of Perfect Information . . . 74
7.3.2 Value of Stochastic Solution . . . 75
7.3.3 Determining the Mean Value Scenarios . . . 76
7.4 The Implementation of the Model . . . 77
8 Computational Study 79 8.1 Aspects of the Solution . . . 79
8.2 Technical aspects to the FSMPOW model . . . 80
8.2.1 Limitations in Problem Size . . . 80
8.2.2 Determining an Appropriate Penalty Cost . . . 82
8.3 Evaluating the Stochastic Model . . . 85
8.3.1 EVPI and VSS . . . 85
8.3.2 Testing the Number of Scenarios . . . 87
8.4 Economical Case Studies . . . 91
8.4.1 Economies of Scale . . . 91
8.4.2 Changes in Electricity Prices . . . 92
8.4.3 The Impact of Wave Capacity . . . 93
8.4.4 The Willingness to Pay for an Offshore Station Concept . . 95
9 Conclusion 99 10 Further Work 101 A Calculation of Input Parameters 109 A.1 Scalar Data . . . 109
CONTENTS ix
B Plain version of the mathematical formulations 113 B.1 The deterministic model . . . 113 B.2 The stochastic model . . . 116
List of Figures
1 World electricity demand forecast . . . 1
2 Renewable power generation . . . 2
3 Development of global offshore wind capacity . . . 2
4 Overview of different forecasts for offshore wind developments . . . 3
5 Breakdown of cost of energy into key elements . . . 4
6 Average failure rates and days out per failure for onshore wind turbines 8 7 Factors influencing the downtime after a failure occurs . . . 8
8 Vessels used for maintenance on offshore wind farms . . . 9
9 Crane vessels used for maintenance activities on offshore wind farms 10 10 Wave heights and vessel accessibility for the Ekofisk area . . . 10
11 Engineer lowered onto the nacelle by a helicopter. . . 11
12 Potential mother ship concepts. . . 12
13 A prospect of the Dutch harbor at sea. . . 12
14 Preventive and corrective replacement cost . . . 13
15 Illustration of how an operation can consist of several activities with different vessel requirements . . . 14
16 Route example . . . 16
17 Point of contracting . . . 16
18 Power output as a function of wind speed . . . 18
19 Expected total cost of maintenance as a continuous function and a step function. . . 29
20 Calculation of the expected downtime cost. . . 30
21 Expected downtime cost for corrective maintenance activities. . . . 31
22 Generation of activity bundles . . . 33
23 The routing problem for the vessels that can stay offshore for several periods. . . 34
24 Illustration of the FSMPOW with two and three offshore wind farms 42 25 Illustration of why constraints (5.21) and (5.22) are necessary. . . . 43
26 Node tree showing the structure of the stochastic formulation of the FSMPOW . . . 47
27 Illustration of the stages used in the computational study. . . 59
28 Illustration of a general maintenance operation and its belonging activities . . . 62
29 The interaction between all the elements involved in the pre-processing and calculation of input parameters needed. . . 63
30 Illustration of a node tree with allocated scenarios. . . 64
31 Probability density of the Weibull distribution. . . 66
32 Wind speed and significant wave height in January 2010 . . . 67
33 Electricity price scenario generation. . . 68
34 An example of a maintenance schedule . . . 71
35 Illustration of how the expected value of perfect information is cal-culated. . . 74
36 Determining the VSS for the three stage FSMPOW. . . 75
37 Solution process of problem instance 1. . . 81
38 Determining the preventive activity penalty cost constant. . . 83
LIST OF FIGURES xi
40 Average result of the EVPI test . . . 86
41 Average results of the VSS test . . . 86
42 Availability of the 150 scenario problems compared to the stochastic
problem . . . 88
43 Expected objective values of for the stochastic problem and the
150-scenario problem. . . 89 44 Optimal vessel fleet size and mix for problems solved with a different
number of scenarios. . . 90
45 Results showing how the expected availability changes with respect
to electricity prices. . . 92
46 Results showing how the investment in the vessel fleet changes with
respect to electricity prices. . . 93
47 Expected downtime cost and penalty cost for different wave capacities. 95
48 Transportation time with and without the Offshore Station. . . 96
List of Tables
1 The distances used in the computational study. . . 60
2 The characteristics for the vessel types used in the computational
study . . . 61
3 The characteristics for the two offshore station concepts used in the
computational study . . . 61
4 The operations, with associated failure rates, used in the scenario
generation. . . 62
5 Probabilities for reaching a node at the second stage. . . 65
6 Mean wind speed v¯ and corresponding scale factor c used in the
wind speed scenario generation. . . 67
7 Problem instances used when testing the impact of problem size on
solution time. . . 80
8 Problem instances and solution times. . . 81
9 Average EVPI and VSS for the different cases. . . 85
10 Results when testing a joint fleet on two wind farms. . . 91
11 Problem instances and average results when increasing the wave
capacity of vessel type 2. . . 94
12 Average transportation, downtime and penalty costs with or without
1
1
Introduction
The world’s electricity demand is increasing rapidly. An expected growth in the global electricity demand of 35 % from 2010 to 2035 (Figure 1), combined with governmental policies to reduce CO2 emissions, will require a new focus on
renew-able electricity sources. The EU 20-20-20 targets include reduction of greenhouse gas emissions by at least 20 % compared to 1990 levels. Reduction of coal fired electricity and an increase in renewable energy is crucial to meet this and other environmental targets (IEA, 2010).
Figure 1: World electricity demand forecast. Based on the IEA World Energy Out-look 2010 scenario that takes into account the policy commitments and plans announced around the world (IEA, 2010). Note: Data converted from million tonnes of oil equiv-alents (Mtoe) to TWh using IEA converting tables. Compounded annual growth rate (CAGR) calculated from 2010-2035.
The International Energy Agency (IEA), expects wind energy to play an im-portant role in the renewable electricity mix in the years to come. However, the expected increase of renewable power generation will depend on whether different governmental policies will be achieved. The IEA have presented three different scenarios, in which the compounded annual growth rate (CAGR) for power gen-eration from wind energy, range between 8 % and 11 % as illustrated in Figure
2. The current policies scenario assumes no change in policy as of mid-2010, the
new policies scenario takes account of the broad policy commitments and plans
announced around the world, and the 450 scenario is based on the goal of 450
parts per million of CO2 equivalent in the atmosphere. The major difference
be-tween the three scenarios is the substitution of coal-fired power generation with renewable energy sources (IEA, 2010).
Within the past 10 years, the global installed capacity of offshore wind has increased rapidly, from 65 MW in 2000, to 4175 MW in 2011 as illustrated in Figure 3. The growth is expected to continue, and different forecasts for offshore wind capacity in the EU in 2020, range between 38 and 64 GW, compared to approximately 3.2 GW in the EU in 2010 (Figure 4). Offshore wind sites are not unlimited. To enable such a strong growth, offshore wind developers will have to move further and further away from shore. Dogger Bank, the largest
Figure 2: Renewable power generation. Based on IEA World Energy Outlook 2010 (IEA, 2010). Note: CAGR is calculated from 2010-2035, and extrapolation has been done using CAGR.
Figure 3: Development of global offshore wind capacity. Source: EWEA (2009a) and 4C Offshore (2011)
zone in the third license round for UK offshore wind farms, is located off the east coast of Yorkshire, between 125 and 290 kilometres offshore (Forewind, 2011). In comparison, the Belgian wind farm Belwind, is located 46 kilometres off the coast of Zeebrugge, and is currently the wind farm located farthest away from shore, if we only take into account fully operational wind farms (Belwind, 2012).
Heavy winds and salty sea make offshore wind turbines more exposed to break downs than onshore wind turbines. Furthermore, rough weather conditions and
3
Figure 4: Overview of different forecasts for offshore wind developments. Source: EWEA (2009b) , The Offshore Valuation Group (2010), The Boston Consulting Group (2011).
greater distances from shore lead to lower accessibility of the wind farm, and makes operations and maintenance of an offshore wind farm difficult and expensive to perform. Operators are highly dependent on weather windows to be able to perform different maintenance activities. The further away from shore, the longer the weather windows must be, to successfully perform the maintenance activities. One of the challenges in the offshore wind industry today, is the need of financial support through different governmental support mechanisms. For an offshore wind farm project to be profitable, the levelised cost of energy must be below the given support scheme (BCG, 2011). The cost of Operations and Maintenance (O&M) can easily make up for 20 % - 25 % of the total power production cost, as illustrated in Figure 5 (Renewable UK, 2011). According to Wind Energy Updates latest Operations and Maintenance report, wind farm owners could face O&M costs up to EUR 100 000 - EUR 300 000 per wind turbine per year (Bussiéres and Cavaco, 2011). The same report concludes that corrective maintenance, as a result of break down on a turbine, makes up for 66 % of the total O&M costs. The losses in revenue as a result of unavailability of the turbine is often of equal size, and comes in addition to the maintenance costs. However, these losses depend upon the electricity price, and can vary considerably from day to day.
In the execution of maintenance operations of an offshore wind farm, the choice of fleet mix can make a great impact on the O&M costs. A helicopter can have a variable cost of 1000 USD/hour (Conklin and Decker, 2011), and a crane vessel can easily cost 40 000 USD/day (Kaiser and Snyder, 2011). The vessel spot rates for maintenance vessels can deviate with up to 60 % from year to year, and makes it difficult to determine whether vessels should be contracted today or in a year (Østgren, 2012). Choosing an optimal fleet mix however, is not necessarily easy. The weather conditions at the specific site, wave height and wind speed in partic-ular, will affect the choice of vessels, and are highly uncertain. Some vessels can access the foundation of the turbine when the wave height is up to 1 meter, while catamarans can generally access the turbine in wave heights up to 1.5 or even 2
Figure 5: Breakdown of cost of energy into key elements. Source: Renewable UK (2011).
meters. Helicopters can access the turbine independently of wave conditions, but require wind speeds less than 18 m/s (Østgren, 2012).
Another factor that has to be taken into account, is the distance from shore. For many of the offshore wind farm projects currently under planning, a harbour or a platform at sea serving as a station for transportation out to the wind farm(s) with accommodation for personnel, storage of spare parts and shelter in emergency situations, could be economically viable depending on the distance from shore. With such a concept, the required weather window for successfully performing a maintenance activity would be reduced considerably.
Whether to rent a vessel or helicopter on a short term, or rent it on a long term but at a lower day rate, is a decision that must be deliberately examined. The optimal decision will depend on the size of the wind farm and the maintenance strategy. A strategy with a high focus on preventive maintenance will require more planned visits to each wind turbine than a run-to-failure strategy. Then again, little focus on preventive maintenance will lead to a higher failure frequency, which again might require even more visits than that of a highly preventive strategy.
Making the right decisions is crucial in the planning phase of an offshore wind farm project. Improvements of only 1 % in the O&M costs can make a relatively big impact on the revenue, given the numbers above. One way of achieving these savings is for several offshore wind farm operators to cooperate on a joint fleet, in order to achieve economies of scale. A model determining the fleet size and mix that is able to serve more than one offshore wind farm can thus be very attractive. The problem of deciding the optimal fleet size and mix for O&M on one or several offshore wind farms will be addressed in this thesis, and will be referred to as the Fleet Size and Mix Problem in Offshore Wind, FSMPOW. This thesis will address the FSMPOW using operations research (OR).
Offshore wind is a relatively new technology, and the number of publications on this subject is limited, which suggests that advanced OR is not in extensive use today. Considering the complexity of choosing a fleet size and mix, and the high economic impact of these decisions, wind farm developers should to a greater extent take advantage of operations research tools.
To address the FSMPOW, we will first develop a deterministic model. Not to neglect the inherent uncertainty of the problem, including unplanned failures with the following need of corrective maintenance, uncertainties in electricity prices,
5
vessel spot rates and weather conditions, we will develop a stochastic node for-mulation of the FSMPOW. This will give decision makers considerable decision support when determining the fleet size and mix to execute maintenance activities on one or several offshore wind farms.
In the next section, different aspects regarding operations and maintenance within the offshore wind industry is described. In Section 3 a in-depth description of the FSMPOW is given. Relevant literature is reviewed in Section 4. A de-terministic mathematical formulation of the FSMPOW is presented in Section 5, before presenting a stochastic node formulation of the FSMPOW in Section 6. In Section 7 we present the methods that have been used during the computational study. We continue with presenting the results from the computational study in Section 8. Section 9 sums up the results in a conclusion, before further work on the FSMPOW is discussed in Section 10.
7
2
Maintenance of Offshore Wind Farms
Offshore wind is a relatively new technology, and the execution of maintenance operations on offshore wind turbines is very different from O&M on onshore wind turbines. In this section we will try to give the reader an impression of the O&M process for offshore wind turbines, as this will give a better understanding of the problem description that will be presented in the next section.
2.1
Preventive Maintenance
Preventive maintenance is conducted to extend the life time of a turbine, and to keep the number of failures at a reasonable level. A preventive maintenance opera-tion can include visual inspecopera-tions, changes of consumables (greasing, lubricaopera-tion, oil filters), oil sampling and re-tightening of bolts (Besnard et al., 2009). The frequency at which preventive maintenance should be executed, will depend upon the maintenance strategy developed for the specific wind farm. An optimal main-tenance strategy is based on the types of turbines being used, because the costs of spare parts and failure frequencies will vary between different turbine producers and models. However, some preventive maintenance strategies suggest 1 - 2 visits to each turbine every year. The preventive maintenance operations generally take 1-2 days per turbine, and normally require 2 maintenance personnel transported to the turbine by either a vessel or a helicopter. It is common to have a major overhaul of each wind turbine every 5 years, which normally requires around 100 man hours (Van Bussel et al., 2001).
Considering the fairly high failure rates of offshore wind turbines and the high downtime cost, having no maintenance strategy at all would reduce the availability of the wind farm considerably, and thus not be an option (Van Bussel and Schöntag, 1997).
2.2
Corrective Maintenance
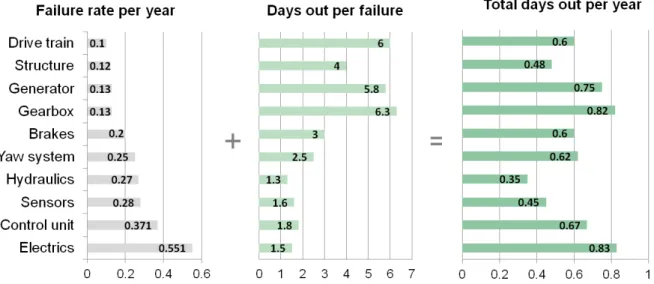
If a wind turbine faces a break down, corrective maintenance has to be executed. A break down can happen for a number of different reasons, and the frequency at which they happen will vary dependent on turbine manufacturer and model. Con-sidering offshore wind being a relatively new technology, little research has been done on this specific matter. However, a number of articles have been written on failure rates for onshore wind turbines. The German Wind Energy Measurement Program did a research on 1500 onshore turbines in Germany over 10 years from 1997 - 2006, where they collected valuable data on failure rates (Milborrow, 2010). Although these might not be entirely representative for offshore wind turbines, they give an impression of how failure rates and days out per failure influence the total downtime of a wind turbine. This is illustrated in Figure 6.
The electrical system is the most common source for failure, with 0.55 incidents per year. Although the turbine is generally back into operation after only 1.5 days, the high failure rate leads to a long total downtime. The gearbox, on the other
hand, has a relatively low failure rate, only 0.13 incidents per year. When a
gearbox fails however, the outage time is much longer, normally over 6 days. Although increased focus on preventive maintenance can reduce the number
Figure 6: Average failure rates and days out per failure for onshore wind turbines. Research done on 1500 onshore turbines in Germany over 10 years (1997-2006) by the German Wind Energy Measurement Programme (Milborrow, 2010)
of failures on a wind turbine, a complete mitigation of the risk is highly unlikely. That being said, it is possible to limit the downtime by focusing on the several factors influencing the actual time required to get a turbine back in operation. The total downtime of a turbine can roughly be divided into four parts, as illustrated in Figure 7. After a failure occurs, getting hold of the right vessels and spare parts can take time. Once the required vessels are in place, one have to wait for an appropriate weather window, and this waiting time will depend upon the specifications of the vessel. The distance from the base of the vessel to the offshore wind farm and the speed of the vessel will determine how much time is spent in transport. Once the vessel is located at the turbine, the maintenance task can be executed, and the time required will vary dependent on the type of failure (Allwood and Sharp, 2006).
Offshore wind power producers in the UK receive approximately EUR 100 per MWh of produced power in support (Ofgem, 2011). A 5 MW turbine can thus have a downtime cost of EUR 12 000 per day, and this is without considering
2.3 Vessels and Helicopters Used for Maintenance in Offshore Wind 9
the electricity price. Figure 7 illustrates the great influence vessels make on the downtime of a turbine after a failure has occurred. Having vessels with the right specifications available can reduce the downtime considerably, and emphasises the importance of the FSMPOW.
2.3
Vessels and Helicopters Used for Maintenance in
Off-shore Wind
For preventive maintenance, which normally consists of transporting personnel with a limited need of equipment, small supply vessels like the WindCat, Fob Lady, Fob Swath 1 and SWATH Tender are used today (Figure 8). These vessels can also transport smaller parts, and the SWATH Tender, currently used at BARD offshore wind farm located 100 km off the German coast, can carry 12 passengers and has a maximum deck load capacity of 1.5 tonnes. RIB’s (Rigid Inflatable Boats) are only used for short distances, and in good weather conditions. For intermediate sized components like main bearing and yaw drive, a larger supply vessel is required for transportation (Gardner et al., 2009).
(a) FOB SWATH 1. Photo: Odfjell Wind AS (b) SWATH Tender. Photo:
www.elbe-pilots.de
Figure 8: Vessels used for maintenance on offshore wind farms
For replacing large components like blades, the generator or the nacelle, a crane vessel is required. The jack-up barge Odin, lifts itself over the surface by placing its four legs on the seabed as illustrated in Figure 9(a). The jack-up barge can lift up to 500 tonnes and stay offshore for weeks (HOCHTIEF, 2011).
However, the jack-up concept puts a restriction on the water depth. Crane vessels on the other hand, can operate at any water depth, and the multipurpose crane vessel Rambiz, which did the installation at the Beatrice wind farm in UK, can lift up to 3300 tonnes as illustrated in Figure 9(b) (Scaldis N.V., 2011). Increasing investments in offshore wind has led to developments in the offshore wind vessel industry and there are a number of new concepts for deeper waters and harsher environments on their way.
Currently the vessels used for offshore wind maintenance cannot, and should not, operate in significant wave heights above 1.5 m - 2.5 m, and wind speeds over 18 m/s (Østgren, 2012). For the regions around the Baltic sea, this restriction should not affect the accessibility of the wind farm to a great extent. In the North Sea however, the number of days in which the wave height is more than 2 meters is considerably higher. Data we have gathered on wave heights from the Ekofisk field
(a) Jack-up barge Odin Photo: Island Shipping 2007
(b) Crane vessel Rambiz
Photo: Scaldis salvage and marine contractors N.V.
Figure 9: Crane vessels used for maintenance activities on offshore wind farms
Figure 10: Wave heights and vessel accessibility for the Ekofisk area in the North Sea
in the North Sea (Norwegian Meteorological Institute, 2012), show that the wave height is below 2 meters 225 days of the year, giving a vessel with wave capacity of 2 meters only an accessibility of 61 % as illustrated in Figure 10. If the wave capacity of the vessel were increased to 3 meters however, the accessibility would be increased to 86 %.
Considering the high costs of downtime, effective access systems can be rela-tively expensive, and still favourable. In some cases, like in Horns Rev offshore wind farm in Denmark, Helicopters are used to transport engineers out to the tur-bines (Gardner et al., 2009). The helicopter cannot land, but can lower people to the top of the nacelle as illustrated in Figure 11. Although having a helipad that would allow helicopters to land is a different issue, the ability to lower engineers to the top of the nacelle has relatively little impact on the turbine design.
Further-2.4 Offshore Station Concepts 11
more, the helicopters are not limited by the wave conditions, but they do require good visibility and acceptable wind speeds. Helicopter access is probably not prof-itable for many of the wind farms in operation today, with increasing distances from shore, the savings in time and the high accessibility compared to vessels can make helicopters economically viable (Tong, 2010).
Figure 11: Engineer lowered onto the nacelle by a helicopter. Photo: Eurocopter
2.4
Offshore Station Concepts
While moving further out to sea, the travel time will increase, and longer weather windows will be necessary to allow for maintenance to be executed. For many of the wind farms currently under planning, new concepts are in development. Forewind, a consortium comprising the four large energy companies Statoil, RWE, SSE and Statkraft, is planning the development of Dogger Bank. The wind farm field has a planned capacity of 9 GW, which is more than the double of the world’s installed offshore wind capacity today. In addition to being the worlds largest offshore wind farm, it will be located the farthest away from shore, between 125 km and 290 km (Forewind, 2011). Due to the location and size of the Dogger Bank project, different offshore station concepts are being analysed (Østgren, 2012). One of these concepts consists in building a mother ship solution that can stay on-site, providing accommodation for the wind turbine maintenance and service personnel, with capacity for multiple catamaran work boats to transfer personnel out to the wind turbines. Two concepts that might give these opportunities are the Sea Wind maintenance vessel (Renewable Energy Focus, 2011) proposed by Offshore Ship Designers as illustrated in Figure 12(a) and Ulstein’s X-bow concept designed for Sea Energy PLC (The Maritime Executive, 2012) as illustrated in Figure 12(b). These solutions also support helicopter operations including transport of personnel to and from shore (Renewable Energy Focus, 2011).
(a) Sea Wind maintenance vessel. Photo: Off-shore Ship Designers
(b) Ulstein’s X-bow concept. Photo: Ulstein Group
Figure 12: Potential mother ship concepts.
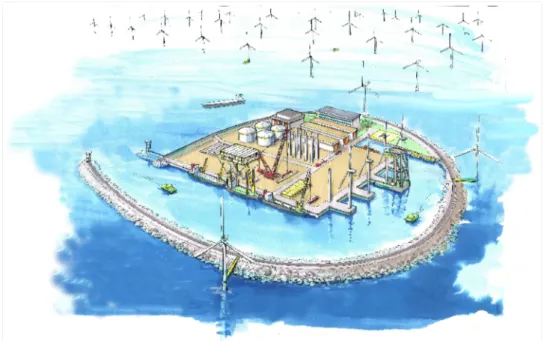
Another concept emerging is the Dutch harbour at sea, an artificial island with the purpose to reduce sailing times for installation and maintenance of the offshore wind turbines (Figure 13). The island would serve as a station for transporting, assembling and maintaining turbines, with hotel for personnel, storage of spare parts and a heliport among other things. Although the required investments in civil infrastructure are estimated to MEUR 1000, the harbour is intended to serve several offshore wind farms (Haven Eiland Duurzame Energie op de Noordzee, 2011).
13
3
Problem Description
In this section we will describe the different aspects that must be taken into account when wind farm operators want to determine an optimal fleet size and mix to execute maintenance activities for one or several offshore wind farms.
3.1
The maintenance activities
There are two different types of maintenance operations that have to be executed on an offshore wind farm: preventive maintenance operations and corrective main-tenance operations. The preventive mainmain-tenance operations are planned, and the operator will have access to a maintenance schedule for each wind turbine, which is normally based on the point in time with minimum cost of replacement for each maintenance operation, as indicated in Figure 14. However, the preventive main-tenance operations can be executed both before and after the scheduled point, but with increased cost. If a preventive maintenance operation is executed before the optimal point, this will incur costs as changing parts too often. On the other hand, if a preventive maintenance operation is delayed, this will increase the probability of failure and thus increase the expected downtime cost.
Figure 14: Preventive and corrective replacement cost. Source: ReliaSoft Corporation (2011).
In addition to the preventive maintenance operations, there are different types of unforeseen failures that can occur on each turbine throughout the planning period. The probability of each type of failure is assumed to be known, and is based on historical data for the type of turbine being used on the offshore wind farm. If a failure occurs, corrective maintenance should be executed as soon as possible to minimise the downtime costs.
3.1.1 Execution of the maintenance operations
The execution of each maintenance operation, both preventive and corrective, will consist of one or moreactivities as illustrated in Figure 15. These activities can be
divided into three groups: transport of maintenance personnel, shipment of larger parts and equipment, and lifting activities. Each activity type will normally require different vessel types. The transport of maintenance personnel can be done by a crew transfer vessel (CTV), helicopter or supply vessel. The shipment of parts requires a supply vessel or a multipurpose vessel, and heavy lifts will require a crane vessel or a multipurpose vessel.
Figure 15: Illustration of how an operation can consist of several activities with different vessel requirements
The activities concerning transportation of maintenance personnel will require a CTV or helicopter with a certain crew size. The parts and equipment that need to be shipped will have a certain weight and size, and thus require a deck load (tonnes), and deck size (m2). The activities consisting of a lift will require a crane
vessel or a multipurpose crane vessel with a certain lifting capacity (tonnes). It will take a given number of hours to execute each of the maintenance activities. However, the execution time for some of the activities requiring maintenance per-sonnel can be reduced, if the number of men working on the activity is increased from the minimum requirement. For example, the time required to re-tighten the bolts might be reduced if the size of the maintenance team is increased from two to three. On the other hand, there is a limit as to how many men that can be working on the same turbine at the same time. There is thus also a limit in the number of maintenance personnel that can work on the same activity while increasing the efficiency.
There are some preventive maintenance operations where a CTV or helicopter can have several teams working on different turbines at the same time. The CTV or helicopter drops off each team at their turbine, and picking them up when their job is done. For safety reasons not more than 4 teams should be working at different turbines at the same time. This is to allow the CTV or helicopter to have sufficient time to rescue the teams in case of bad weather or other emergencies.
3.2
Composition of the fleet
In the execution of the different maintenance activities one may have the ability to rent or acquire different types of CTVs, supply vessels, crane vessels and heli-copters. These will have a given speed, deck load, deck size and crew capacity. In addition they will have operational and safety requirements in terms of different
3.2 Composition of the fleet 15
types of weather, for instance wind speed and wave heights. If the weather condi-tions exceed one of the operational requirements of a vessel, the vessel will not be able to execute any maintenance operations. If the weather conditions exceed the safety requirement of a vessel, the vessel must return to a safe haven.
The total cost of renting or buying a vessel or a helicopter is divided into a fixed cost and a variable cost. The variable cost will depend on the number of hours in operation, and the number of hours required for transportation to and from an offshore wind farm and between wind farms. Each vessel and helicopter type can either be rented or acquired. The lengths of the contracts for the vessels and helicopters that can be rented will vary from type to type. Some might have a lease term of a couple of weeks, and others might have lease terms of several months. If a vessel is acquired, the fixed cost will be the investment cost less the salvage value depreciated over the expected life time of the wind farm.
3.2.1 Current and future maintenance fleet concepts
According to Østgren (2012), O&M Manager for Offshore Wind at the Norwegian electricity company Statkraft, there are in general three different maintenance fleet concepts that can be used when executing maintenance activities on an offshore wind farm.
The first concept, which is mostly used today, consists of an onshore harbour to which all vessels and helicopters must return by the end of the day. The second concept is based on existing technology and consists of large CTVs, supply vessels or crane vessels that can stay offshore for several periods, only returning to shore in order to fill up with supplies, bunker up or to change the crew. The safe haven will in this case be a harbour onshore. Vessels that can stay offshore for several days normally require some time in preparation in the beginning of the contracting period, in addition to some time in demobilisation in the end of the contracting period.
The third concept consists of either a mother ship or a platform located close to the offshore wind farms, to reduce the distance that needs to be undertaken by the vessels and helicopters in the execution of the maintenance activities. Such an offshore station concept will have an annual fixed cost which is the investment cost less the salvage value, depreciated over the expected life time of the wind farm. The station will be placed at a certain distance from the offshore wind farm(s), and will have capacity limits in terms of number of helicopters, supply vessels and crane vessels. An offshore station is considered as a safe haven, which means that the vessels that belong to an offshore station do not have to return to shore in case of bad weather.
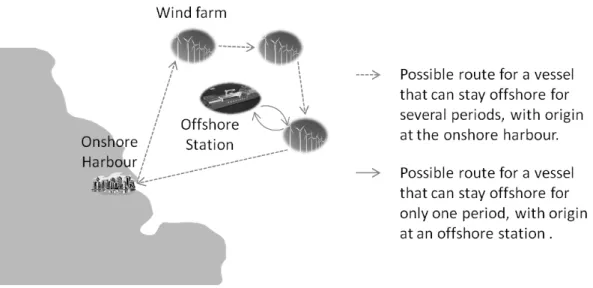
It is likely that the optimal fleet mix will be a combination of the concepts mentioned above, especially if the solution consists of a mother ship, which can not serve as a safe haven for crane vessels due to their size. Figure 16 illustrates possible routes for two different maintenance concepts. One vessel has origin at an onshore harbour and can stay offshore for several periods while the other vessel has origin at an offshore station and can thus only stay offshore for one period.
Figure 16: Example of routes for maintenance vessels with three offshore wind farms and one offshore station.
3.2.2 Adjustment of the fleet
Decisions involving acquirement or construction of new vessels, helicopters and offshore stations must be made at a reasonable time in advance of their usage. When it comes to the rental contracts an operator can, in theory, rent vessels and helicopters from the spot market on a day to day basis. This strategy is risky however, because the demand often exceeds supply in the summer months. Oper-ators therefore try to make decisions of renting vessels several months in advance of the maintenance execution. Some vessel and helicopter types can, however, be contracted right before the maintenance execution. All rental contracts are bind-ing, and the operator will only have a given budget to invest in vessels, offshore stations and helicopters.
Figure 17 illustrates the point of contracting and the periods of usage for a vessel type and a helicopter type. The vessel type can be contracted both in the beginning of year 1 and in the end of year 1 and the helicopter type can only be
3.3 Location aspect 17
contracted in the beginning of year 1. In this example one vessel is contracted in the beginning of year 1 and another in the end of year 2, both for usage in lease term 1. In addition, one helicopter is contracted in the beginning of year 1 for usage in lease term 2 and 3. In this example we have assumed that the vessel type and helicopter type have lease terms with equal lengths of 3 months.
3.3
Location aspect
The location of the offshore wind farms will determine the distance between the wind farms and the distance from each farm to the shore, and thus the time it will take to transport vessels, spare parts and maintenance personnel out to the wind farm(s) and between the wind farms. In addition, there will be a certain water depth in the area at which the wind farms are located, which will affect the types of vessels that can operate on each wind farm. The location of the wind farm(s) will have variable weather conditions in terms of wind speed and direction, wave height, wave period, wave direction, current direction and current speed.
Each wind farm will consist of a certain number of wind turbines, which are usually of the same type with the same production capacity (MW). This, in addi-tion to the wind speed, will affect the output generated from the wind farm, and thereby also the downtime cost if a turbine faces a breakdown, or if a turbine is to be shut down for maintenance operations.
3.4
Uncertainty
There are several uncertain factors affecting the optimal fleet size and mix for executing the maintenance operations on offshore wind farms. In this thesis we will take into account uncertainties in weather, vessel spot rates, electricity prices and turbine failures to allow for robust solutions that will perform well when exposed to real uncertainty.
3.4.1 Weather
The area at which the wind farms are located will have a variable wind speed in addition to wave height, wave period etc., which are all highly uncertain. The wind speed will affect the generated output of each wind farm, which is why it is important to take into account the wind speeds when determining at which point the different maintenance activities should be executed. Figure 18 shows an
approximation of the power output for a typical 5 MW wind turbine. The cut-in
speed is the minimum wind speed at which the wind turbine will generate usable
power and the rated speed is the minimum wind speed at which the wind turbine
will generate its designated rated power. Finally, the cut-out speed is the wind
speed at which the turbine is shut down for safety reasons (Puthoff and Sirocky, 1974).
Vessels and helicopters will have both operational limits and safety limits when it comes to wind speed, wave height, wave period etc. Wave heights are one of the most challenging aspects in the industry, because the vessels currently in the market cannot operate in significant wave heights of more than 2.5. If the weather conditions reach one of the operational limits of a vessel (or helicopter), the vessel will not be able to execute any maintenance activities. If the weather conditions
Figure 18: Simplified power output curve as a function of wind speed for a 5 MW Siemens wind turbine. Based on Puthoff and Sirocky (1974) and specifications from Siemens (2011).
reach one of the safety limits of a vessel, the vessel must return to a safe haven which is either shore or an offshore station dependent on the origin of the vessel.
3.4.2 Vessel spot rates
The price of a vessel contract will depend upon the spot rates in the market at the point of contracting, for the respective lease term. Short term rental of one month is generally 40 % - 60 % more expensive than a long term contract of one year (Østgren, 2012). As discussed in Section 3.2.2 some types of vessels and helicopters can be contracted close to the maintenance execution, referred to as the end of year 1 in Figure 17. The prices of these contracts will depend on the spot rates in the market at that point, and are therefore uncertain. The decision makers must therefore decide whether they should contract the vessels at a given price today, or if they should wait until a later stage, which can be favourable if the spot rates are expected to decline. They can, of course, contract some vessels today and some at a later stage.
3.4.3 Turbine failures
The number of failures each wind farm will experience is highly uncertain. A vessel fleet must thus be robust enough to handle the majority of the corrective maintenance operations as a result of failure, in addition to the planned preventive maintenance operations given from the maintenance strategy, in order to keep the availability of the wind farm at a reasonable level. The losses from one 5 MW turbine that fails to produce power can be up to EUR 12 000 per day in the UK, only from support (Section 2.2), and it should be evident that flexibility of the fleet is crucial to ensure high availability of the offshore wind farms.
3.5 Model Objective 19
3.4.4 Electricity price
The electricity price as well as the wind speeds will affect the revenue of each wind farm, or in other words, the downtime cost for wind turbines not operating. It is thus important to execute preventive maintenance activities in periods with low wind speeds and low electricity prices, when the downtime costs are low. If the wind speeds and electricity prices are expected to be low for several periods after a failure occurs on a turbine, it might be more profitable to use available vessels on more urgent maintenance activities than to get the turbine up and run-ning immediately. Wind energy producers will in addition to the electricity price receive a feed in tariff per MWh of produced power as a support for producing renewable power, which in the UK is determined each year by the government (DECC, 2011). The support mechanism for offshore wind varies from country to country. Although a certain factor in the UK, it might be an uncertain factor in other countries.
3.5
Model Objective
The FSMPOW is a strategic decision problem, in which the offshore wind farm operator must make a long term decision based on the different aspects mentioned above. The planning horizon can be one year or even longer, thus the decisions made today will make a great impact on the future economics of the offshore wind farm(s). The solution to the FSMPOW should determine the optimal combination of vessels, helicopters and offshore stations that should be rented or acquired in the given time horizon, in order to execute the preventive and corrective maintenance activities at the lowest possible cost.
21
4
Literature Review
In the field of fleet composition and routing there exists a great amount of research, especially when it comes to land based problems (Hoff et al., 2010). Our work is related to the fleet size and mix problem (FSMP) in the offshore wind industry, where the number of operation research publications has been limited so far. Con-sequently, this literature study has been divided in two. First, publications on strategic fleet planning within the maritime industry are given. This to capture similarities and variations among FSM problems being solved by operations re-search. Second, we will discuss publications focusing on O&M in the offshore wind industry today.
4.1
Strategic fleet planning
Hoff et al. (2010) states that in decision models for strategic fleet management, it will not make sense to include routing aspects at a very detailed level, unless the transportation demand is highly predictable. That being said, the authors also highlight the fact that even in a strategic setting, decisions may involve some sort of tactical aspects due to the strong dependency between fleet composition and routing. They point out that integration of routing in fleet composition decisions is warranted, but that such integration increases the computational complexity of the problem. By including uncertainty, the complexity is likely to increase even more. Their survey shows that most of the fleet composition and routing problems today are solved as some sort of a FSM problem, where the traditional FSM problem is an extension to the basic classes of routing problems (specific types of the vehicle routing problem). This implies that the fleet size and mix problem is a problem where the optimal fleet is implicitly derived by solving an underlying routing problem. This also coincides with our impression from this literature study.
Several aspects of the maritime FSM problem differ from other transportation contexts (i.e. land-based) (Pantuso et al., 2012). Hoff et al. (2010) and Chris-tiansen et al. (2004) indicate this in their surveys, and mention differences in capital costs, lead times, higher level of uncertainty and the lifetime of vessels. Earlier this was a problem due to the fact that most research was land-based, but during the last decade the interest for the maritime area has grown rapidly.
In general, for FSM problems, the major critique of today’s research can be dividend in two. First, there is a trend to analyse problems that are too idealized and far from the requirements of the real world. Second, there is a lack of treating stochastic aspects (Hoff et al., 2010).
The papers to be presented in the first part of this survey are mainly related to the maritime FSM problem and are only a selection of the papers available. However, this should give the reader a brief introduction on the field of interest within FSM problems. For a more thorough overview of the literature, the reader is referred to the literature surveys presented by Hoff et al. (2010), Christiansen et al. (2004), Ronen (1993) and Pantuso et al. (2012).
4.1.1 Maritime FSMP publications
The pioneers of fleet size problems are Dantzig and Fulkerson. Their publication from 1954 deals with minimisation of the number of navy fuel oil tankers needed to guarantee a fixed set of schedules. The problem is modified by Bellmore et al. (1968) to include a utility for each delivery, as the number of fuel oil tankers is set to insufficient. Bellmore’s problem is to maximise the sum of utilities associated with each schedule. The problem is shown to be equivalent to a transshipment problem.
A model determining the optimal number of ships to meet a given proposed task while ensuring the most profitable deployment of the fleet is presented by Bendall and Stent (2001). The idea behind the development of the model is to analyse the potential effects and savings of introducing a new high speed cargo vessel. The problem is formulated as a mixed integer problem and tested on a hub and spoke feeder service based in Singapore.
The problem of determining an optimal fleet in a real liner shipping problem along the cost of Norway, and the corresponding weekly routes for each ship is considered by Fagerholt (1999). The solution method consists of three phases, where a set partitioning problem (phase 3) is solving a set of generated routes (phase 1 and 2). The generation of routes is done with a dynamic programming algorithm. The problem studied is a fleet size problem, where the ships are given and the speed is equal for all the vessels. The solution method Fagerholt presents can also be adjusted to solve the fleet composition problem.
A new solution method for handling ships with different speeds is proposed by Fagerholt and Lindstad (2000). This solution algorithm is developed as a request from a Norwegian oil company, with the purpose of determining an optimal policy for the scheduling of supply vessels servicing a number of offshore installations from an onshore depot. A given vessel pool is used, which means that the model does not take into account the possibility of acquiring new vessels. Anyhow, the research show potential annual savings of $7 million in comparison with the solution used at that time.
Fagerholt (2001) considers another interesting subject when combining ship scheduling with soft time windows. Fagerholt introduces soft time windows in-stead of hard time windows to allow controlled window violations. The soft time windows, according to Fagerholt’s finding, gives the possibility to obtain better schedules and significant reductions in the transportation costs.
Zeng and Yang (2007) present in the paper Model integration Fleet Design and
Ship Routing Problems for Coal Shipping an integer programming model for solving
both the fleet design and ship routing for a large Chinese coal corporation. The dependency between the fleet design and the ship routing is captured and solved by using a two phase tabu search algorithm on the IP model. In the numerical results presented, improvements in the coal shipping efficiency are indicated by using the proposed model.
A study of resource management for a merchant fleet is addressed in a paper by Pesenti (1995). Pesenti discusses and presents a problem involving decisions on purchase and usage of ships to meet customers’ demand. A model for the considered problem is developed as a hierarchical model, and heuristic techniques which solve the problems at different decision levels are described.
4.2 Operation and Maintenance Publications 23
In the article Robust Supply Vessel Planning, Halvorsen-Weare and Fagerholt
(2011) address the problem of creating robust schedules to the supply vessel plan-ning problem, which is undertaken by Halvorsen-Weare et al. (2012). The original problem is a maritime transportation problem in which a set of offshore instal-lations require supplies from an onshore supply depot, a service performed by a fleet of offshore supply vessels. Before Halvorsen-Weare and Fagerholt (2011) incorporate robustness, a planning tool based on the deterministic supply vessel planning problem is implemented for real life use and indicate savings of MUSD 3. When robustness considerations are tested, meaning that solutions are capable to allow for unforeseen events, the results show even higher potential improvements in terms of costs.
4.1.2 FSMP publications addressing uncertainty
The number of publications utilising a stochastic optimisation approach in order to address the issue of uncertainty are to the authors knowledge limited, particularly within shipping. This coincides with the literature surveys by Alvarez et al. (2011) and Verderame et al. (2010). Most of the literature address deterministic fleet size and mix models, where a sample of the publications are to be found in the previous subsection.
Among the few papers including uncertainty, Alvarez et al. (2011) propose a mixed integer programming (MIP) model of the multi-period fleet sizing and deployment problem. Their model is developed to assist companies in risk handling within the trading process of ships (e.g. buying, chartering or selling), as well as the deployment of active ships to contracts and geographic markets.
List et al. (2006) illustrate how a robust optimisation model can be used to explore the effects of uncertainty on an equipment acquisition strategy within a fleet size problem. In their model, certain risk terms are introduced to hedge against scenarios that have a high total cost. This is, according to the authors, significantly different from the standard stochastic programming solution for this problem.
Du and Hall (1997) present an inventory-theoretic model to minimise the fleet size required to achieve a specified stock-out probability on trucks. The basis for their model is a hub-and-spoke transportation network with stochastic demands for shipments between the center hub and the outlying terminals.
Dong and Song (2009) consider the joint container fleet sizing and empty con-tainer repositioning problem in multi-vessel, multi-port and multi-voyage
ship-ping systems with dynamic, uncertain and imbalanced costumer demands. A
simulation-based optimisation tool is developed to find the vessel fleet size and the empty container repositioning.
4.2
Operation and Maintenance Publications
There are few authors addressing the problems with logistics and vessel utilisa-tion/mix in the maintenance of offshore wind farms. Van Bussel and Bierbooms (2003) point out that the ability to maintain offshore wind turbines highly depends upon the access system being used. By using Monte Carlo simulations they esti-mate the availability of the DOWEC offshore wind farm. Their research addresses
aspects affecting the availability, one of them is the problem of being too optimistic on the accessibility of offshore wind farms compared to onshore wind farms. Fur-ther, they argue that the changing weather conditions are one of the main issues reducing the accessibility. The main conclusions are that onshore availability levels are not feasible for remote offshore locations, and that new vessel types are needed for handling rougher weather conditions in order to increase the availability to an acceptable level. In the simulations, a given number of vessels is taken as input and must be changed manually. This reduces the ability of the model to determine the optimal number and combination of vessel types.
Van Bussel (1999) present, what the author calls, an expert system for cal-culating the assessment of offshore wind farm availability and the related O&M costs. The developed system uses an onshore wind turbine as starting point and calculates the offshore availability as a function of distance to shore, average storm percentage and the amount of money to be spent on maintenance. The calcula-tions assume the use of a vessel traveling at the speed of 10 km/hour. In other words the system does not account for variation in vessel types or the uncertain weather conditions.
In the article Operation and Maintenance Aspects of Large Offshore Wind
farms, Van Bussel and Schöntag (1997) analyse the O&M process for a large
offshore wind farm trying to identify ways to reduce O&M related costs. They evaluate the use of new vessel types, the use of offshore platforms and alternative windmill designs. They use a Monte Carlo simulation to calculate the availabil-ity of the wind farm, and conclude that this simulation tool is of great value for the optimisation of O&M strategies. Also in this paper the authors leave out the determination of the optimal fleet size and mix for the execution of maintenance operations, as a fixed number of vessels is given as input to the simulation model. Rademakers et al. (2008) describe an interesting O&M support tool developed to lower the O&M costs of offshore wind farms. The support tool is developed in an Excel environment using Visual Basic and uses long term average data to generate long term average values as output. It does not consider any logistic aspects. Some of the users of the model concluded that the tool represents the state-of-the-art.
All the references above use different types of simulation tools to analyse O&M of offshore wind farms. One publication using operations research is the arti-cle by Besnard et al. (2009). The artiarti-cle describes an opportunistic maintenance optimisation model for offshore wind systems, with the purpose of reducing the overall maintenance costs. The model is developed to help the maintenance man-agers decide when to execute preventive maintenance. It uses the advantage of wind forecasts and corrective maintenance tasks to perform preventive mainte-nance tasks at low costs. The authors demonstrates that this makes it possible to save major maintenance costs. The problem with logistics and transportation is mentioned as a future extension of the model, meaning implicitly that the model does not consider the fleet size and mix problem.
Except for this last article described there seems to be a lack of operations research models developed for the offshore wind industry regarding O&M. There are OR models developed for the optimal design of wind turbines, see Andrawus et al. (2007), but these are outside the scoop of this thesis.
4.3 Remarks 25
4.3
Remarks
While knowing that operations research is a good means to achieve both effective and efficient maintenance in general (Dekker, 1996), the utilisation has, in the offshore wind industry, been limited so far. By this absence we can conclude that there is a great potential for operation research methods within the offshore wind industry. Our contribution, by analysing the FSMPOW, will put light on some of the problems within the industry today. In the next section we will present a deterministic model for solving the FSMPOW and in Section 6 we will present a stochastic node formulation of the FSMPOW, where we take into account the inherent uncertainties of the problem.