1Scientific Bioinformatics Platform, Berlin Institute for Medical Systems Biology, Max Delbr ¨uck Center for Molec-ular Medicine, Berlin, 13125, Germany
Abstract
Single cell RNA-seq (scRNA-seq) experiments suffer from a range of characteristic technical biases, such as dropouts (zero or near zero counts) and high variance. Current analysis methods rely on imputing missing values by various means of local averaging or regression, often amplifying biases inherent in the data. We present netSmooth, a network-diffusion based method that uses priors for the covariance structure of gene expression profiles on scRNA-seq experiments in order to smooth expression values. We demonstrate that netSmooth improves clustering results of scRNA-seq experiments from distinct cell populations, time-course experiments, and cancer genomics. We provide an R package for our method, available at:
https://github.com/BIMSBbioinfo/netSmooth
.Keywords
scRNA-seq, single-cell, genomics, imputation, networks
Introduction
Single cell RNA sequencing (scRNA-seq) enables profiling of single cells’ transcriptomes at unprecedented through-put and resolution. It has enabled previously impracti-cal, studies of cell type heterogeneity, differentiation, and developmental trajectories[1]. However, the adaptation of RNA sequencing techniques from bulk samples to sin-gle cells did not progress without challenges. Typically, only a fraction of a cells transcriptome may be captured by the experiment, leading to so called "drop-out" events where a gene gets a false 0 (or near 0) count in some cell. The dropout rate is related to the population level expres-sion of a gene leading to many false zero counts for lowly expressed genes, and artificially low counts for highly ex-pressed ones[2]. Furthermore, the drop-out rate could be related to the biology of the cell type, as some cell types transcribe fewer genes than others, which will appear as drop-out events[2]. When summed over many samples, transcript counts from single cells resemble those of bulk experiments[3], but across individual cells there is signif-icant variation. This makes analysis more difficult than in bulk RNA sequencing experiments.
Computational methods designed to deal with these is-sues treat dropout events as missing data points, whose values may be imputed based on non-missing data points (observed measurements). The proportion of 0 counts per gene, a proxy for its technical dropout rate, is a function of the population-wise mean expression of that gene[4, 2]. This observation has led researchers to treat 0 counts as dropout candidates to be imputed.
CIDR [5] attempts to impute missing values based on the predicted mean expression of a gene, given its em-pirical dropout rate (0-count). scImpute[6] estimates dropout likelihoods per gene and per sample, and assigns each gene in each sample a status as a dropout candi-date. Genes might be considered likely dropouts even with nonzero expression, and 0-count genes might not be considered likely dropouts, based on their population-wide expression distributions. It then uses a regularized linear model to predict the expression of dropout genes based on the expression of likely non-dropouts in all other cells. MAGIC[7]performs local averaging after building a topological graph of the data, updating the expression value of all genes in all cells to their local neighborhood average.
All of the methods mentioned above use measured formation in the data in order to impute the missing in-formation within the same data. As such, they amplify whatever biases are present in a dataset; similar cells pre-imputation will become more similar after pre-imputation, as expression profiles of non-dropout genes will drive simi-larities in imputed dropped-out genes. Further, all meth-ods except MAGIC only impute unobserved expression events (0s or near 0s), while the dropout phenomenon actually affects the whole transcriptome. Hence, imputa-tion methods for scRNAseq should also adjust non-0 ex-pression measurements in order to recover the true signal. We present a method, callednetSmooth, that uses prior knowledge to temper noisy experimental data. RNA
se-quencing experiments produce counts data as a proxy for gene activity, which is not known a-priori, especially for experiments profiling unknown cell types. However, decades of molecular biology research have taught us much about the principles of gene interaction. Interact-ing genes are likely to be co-expressed in cells [8, 9], and as such, protein-protein interaction (PPI) databases [10, 11]describe genes’ propensity for co-expression. We developed a graph-diffusion method on PPI networks for smoothing of gene expression values. Each node in the graph (a gene) has an associated gene expression value, and the diffusion presents a weighted averaging of gene expression values among adjacent nodes in the graph, within each cell. This is done iteratively until conver-gence, strengthening co-expression patterns which are ex-pected to be present. Incorporation of prior data from countless experiments in the preprocessing of scRNA-seq experiments improves resistance to noise and dropouts. Similar network based approaches have been used to ex-tract meaningful information from sparse mutational pro-files[12, 13], and indirectly on gene expression data by diffusing test statistics on the network to discover regu-lated gene candidates[14]. We propose diffusion of gene expression values directly on the network as a method for data denoising and imputation. Furthermore, the param-eters of this proposed method could be optimized using clustering robustness metrics. We applied our method to a variety of single cell experiments and compared its per-formance to other selected imputation methods scImpute and MAGIC. These methods represent the latest and di-vergent ways of imputing the scRNA-seq data.
We also made available an R package providing the necessary functionality to use our method on other data. It is available on GitHub:
https://github.com/
BIMSBbioinfo/netSmooth
.Results
Overview of the method
The intuition behind thenetSmoothalgorithm is that gene networks encoding co-expression patterns can be used to smooth scRNA-seq data, pushing its coexpression patterns in a biologically meaningful direction. We demonstrate this using protein-protein interaction networks, which are predictive of coexpression[9]. We produced a PPI graph of high-confidence interactions based on the PPI database STRING[10].
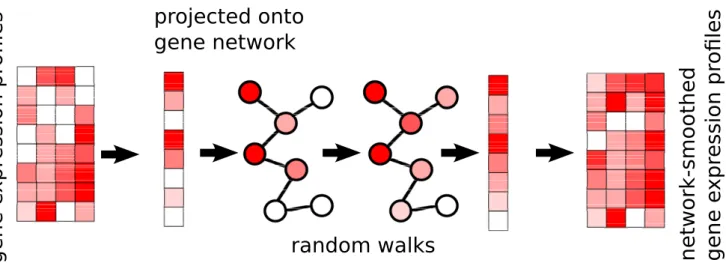
There are 2 inputs to the method: (1) a gene expression matrix,Ngenes byM cells, and (2) a graph where genes are nodes, and edges indicate genes which are expected to be co-expressed. The edges may be weighed, indicating the strength or direction of a relationship; an edge weight of 2 indicates stronger expected co-expression than an edge weight of 1, and an edge weight of−1 indicates neg-ative expected co-expression, such as one gene being a repressor for another. The expression profile of each cell is then projected onto the graph, and a diffusion process is used to smooth the expression values, within each sam-ple, of adjacent genes in the graph (Figure 1). In this way, post-smoothing values of genes represent an estimate of
affect their neighbors less than genes with more specific interactions. The diffusion is done using a "random walks with restarts" (RWR) process [13], where a conceptual random walker starts in some node in the graph, and at each iteration moves to a neighboring node with a proba-bility determined by the edge weight between the nodes, or, with some probability, restarts the walk from the orig-inal node. Thenetwork-smoothedvalue is the stationary distribution of this process. The RWR process has one free parameter, the restart rate. A low value for the restart rate allows diffusion to reach further in the graph; a high restart rate will lead to more local diffusions. For more details see the Methods section.
Network smoothing improves cell type identifi-cation from single-cell RNA-seq
We first assess netSmooth on a dataset of 1645 mouse hematopoietic stem/progenitor cells (HSPCs) assayed us-ing flow cytometry as well as scRNA-seq[15]. The cells are FACS-sorted into 12 common HSPC phenotypes. This presents an atlas of the hematopoiesis process at a single cell resolution, showing the differentiation paths taken by E-SLAM HSCs as they differentiate to E, GM, and L progenitors. The authors of this study demonstrate that upon clustering the data, some clusters corresponds to cell types. However, the clusters are not noise free and do not fully recapitulate cell type identity. We obtained cluster-ings of the cells from the normalized counts, as well as after application ofnetSmooth, MAGIC[7], and scImpute [6], using a robust clustering procedure based on the
clus-terExperimentR package[16](See Methods). After
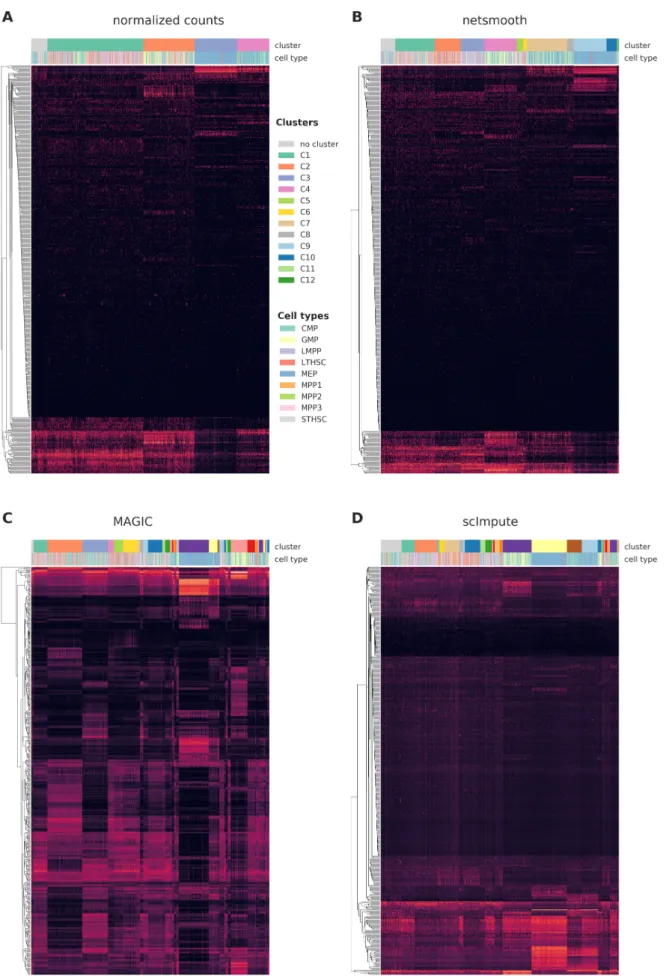
clus-tering, we used the edgeR-QLF test[17]to identify genes that are differentially expressed in any of the discovered clusters. Figure 2a,b shows that after network-smoothing, we are able to identify clusters with a more pronounced differential expression profile. Further, many more of the genes identified as differentially expressed between the clusters (without smoothing) seem to have low and unin-formative expression values overall. MAGIC and scImpute also improve this pattern (Figure 2c,d). MAGIC seems to do the strongest transformation to the data, as seen in lower dimension embeddings (Figures S2, S3).
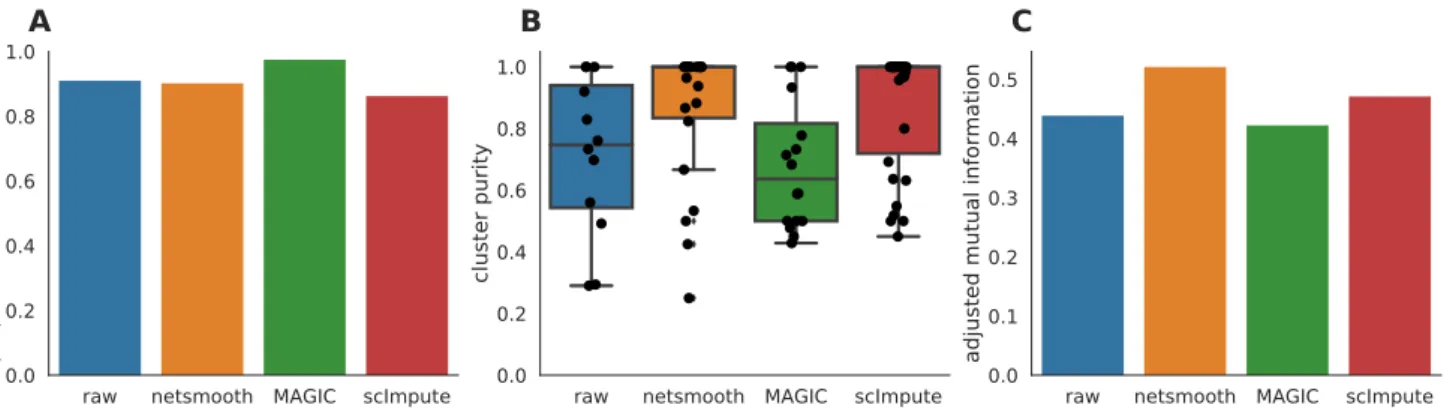
As this dataset has cells with labels independent of the RNAseq (FACS-sorted phenotypes), it presents us with an opportunity to compare the gene expression levels (as measured by RNAseq), to a meaningful phenotypic variable, i.e. the cell type. The cell type discrimination of a clustering result is compared using a cluster purity metric and and the adjusted mutual information (AMI). The cluster purity measures how cell-type specific clus-ters are by comparing homogeneity of the external la-bels (FACS-defined cell types), within clusters provided
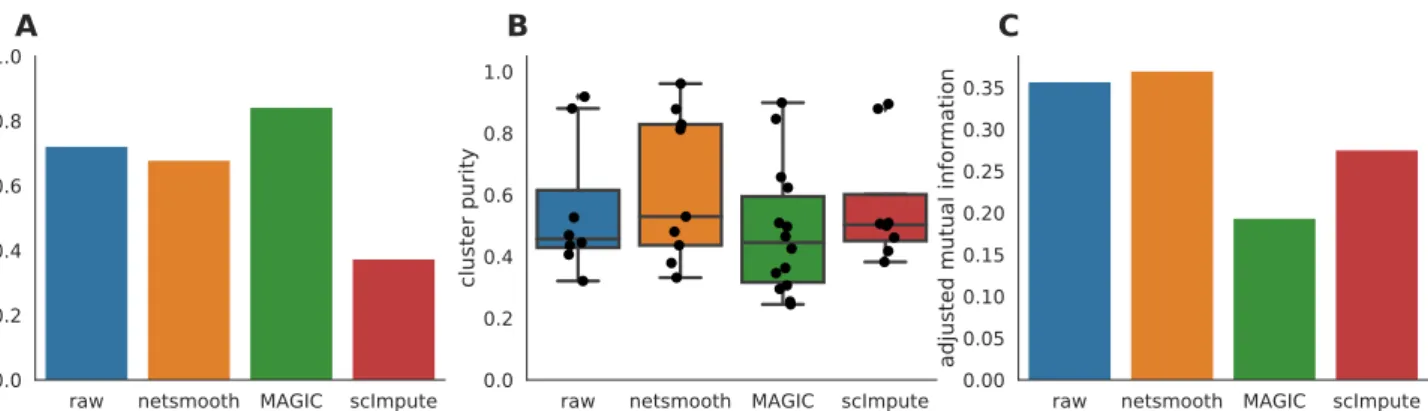
cedure allows cells to be omitted (not be assigned to a cluster) if they cannot be placed in a cluster across mul-tiple clustering methods and/or parameters (See Meth-ods). Only MAGIC is able to increase the proportion of cells in this dataset which fall into robust clusters (Fig-ure 3a), but only netSmooth leads to more biologically meaningful clusters, in terms of purity and AMI (Figures 3b,c), demonstrating thatnetSmoothcan assist in cell type identification, and outperformed both MAGIC and scIm-pute in this task. The higher clusterability following ap-plication of MAGIC thannetSmooth, might indicate that MAGIC was overzealous in its transformation, squeezing more cells into the same space. This might lead to more robust clusters, but less reliable cell type identification.
Network smoothing improves capture of devel-opmental expression patterns
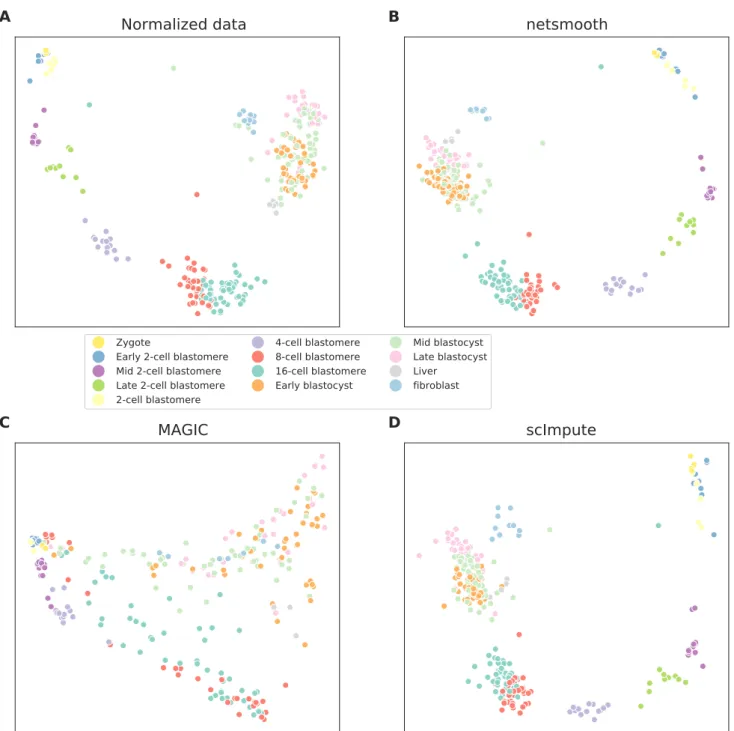
Next, we testnetSmoothon 269 isolated cells from mouse embryos at different stages of pre-implantation develop-ment between oocyte and blastocyst, as well as 5 liver cells and 10 fibroblast cells[18]. The authors of this study demonstrated that lower dimension embeddings capture much of the developmental trajectory (Figure 4a, S5a, Figure S4a). We then applied netSmooth, MAGIC, and scImpute. Figure 4b shows the principal component anal-ysis ofnetSmooth-processed data, and Figures 4c and 4d show the PCA plot following application of MAGIC and scImpute, respectively.netSmoothand scImpute preserve most of the variance structure of the data, while MAGIC seems to push the data onto a completely different mani-fold (Figure 4, Figure S5). We used the robust clustering procedure to obtain clusters, and computed the cluster purity and AMI metrics. netSmooth enabled the cluster-ing procedure to place more of the samples into robust clusters (Figure 5a), and as in the hematopoiesis case,
netSmoothis able to assist in identifying the
developmen-tal stage or tissue that cells belong to better than the other methods, as evidenced by the higher cluster purities (Fig-ure 5b) and AMI (Fig(Fig-ure 5c). Although MAGIC and scIm-pute reduce the 0-count genes further than netSmooth (Figure S1), they do not add as much clarity to the de-velopmental stage signal inherent in the data. This shows that imputing missing counts based on data from the same experiment is not as powerful as including priors in the quasi-imputation processnetSmoothdoes.
Network smoothing improves identification of glioblastoma tumors
Finally, we demonstrate applicability ofnetSmoothto can-cer research. Patel et al. generated scRNA-seq data of 800 cells from 5 glioblastoma tumors and 2 cell lines [19]. Lower dimension embedding plots show that cells from
random walks
projected onto
gene network
network
-smoothed
gene e
xpr
ession pr
o
fi
les
gene e
xpr
ession pr
o
fi
les
Figure 1.ThenetSmoothalgorithm takes a gene expression profile, and a gene network. The expression profile of each sample is projected onto the network, where a diffusion process allows genes’ expression values to be smoothed by their neighbors’. This is done for each cell independently of others. The end result is a network smoothed gene expression matrix.
different tumors or cell lines generally group together, but some are not wholly distinguishable from other tumors (Figure 6a, S7a, S6a). Further, the two cell lines group closer to each other than the other patient samples. Af-ter applyingnetSmoothto the data, tumors become eas-ier to distinguish in a lower dimensional embedding (Fig-ure 6b), indicating thatnetSmoothimproves assignment of each cell to its tumor, cell line, or clone of origin. Again, scImpute also leads to similar reduced dimension embed-ding (Figure 6d), while MAGIC distorted the data more than the other methods (Figure 6c). We used the robust clustering procedure before and afternetSmooth, MAGIC, and scImpute. Only MAGIC increase the clusterabitliy of the data (Figure 7a), butnetSmoothleads to the most pure clusters, in terms of tumor or cell line of origin (Figure 7b, Figure 7c).
Tumor or cell line of origin is an imperfect proxy for phe-notypical variation in cancer cells, because some cells cluster by cell type rather than tumor of origin, demon-strating the heterogeneity in these glioblastoma tumors and similarities across origins [19]. Nevertheless, we chose to compute cluster purity based on the cell origin rather than other labels which might be assigned to them, as it is the onlyground truthvariable that is independent of the RNAseq experiment. Further, cells do group by ori-gin (Figure 6, Figure S6), and identification of oriori-gin is an interesting question in its own right in the field of cancer genomics, particularly for heterogeneous tumors such as these.
Sensitivity to the network
Next, we set out to ensure that the results are not an arti-fact of the network structure, i.e. that the actual links be-tween genes that we used in the network are important. We expectnetSmoothnot to perform well when using net-works with similar characteristics, but where edges do not represent real interactions. To that effect, we constructed 20 random networks by keeping the same graph struc-ture of the real PPI graph, but shuffling the gene names.
Thus, these random networks share all the characteris-tics of the real network (degree distribution, community structure), except for the true identity of the nodes. We then used those networks as inputs tonetSmoothand ran the benchmarks as before on the hematopoiesis dataset. Using random networks as an input tonetSmooth gives cluster purities distributed around a mode given by the cluster purities of the raw data, while the cluster purities given from using the real PPI network lie at the extreme edge of the distribution (Figure 8a). Further, most ran-dom networks result in fewer samples belonging to ro-bust clusters (Figure 8b). These results demonstrate that it is indeed the information contained in the PPI graph enables netSmooth to transform the gene expression ma-trix in a more biologically coherent direction, and that the transformation we see can not be explained simply by the network structure.
Using other networks with netSmooth
In addition to using an unweighed (where all edge weights are 1), undirected (where all edge weights are positive) network from string-db, we constructed other gene networks and used them as inputs tonetSmooth. We created a directed gene network from only those edges in string-db which are marked as activating or inhibit-ing1. We set the edge weights of the activating interac-tions to +1, and −1 for the inhibiting interactions, al-lowing gene expression values to be adjusted downwards for genes whose known antagonists are highly expressed. After smoothing, we set all negative smoothed expres-sion values to 0. We also constructed a gene network from string-db using only genes that are known to demon-strate cell-type specific expression. In order to obtain a list of genes with such cell-type specific expression patterns from the Expression Atlas[20], we used only the genes which show a cell-type specific expression with a mean
1Most interactions in string-db do not specify the direction, or nature
Figure 2.Cells were clustered using the robust clustering procedure, and the 500 most differentially expressed genes (by edgeR-QLF test adjusted P value) in any of the discovered clusters are shown in a heatmap, as well as cluster assignments and FACS-sorted cell types. A) raw (no imputation), B) after application ofnetSmooth, C) missing values imputed using MAGIC D) missing values imputed using scImpute.
raw netsmooth MAGIC scImpute 0.0 0.2 0.4 0.6 0.8 1.0
pro
po
rti
on
in
ro
bu
st
clu
ste
rs
Araw netsmooth MAGIC scImpute 0.0 0.2 0.4 0.6 0.8 1.0
clu
ste
r p
uri
ty
Braw netsmooth MAGIC scImpute 0.00 0.05 0.10 0.15 0.20 0.25 0.30 0.35
ad
jus
ted
m
utu
al
inf
orm
ati
on
CFigure 3. A) The proportion of cells which were assigned to robust clusters. B) cluster purity (proportion of dominant cell type) for the robust clusters.netSmoothproduces the most pure clusters in terms of cell types. C) AMI of the clustering results obtained after application of each of the methods. OnlynetSmoothincreases the AMI between the clustering and the cell types.
TPM of at least 1 in some cell type, and used the subset of string-db network containing those genes as an input to
netSmooth. Both of those modified graphs perform
sim-ilarly to the undirected graph from string-db (Figure 9, Figure S8a, Figure S8b), demonstrating thatnetSmoothis able to use priors from different types of experiments in order to improve clustering of scRNA-seq.
We also considered other sources for the gene network. We constructed a gene network from HumanNet [21], a functional gene network where edges denote interac-tions between two genes. We constructed a smoothing graph by taking all edges from HumanNet, and produc-ing a graph where all edge weights are set to 1. We then used this graph as an input to netSmooth on the glioblastoma dataset. It performs similarly to the net-work from string-db (Figure 10, Figure S8c), demonstrat-ing that other sources for gene interactions may also be used bynetSmoothto improve clustering results of scRNA-seq.
Optimizing the smoothing parameters by clus-ter robustness
ThenetSmoothalgorithm, given a gene network, has one
free parameter - the restart rate of the random walker,
(1−α). Alternatively,αis the complement of the restart rate. Anα=0 indicates a perfect restart rate and conse-quently no smoothing; anα=1 corresponds to a random walk without restarts. Intermediate values forαresult in increasing levels of smoothing; the value ofαdetermines how far random walks will go on the graph before restart-ing, or how far along the network a gene’s influence is al-lowed to reach (See Methods). It is tempting to optimize
αwith respect to the variable the experiment sets out to measure, e.g. cluster purity. For instance, in the embry-onic development dataset, we would chooseα= 0.7 as the value that produces the highest cluster purity (Figure 11b). However, in many experiments the identity of the samples is not known a-priori. Therefore, we propose a data driven workflow to pick a sensible value forα. One such data-driven statistic is the proportion of sam-ples assigned to robust clusters; following application of
netSmooth, the robust clustering procedure is able to
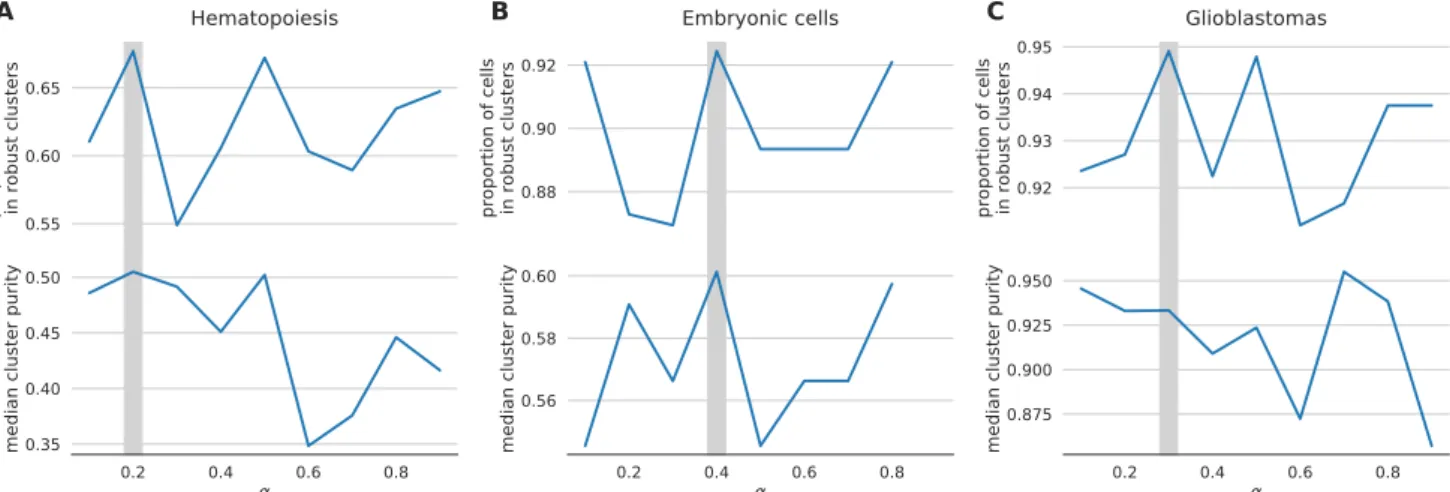
as-sign more samples to statistically robust clusters. For all three datasets, picking the αthat gives the highest pro-portion of cells in robust clusters, also gives the clusters with the highest purity index (Figure 12). Importantly, this metric is entirely data-driven and does not require ex-ternal labels, making it feasible for any scRNA-seq study. The results in the previous sections all use the value ofα picked to optimize proportion in robust clusters.
Discussion
Single cell RNA sequencing technology provides whole-genome transcriptional profiles at unprecedented throughput and resolution. However, high variance and dropout events that happen in all current scRNA-seq platforms complicate the interpretation of the data. Methods that treat 0 counts as missing values and impute them based on nonzero values in the data may amplify biases in the data.
We presented netSmooth as a preprocessing step for scRNA-seq experiments, overcoming these challenges by the use of prior information derived from protein-protein interactions or other molecular interaction networks. We demonstrated that network smoothing assists in several standard analyses that are common in scRNA-seq stud-ies. This procedure enhances cell type identification in hematopoiesis; it elucidates time series data and assists identification of the developmental stage of single cells. Finally, it is also applicable in cancer, improving identifi-cation of tumor of origin for glioblastomas. In addition, we showed that network smoothing parameter can be op-timized by cluster robustness metrics, providing a work-flow when there are no other external labels to distinguish cells. We demonstrated thatnetSmoothcan use prior in-formation from different sources in order to achieve this. We compared netSmooth with scImpute, a statistical wide imputation method, and MAGIC, a genome-wide data smoothing algorithm, and demonstrated that while scImpute and MAGIC reduce the drop-out phe-nomenon more thannetSmoothdoes,netSmooth outper-forms them in amplifying the biological/technical
vari-A
Zygote
Early 2-cell blastomere
Mid 2-cell blastomere Late 2-cell blastomere 2-cell blastomere 4-cell blastomere 8-cell blastomere 16-cell blastomere Early blastocyst Mid blastocyst Late blastocyst Liver fibroblast B C D
Normalized data
netsmooth
MAGIC
scImpute
Figure 4. 2D PCA plots of the embryonic development dataset A) no preprocessing, B) after application of
raw netsmooth MAGIC scImpute 0.0 0.2 0.4 0.6 0.8 1.0
pro
po
rti
on
in
ro
bu
st
clu
ste
rs
Araw netsmooth MAGIC scImpute 0.0 0.2 0.4 0.6 0.8 1.0
clu
ste
r p
uri
ty
Braw netsmooth MAGIC scImpute 0.0 0.1 0.2 0.3 0.4 0.5 0.6
ad
jus
ted
m
utu
al
inf
orm
ati
on
CFigure 5. The Embryonic development dataset. A) The proportion of cells which were assigned to robust clus-ters. All three methods lead to better clusterability, with MAGIC having the strongest effect. B) cluster purity (proportion of dominant cell type) for the robust clusters.netSmoothproduces the most pure clusters in terms of cell types. C) Adjusted mutual information of clusterings and cell types. OnlynetSmoothincreases the AMI over the non-preprocessed data.
ability ratio. netSmooth provides clusters that are more homogeneous and have higher adjusted mutual informa-tion (AMI) with respect to cell types. Although, in some cases data processed by MAGIC produces more robust clusters, the clusters returned after MAGIC processing do not have higher AMI or cluster purity. Higher robustness achieved by MAGIC processing might be due to the fact that the algorithm reinforces local structures too much in the data and producing artificially similar expression pro-files between cells.
Finally,netSmoothis a versatile algorithm that may be in-corporated in any analysis pipeline for any experiment where the organism in question has a high quality PPI network available. Although not shown, the algorithm is applicable to any omics data set that can be constructed as a genes-by-samples matrix, such as proteomics, SNPs and copy number variation. In addition, most of the com-putational load of network smoothing can be done "off-line". As such it scales well with the number of cells, which is likely to increase in future scRNA-seq experi-ments. We have made available an R package to that end, which is available on GitHub:
https://github.com/
BIMSBbioinfo/netSmooth
.Methods and data
The data setsThe hematopoiesis dataset [15] was obtained from the Gene Expression Omnibus [22]. The embryonic [18] and glioblastoma[19]datasets were obtained from con-quer[23], a repository of uniformly processed scRNA-seq datasets.
The random walks with restarts process
ThenetSmoothalgorithm takes a graphG = {V,E}where
V = {g enei}is the set of genes, and E = {(i → j)}
is the set of edges between genes. The edge weights are degree-normalized, so that each gene’s outgoing edges’ weights sum to 1. We then define a process of random walk with restarts as in[13], on the PPI graph, where a
conceptual random walker starts on a node in the graph (a gene/protein) and at each step walks to an adjacent node with the probability determined by theαtimes the edge weight. Further, at each step, there is a probability of(1−α)that the walker restarts to its original node. Mathematically, given a graph defined by an adjacency matrixA[M x M], whereAi jis the edge weight between gene iand genej(and 0 for unconnected genes), and a vector
f[M x1], where ft
i is the probability that the walker is at nodeiat stept, the process is defined by
ft+1=αAft+ (1−α)f0.
This process is convergent, and the stationary distribution is given by
f∞= (1−α)(I−αA)−1f0.
Hence, the random walk with restarts process is a diffu-sion process defined on the PPI graph, or through the dif-fusion kernel (smoothing kernel)
KAα= (1−α)(I−αA)−1
where (1−α) is the restart probability, and A is the (column normalized) adjacency matrix of the PPI graph. Consequently, we define thenetwork-smoothedexpression profile
Esm=KAαE,
where E[M x N] is the normalized count values of the M genes in theNcells.
The clustering procedure
Clustering analysis features prominently in scRNA-seq analyses; whether recapitulating known results or discov-ering new cell types, clustdiscov-ering cells by their gene expres-sion profiles is commonly used to identify distinct popula-tions. While some approaches directly take into account the zero-inflation of scRNA-seq data[5], other studies use traditional methods[18]. There is no standard method
A
cell line: CSC6
cell line: CSC8 patient id: MGH26patient id: MGH28 patient id: MGH29patient id: MGH30 patient id: MGH31 B
C D
Normalized data
netsmooth
MAGIC
scImpute
Figure 6. t-SNE plots of the glioblastoma dataset A) no preprocessing, B) after application of netSmooth, C), using MAGIC, and D) after application of scImpute.
raw netsmooth MAGIC scImpute 0.0 0.2 0.4 0.6 0.8 1.0
pro
po
rti
on
in
ro
bu
st
clu
ste
rs
Araw netsmooth MAGIC scImpute 0.0 0.2 0.4 0.6 0.8 1.0
clu
ste
r p
uri
ty
Braw netsmooth MAGIC scImpute 0.0 0.1 0.2 0.3 0.4 0.5
ad
jus
ted
m
utu
al
inf
orm
ati
on
CFigure 7.Imputation performance for the glioblastoma dataset. A) The proportion of cells which were assigned to robust clusters. netSmooth, MAGIC, and scImpute all increased the proportion of cells that are assigned to robust clusters, with MAGIC leading,netSmooth in second place, and scImpute in third. B) cluster purity (proportion of dominant cell type) for the robust clusters.netSmoothproduces the most pure clusters in terms of tumor or cell line of origin. C) AMI of the clustering results obtained after application of each of the methods.
0.30 0.35 0.40 0.45 0.50 0.55 0.60 0.65 0.70
median cluster purity
de
ns
ity
A
0.45 0.50 0.55 0.60 0.65 0.70 0.75 0.80
median proportion in robust clusters
B random networks real network without netsmooth
Figure 8. Performance ofnetSmoothwith randomized networks. A) The median cluster purity achieved with the random networks. The real network outperforms the random ones, which result in cluster purities distributed around the purity given without usingnetSmooth. B) The proportion of samples assigned to robust clusters using the random networks as well as the real one. While all networks result in fewer samples robustly clustered (in the hematopoiesis dataset), the real network outperforms most random networks.
raw
non-directional
directional cell-type
specific
0.0
0.2
0.4
0.6
0.8
clu
ste
r p
uri
ty
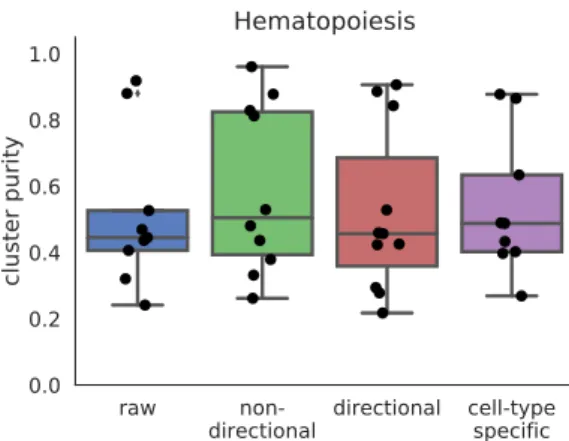
Figure 9. Cluster purities after applying netSmooth
with different input networks. Raw refers to no smoothing, non-directional is the same as the re-sults shown in previous sections. Directional refers to a gene network where inhibitory relationships have negative edge weights, and cell-type specific refers to a gene network of only genes which are known to have cell-type specific expression patterns.
raw
string-db
HumanNet
0.0
0.2
0.4
0.6
0.8
1.0
clu
ste
r p
uri
ty
Glioblastoma
Figure 10. Cluster purities after applyingnetSmooth
with different input networks. Raw refers to no smoothing, string-db is the same as the results shown in previous sections, and HumanNet refers to a gene network constructed from the HumanNet database.
consensus clustering of clustering assignments obtained from different clustering algorithms, different parameters for these algorithms, and different views of the data. The different views are different reduced dimensionality pro-jections of the data based on different techniques. Thus, no single clustering result will dominate the data, and only cluster structures which are robust to different anal-yses will prevail. The procedure we implemented using the framework is as follows:
1. Perform different dimensionality reduction tech-niques on the data
• PCA on the 500 most variable genes
– with 5 components
– with 15 components
– with 50 components
• Alternatively to PCA, t-SNE on the 500 most variable genes
– with 2 dimensions
– with 3 dimensions • Select the most variable genes
– 100 most variable genes
– 500 most variable genes
– 1000 most variable genes
2. On each reduced dimension view of the data, per-form PAM clustering with K ranging from 5 to 10 3. Calculate the co-clustering index for each pair of
samples (the proportion of times the samples are clustered together, in the different clustering results based on the different reduced dimensions and clus-tering parameters above)
4. Find a consensus clustering from the co-clustering matrix. This is done by constructing a dendrogram using average linkage, and traversing down the tree until a block with a self-similarity of at least 0.6, and a minimum size of 20 samples emerges. (instead of using
cutree
).5. Perform hierarchical clustering of the cluster medioids, with similarities based on expression of the 500 most variable genes
6. Perform a DE analysis between clusters that are adja-cent in the hierarchy from (5), and merge them if the proportion of genes that are found to be significantly differentially expressed between them (adjP<.05) is less than than 0.1.
0.0 0.1 0.2 0.3 0.4 0.5 0.6 0.7 0.8 0.9 α 0.2 0.4 0.6 0.8 1.0
clu
ste
r p
uri
ty
Hematopoiesis
A 0.0 0.1 0.2 0.3 0.4 0.5 0.6 0.7 0.8 0.9 αEmbryonic cells
B 0.0 0.1 0.2 0.3 0.4 0.5 0.6 0.7 0.8 0.9 αGlioblastomas
CFigure 11.boxplots of cluster purity for clusters obtained by the robust clustering procedure following applica-tion ofnetSmoothwith different values ofα. α=0is equivalent to not usingnetSmoothat all. The procedure is robust to alpha, that is, most values of alpha produce more robust clusters. A) HSPCs, B) embryonic cells, C) glioblastomas. 0.55 0.60 0.65 pro po rti on of ce lls in rob us t c lus ter s
Hematopoiesis
0.88 0.90 0.92 pro po rti on of ce lls in rob us t c lus ter sEmbryonic cells
0.92 0.93 0.94 0.95 pro po rti on of ce lls in rob us t c lus ter sGlioblastomas
0.2 0.4 0.6 0.8 α 0.35 0.40 0.45 0.50 me dia n c lus ter pu rit y A 0.2 0.4 0.6 0.8 α 0.56 0.58 0.60 me dia n c lus ter pu rit y B 0.2 0.4 0.6 0.8 α 0.875 0.900 0.925 0.950 me dia n c lus ter pu rit y CFigure 12. the proportion of cells in robust clusters, and cluster purity for those robust clusters, for a range of alpha values, shows that picking the alpha with the highest proportion in robust clusters also picks the alpha with the highest cluster purity. A) hematopoietic stem/progenitor cells B) embryonic cells, C) glioblastomas.
and
clusterExperiment::clusterMany
func-tions, the consensus clustering is obtained using theclusterExperiment::combineMany
func-tion, and the cluster merging (steps 5 and 6) using theclusterExperiment::makeDendrogram
andclusterExperiment::mergeClusters
functions. For more details, see[16].Choice of dimensionality reduction technique in the clustering procedure
In step (1) above, we cluster cells in a lower dimension embedding using either PCA [25] or t-SNE [26], in a dataset-dependent manner. Different single cell datasets respond better to different dimensionality reduction tech-niques which are better able to tease out the biological cluster structure of the data. In order to pick the right technique algorithmically, we compute the entropy in a 2D embedding. We obtained 2D embeddings from the 500 most variable genes using either PCA or t-SNE, binned them in a 20x20 grid, and computed the entropy using the
discretize
andentropy
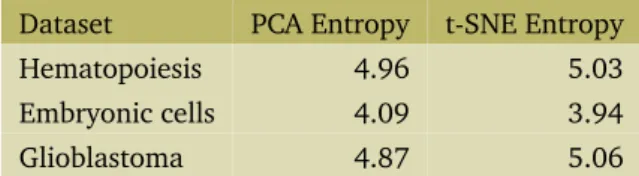
functions in theentropyR package[27]. The entropy in the 2D embedding is a mea-sure for the information captured by it. For the clustering procedure, we pick the embedding with the highest infor-mation content. For the hematopoiesis and glioblastoma datasets, this is t-SNE, while for the embryonic develop-ment dataset it is PCA (Table 1). This method may be used to pick any dimensionality reduction technique other than the ones mentioned here, which might be more suitable for other analyses.Table 1. Entropy in 2D lower dimension embeddings
Dataset PCA Entropy t-SNE Entropy
Hematopoiesis 4.96 5.03
Embryonic cells 4.09 3.94
Glioblastoma 4.87 5.06
Cluster purity and adjusted mutual information
The cluster purity metric displayed above refers to the proportion of the samples in a cluster which are of the dominant cell type in that cluster. The purity for clusteri is given by Pur i t yi= P j∈Ci ¨ 1, ifl a belj=domi 0, otherwise ni
In addition to the cluster purity metric, we computed the Adjusted Mutual Information (AMI)[28], an information theoretic measure of clustering accuracy which accounts for true positives (two cells of the same type in the same cluster) being caused by chance. The AMI between a clus-teringCand the true labelsLis given by
AM I(L,C) = M I(L,C)−E[M I(L,C)]
ma x(H(L),H(C))−E[M I(L,C)],
where M I(a,b) is the mutual information between la-bellingsaandb,H(a)is entropy of clusteringa, andE[·]
denotes the expectation.
We do not compare the clusterings using the Rand index, as that measure penalizes for so-calledfalse negatives(two cells of the same cell type but in different clusters), which is undesirable as cells from the same cell type might be rightly split into several clusters when a novel cell type is identified.
Construction of the smoothing kernel
The PPI graph from which the diffusion kernel was de-rived was constructed using data from string-db[10]. For each pair of proteins, string-db provides a combined
in-teraction score, which is a score indicating how confident
we can be in the interaction between the proteins, given the different kinds of evidence string-db collates. We sub-set the links to only those above the 90th percentile of combined interaction scores, only keeping the 10% most confident interactions. For mouse that is 1,020,816 actions among 17013 genes. For human, 852,722 inter-actions among 17467 genes.
MAGIC and scImpute parameters
For all the results presented in this paper, scImpute was run using the default parameters (
drop_thre = 0.5
). For MAGIC, we used values for the diffusion time param-eter(T ={1, 2, 4, 8, 16}). UnlikenetSmooth, for MAGIC the proportion of samples in robust clusters and the clus-ter purities were anti-correlated; thus we picked the one that gave the best cluster purities as the best MAGIC pa-rameter. The chosen T values are given in Table 2.Table 2.Opitimal diffusion time values for MAGIC.
Dataset Optimal T Hematopoiesis 1 Embryonic cells 4 Glioblastoma 2
thenetSmoothR package
The analysis for this paper was done using the companion
netSmoothR-package, which is available online:
https:
//github.com/BIMSBbioinfo/netSmooth
.Author contributions
AA conceptualized the project, AA and JR conceived of the algorithm together. All the analysis and software develop-ment was done by JR, who also wrote the initial draft of manuscript with input from AA. AA supervised the writ-ing, software development and analysis. JR wrote R pack-age with input and code review and contributions from AA.
Competing interests
The authors declare none.
Grant information
AA and JR are funded by core funding from Max Delbrück Center, part of Helmholtz Association.
Acknowledgements
We would like to thank Vedran Franke, Bora Uyar and Brendan Osberg for valuable comments and input for the development of this manuscript.
References
[1] Allon Wagner, Aviv Regev, and Nir Yosef. Revealing the vectors of cellular identity with single-cell genomics. Nat Biotechnol, 34(11):1145–1160, nov 2016. ISSN 1087-0156. doi: 10.1038/nbt.3711. URL http://www.
nature.com/doifinder/10.1038/nbt.3711.
[2] Peter V Kharchenko, Lev Silberstein, and David T Scad-den. Bayesian approach to single-cell differential expres-sion analysis.Nat Methods, 11(7):740–742, jul 2014. doi: 10.1038/nmeth.2967. URLhttp://dx.doi.org/10.
1038/nmeth.2967.
[3] Angela R Wu, Norma F Neff, Tomer Kalisky, Piero Dalerba, Barbara Treutlein, Michael E Rothenberg, Francis M Mburu, Gary L Mantalas, Sopheak Sim, Michael F Clarke, and Stephen R Quake. Quantitative assessment of single-cell rna-sequencing methods. Nat Methods, 11(1):41– 46, jan 2014. doi: 10.1038/nmeth.2694. URL http:
//dx.doi.org/10.1038/nmeth.2694.
[4] Emma Pierson and Christopher Yau. Zifa: Dimension-ality reduction for zero-inflated single-cell gene expres-sion analysis. Genome Biol, 16:241, nov 2015. doi: 10.1186/s13059- 015- 0805- z. URLhttp://dx.doi.
org/10.1186/s13059-015-0805-z.
[5] Peijie Lin, Michael Troup, and Joshua W K Ho. Cidr: Ultra-fast and accurate clustering through imputation for single-cell rna-seq data. Genome Biol, 18(1):59, mar 2017. doi: 10.1186/s13059- 017- 1188- 0. URLhttp://dx.doi.
org/10.1186/s13059-017-1188-0.
[6] Wei Vivian Li and Jingyi Jessica Li. scimpute: Accu-rate and robust imputation for single cell rna-seq data.
bioRxiv, 2017. doi: 10.1101/141598. URLhttps:// www.biorxiv.org/content/early/2017/06/04/ 141598.
[7] David van Dijk, Juozas Nainys, Roshan Sharma, Pooja Kathail, Ambrose J Carr, Kevin R Moon, Linas Mazutis, Guy Wolf, Smita Krishnaswamy, and Dana Pe’er. Magic: A diffusion-based imputation method reveals gene-gene interactions in single-cell rna-sequencing data. bioRxiv, 2017. doi: 10 . 1101/111591. URL https : / / www.biorxiv.org/content/early/2017/02/25/ 111591.
[8] Nitin Bhardwaj and Hui Lu. Correlation between gene ex-pression profiles and protein-protein interactions within and across genomes. Bioinformatics, 21(11):2730–2738, jun 2005. doi: 10.1093/bioinformatics/bti398. URL
http://dx.doi.org/10.1093/bioinformatics/ bti398.
[9] Hunter B Fraser, Aaron E Hirsh, Dennis P Wall, and Michael B Eisen. Coevolution of gene expression among interacting proteins. Proc Natl Acad Sci U S A, 101 (24):9033–9038, jun 2004. doi: 10 . 1073/pnas . 0402591101. URL http://dx.doi.org/10.1073/
pnas.0402591101.
[10] Damian Szklarczyk, John H Morris, Helen Cook, Michael Kuhn, Stefan Wyder, Milan Simonovic, Alberto Santos, Nadezhda T Doncheva, Alexander Roth, Peer Bork, Lars J Jensen, and Christian von Mering. The string database in 2017: quality-controlled protein-protein association net-works, made broadly accessible.Nucleic Acids Res, 45(D1): D362–D368, jan 2017. ISSN 0305-1048. doi: 10.1093/ nar/gkw937. URL http://nar.oxfordjournals.
org/lookup/doi/10.1093/nar/gkw937.
[11] Insuk Lee, U Martin Blom, Peggy I Wang, Jung Eun Shim, and Edward M Marcotte. Prioritizing candidate disease genes by network-based boosting of genome-wide associ-ation data.Genome Res, 21(7):1109–1121, jul 2011. doi: 10.1101/gr.118992.110. URLhttp://dx.doi.org/
10.1101/gr.118992.110.
[12] M. Hofree, J. P. Shen, H. Carter, A. Gross, and T. Ideker. Network-based stratification of tumor mutations. Nat. Methods, 10(11):1108–1115, Nov 2013.
[13] Fabio Vandin, Eli Upfal, and Benjamin J Raphael. Al-gorithms for detecting significantly mutated pathways in cancer. J Comput Biol, 18(3):507–522, mar 2011. doi: 10.1089/cmb.2010.0265. URLhttp://dx.doi.org/
10.1089/cmb.2010.0265.
[14] G. Dørum, L. Snipen, M. Solheim, and S. Saebo. Smooth-ing gene expression data with network information im-proves consistency of regulated genes.Stat Appl Genet Mol Biol, 10(1), Aug 2011.
[15] Sonia Nestorowa, Fiona K Hamey, Blanca Pijuan Sala, Evangelia Diamanti, Mairi Shepherd, Elisa Laurenti, Nicola K Wilson, David G Kent, and Berthold Göttgens. A single-cell resolution map of mouse hematopoietic stem and progenitor cell differentiation. Blood, 128(8):e20– 31, aug 2016. doi: 10.1182/blood- 2016- 05- 716480.
URL http://dx.doi.org/10.1182/blood-
bioinformatics/btp616. URLhttp://dx.doi.org/10.
1093/bioinformatics/btp616.
[18] Qiaolin Deng, Daniel Ramsköld, Björn Reinius, and Rickard Sandberg. Single-cell rna-seq reveals dynamic, random monoallelic gene expression in mammalian cells.
Science, 343(6167):193–196, jan 2014. doi: 10.1126/ science.1245316. URLhttp://dx.doi.org/10.1126/
science.1245316.
[19] Anoop P Patel, Itay Tirosh, John J Trombetta, Alex K Shalek, Shawn M Gillespie, Hiroaki Wakimoto, Daniel P Cahill, Brian V Nahed, William T Curry, Robert L Mar-tuza, David N Louis, Orit Rozenblatt-Rosen, Mario L Suvà, Aviv Regev, and Bradley E Bernstein. Single-cell rna-seq highlights intratumoral heterogeneity in primary glioblas-toma. Science, 344(6190):1396–1401, jun 2014. doi: 10.1126/science.1254257. URLhttp://dx.doi.org/
10.1126/science.1254257.
[20] Robert Petryszak, Maria Keays, Y. Amy Tang, Nuno A. Fon-seca, Elisabet Barrera, Tony Burdett, Anja Füllgrabe, Al-fonso Muñoz-Pomer Fuentes, Simon Jupp, Satu Koskinen, Oliver Mannion, Laura Huerta, Karine Megy, Catherine Snow, Eleanor Williams, Mitra Barzine, Emma Hastings, Hendrik Weisser, James Wright, Pankaj Jaiswal, Wolfgang Huber, Jyoti Choudhary, Helen E. Parkinson, and Alvis Brazma. Expression atlas update—an integrated database of gene and protein expression in humans, animals and plants.Nucleic Acids Research, 44(D1):D746–D752, 2016. doi: 10.1093/nar/gkv1045. URL+http://dx.doi.
org/10.1093/nar/gkv1045.
[21] I. Lee, U. M. Blom, P. I. Wang, J. E. Shim, and E. M. Mar-cotte. Prioritizing candidate disease genes by network-based boosting of genome-wide association data.Genome Res., 21(7):1109–1121, Jul 2011.
[22] R. Edgar, M. Domrachev, and A. E. Lash. Gene Expression Omnibus: NCBI gene expression and hybridization array data repository. Nucleic Acids Res., 30(1):207–210, Jan 2002.
[23] Charlotte Soneson and Mark D. Robinson. Bias, robustness and scalability in differential expression analysis of single-cell rna-seq data. bioRxiv, 2017. doi: 10.1101/143289.
URLhttps://www.biorxiv.org/content/early/
2017/05/28/143289.
[24] Davis J. McCarthy, Kieran R. Campbell, Aaron T. L. Lun, and Quin F. Wills. Scater: pre-processing, quality control, normalization and visualization of single-cell rna-seq data in r. Bioinformatics, 33(8):1179–1186, 2017. doi: 10. 1093/bioinformatics/btw777. URL+http://dx.doi.
org/10.1093/bioinformatics/btw777.
[25] Trevor Hastie, Robert Tibshirani, and Jerome Friedman.
The Elements of Statistical Learning. Springer Series in Statistics. Springer New York Inc., New York, NY, USA, 2001.
formation theoretic measures for clusterings compari-son: Variants, properties, normalization and correction for chance. J. Mach. Learn. Res., 11:2837–2854, December 2010. ISSN 1532-4435. URL http://dl.acm.org/
Supplementary material
raw netsmooth MAGIC scImpute 0.0 0.2 0.4 0.6 0.8 1.0
pro
po
rti
on
0-co
un
t
Hematopoiesis
Araw netsmooth MAGIC scImpute 0.0 0.2 0.4 0.6 0.8 1.0B
Embryonic cells
raw netsmooth MAGIC scImpute 0.0 0.2 0.4 0.6 0.8 1.0C
Glioblastoma
Figure S1.The proportion of genes with 0 counts is a proxy for technical dropouts. A) no preprocessing, B) after application ofnetSmooth, C), using scImpute, and D) after application of MAGIC.
A CMP GMP LMPP LTHSC MEP MPP1 MPP2 MPP3 STHSC B C D
Normalized data
netsmooth
MAGIC
scImpute
Figure S2. PCA plots of the HSPC dataset A) no preprocessing, B) after application ofnetSmooth, C), using scImpute, and D) after application of MAGIC.
A CMP GMP LMPP LTHSC MEP MPP1 MPP2 MPP3 STHSC B C D
Normalized data
netsmooth
MAGIC
scImpute
Figure S3. t-SNE plots of the HSPC dataset A) no preprocessing, B) after application ofnetSmooth, C), using scImpute, and D) after application of MAGIC.
Figure S4. single cells from the embryonic development dataset were clustered using the robust clustering procedure, and the 500 most differentially expressed genes (by edgeR-QLF test adjusted P value) in any of the discovered clusters are shown in a heatmap, as well as cluster assignments and cell types. A) raw (no imputation), B) after application ofnetSmooth, C) missing values imputed using scImpute D) after application of MAGIC
A
Zygote
Early 2-cell blastomere
Mid 2-cell blastomere Late 2-cell blastomere 2-cell blastomere 4-cell blastomere 8-cell blastomere 16-cell blastomere Early blastocyst Mid blastocyst Late blastocyst Liver fibroblast B C D
Normalized data
netsmooth
MAGIC
scImpute
Figure S5. t-SNE plots of the embvryonic development dataset A) no preprocessing, B) after application of
Figure S6. single cells from the glioblastoma dataset were clustered using the robust clustering procedure, and the 500 most differentially expressed genes (by edgeR-QLF test adjusted P value) in any of the discovered clusters are shown in a heatmap, as well as cluster assignments and cell types. A) raw (no imputation), B) after application ofnetSmooth, C) missing values imputed using scImpute D) after application of MAGIC
A
cell line: CSC6
cell line: CSC8 patient id: MGH26patient id: MGH28 patient id: MGH29patient id: MGH30 patient id: MGH31 B
C D
Normalized data
netsmooth
MAGIC
scImpute
Figure S7. PCA plots of the glioblastoma dataset A) no preprocessing, B) after application ofnetSmooth, C), using scImpute, and D) after application of MAGIC.
0.0 0.1 0.2 0.3 0.4 0.5 0.6 0.7 0.8 0.9 α 0.2 0.4 0.6 0.8 1.0 cl us te r
pu
rit
y
Hematopoiesis
directional smoothing
A 0.0 0.1 0.2 0.3 0.4 0.5 0.6 0.7 0.8 0.9 αHematopoiesis
cell-type specific
B 0.0 0.1 0.2 0.3 0.4 0.5 0.6 0.7 0.8 0.9 αGlioblastomas
HumanNet
CFigure S8. Cluter purity by smoothing parameter. A) for the hematopoiesis dataset with a directional (signed) graph, where inhibitory interactions have a negative edge weight. B) For the hematopoiesis dataset using a gene network with only genes that have a cell-type specific expression in any cell type. C) In the glioblastoma dataset using a gene network from HumanNet.