robust abnormal behavior detection method using convolutional neural
net-work. Computational Science and Technology. Lecture Notes in Electrical
Engineering, 481. pp. 37-47.
Downloaded from:
http://e-space.mmu.ac.uk/621635/
Version:
Accepted Version
Publisher:
Springer
DOI:
https://doi.org/10.1007/978-981-13-2622-6_4
Please cite the published version
A Robust Abnormal Behavior Detection Method Using
Convolutional Neural Network
Nian Chi Tay1[0000-0002-8981-8655], Connie Tee2[0000-0002-0901-3831], Thian Song Ong 3[0000-0002-5867-9517], Kah Ong Michael Goh4[0000-0002-9217-6390] and Pin Shen Teh5[0000-0002-0607-2617]
1,2,3,4 Multimedia University, Malacca, Malaysia 5 University of Manchester, Manchester, UK
Abstract. A behavior is considered abnormal when it is seen as unusual under certain contexts. The definition for abnormal behavior varies depending on situ-ations. For example, people running in a field is considered normal but is deemed abnormal if it takes place in a mall. Similarly, loitering in the alleys, fighting or pushing each other in public areas are considered abnormal under specific cir-cumstances. Abnormal behavior detection is crucial due to the increasing crime rate in the society. If an abnormal behavior can be detected earlier, tragedies can be avoided. In recent years, deep learning has been widely applied in the com-puter vision field and has acquired great success for human detection. In particu-lar, Convolutional Neural Network (CNN) has shown to have achieved state-of-the-art performance in human detection. In this paper, a CNN-based abnormal behavior detection method is presented. The proposed approach automatically learns the most discriminative characteristics pertaining to human behavior from a large pool of videos containing normal and abnormal behaviors. Since the in-terpretation for abnormal behavior varies across contexts, extensive experiments have been carried out to assess various conditions and scopes including crowd and single person behavior detection and recognition. The proposed method rep-resents an end-to-end solution to deal with abnormal behavior under different conditions including variations in background, number of subjects (individual, two persons or crowd), and a range of diverse unusual human activities. Experi-ments on five benchmark datasets validate the performance of the proposed ap-proach.
Keywords: Abnormal behavior detection, Convolutional Neural Network, Deep learning.
1
Introduction
There is a pressing need for tightened security due to the increasing crime rate in the society. Every now and then, there are headlines and news about crime cases such as robbery, personal attack, and terrorism. To deter criminal offenses and to ensure public safety, surveillance devices like CCTV cameras have been installed in public places such as banks, schools, shops and subway stations. However, it is impractical for human
to effectively monitor the cameras twenty-four hours a day, seven days a week. This is where computer vision technology comes in. Today's modern surveillance system not only aims to monitor and substitute the human eye, but also to carry out surveillance automatically and autonomously. The perception for abnormal behavior differs on sit-uations. A behavior is said to be abnormal if the behavior is different from one’s neigh-bors [1]. For example, the running action is considered normal in a field but is consid-ered abnormal if it happens in a shopping mall. If an abnormal behavior can be detected early by the surveillance system, many tragedies can be prevented from happening.
This paper proposes a deep learning approach for abnormal behavior detection. Deep learning is inspired by neural network which contains a deep structure to learn useful features and representations directly from the data. A typical neural network is made up of an input layer, several hidden layers and an output layer. A deep network, on the other hand, consists of a large network comprising of many layered networks [2]. Con-volutional Neural Network (CNN) is one of the popular networks in deep learning.
In this work, we present a CNN-based method for abnormal behavior detection. The method automatically learns the characteristics concerning a wide range of abnormal behaviors. We also analyze the performance of the proposed method using various sub-jects such as individual, two persons, and crowd behaviors involving different back-ground settings. Such diverse analysis has not been studied before.
This paper is organized into four sections. Section 2 discusses the related works on abnormal behavior detection. Section 3 introduces our proposed CNN framework. Sec-tion 4 discusses the experiment and results obtained. SecSec-tion 5 presents the conclusion and future work.
2
Related Works
There are various methods and techniques used for human abnormal behavior detection in surveillance system. In this paper, we focus on the most crucial components in CNN: training and learning of data. The data are fed to the network to learn useful features about the data in order to perform recognition. The existing approaches can generally be categorized into three broad categories.
The first category is supervised learning. This is a type of learning network whereby the labels of normal and abnormal behaviors are given beforehand correspond to the situations. The network takes the input features and also the labels for training [3] - [6]. If the label of the test sample matches the training sample that contains normal behav-ior, it is classified as normal behavbehav-ior, whereas if not, then is classified as abnormal behavior. The second category is unsupervised learning. This is a type of learning whereby the network clusters the data without any labels [7] - [10]. In order to cluster the data into abnormal or normal behavior, certain statistical properties and methods are needed. The data that have similar features are clustered in the same group whereas isolated clusters are defined as anomalies, which represent the abnormal behaviors. The last category is semi-supervised learning. This is a type of learning whereby it requires a mixture of labeled and unlabeled data [11]-[14]. This approach inherits the advantages and disadvantages of both methods which will be discussed in the later part of the paper.
3
For supervised learning approach, Ko et al. [3] proposed deep convolutional frame-work. The input image is first fed into the CNN and applied with Kalman filter. Next, the output vector is transferred to Long Short Term Memory (LSTM) network to per-form the behavior classification. Kuklyte [4] implemented Motion Boundary Histo-gram (MBH) to segment spatio-temporal regions and SVM method to classify the data. Radial Basis Function (RBF) kernel is used to tackle the noise. Nater et al. [5] applied tracker trees method which specified the actions at a higher level of trees. For instance, detection at the lowest level was to recognize human. Further levels upwards were to identify specific actions such as unusual behaviors. The authors used appearance based probabilistic tracking to identify images that were represented in different forms like segmented, rescaled, distance transformed, embedded and reconstructed. The work by Lv et al. [6] performed features matching using Pyramid Match Kernel algorithm. The input actions in human silhouette form were modeled as 2D human poses and repre-sented using Action Net which is a graph model.
For unsupervised learning method, Choudhary et al. [7] proposed Probabilistic La-tent Semantic Allocation (pLSA) to extract the spatio-temporal features from videos containing indoor corridor monitoring that are segmented using video epitomes. On the other hand, Hu et al. [8] applied Hierarchical Dirichlet Process Hidden Markov Model (HDP-HMM) to learn the abnormal or normal features from MIT PLIA 1 dataset which contains domestic house chores that are filtered by One-Class Support Vector Machine (OCSVM) model. The work by Varadarajan et al. [9] also used pLSA to recognize patterns in the busy traffic scenes. The scenes were then segmented into regions with particular activities using the low-level features extracted. Zhang et al. [10] introduced a three-phase approach that first used HDP-HMM to create classifiers. In the second phase, abnormal events were identified by an ensemble learning algorithm. Lastly, ab-normal behavior models were derived from ab-normal behavior model to decrease the false positive rate, which is the wrongly classified outputs in abnormal activity samples.
For semi-supervised learning technique, Wang et al. [11] combined k-means algo-rithm and Posterior Probability (PPSVM) to detect the classes from an imbalanced data. This method classifies the data using probability distributions and not features. Zou et al. [12] presented a semi-supervised Expectation-Maximization algorithm and ex-tracted the features using Gaussian-based appearance similarity model to form histo-grams. Jager et al. [13] employed a three-phase learning procedure. The image se-quences were first encoded using hidden Markov models (CHMMs) before the learning steps. In the first phase, one-class learning was carried out. Next, regular sequence model (RSM) was applied to detect the outliers. Lastly, the unusual segments were employed to expand RSM to form an error sequence model (ESM) which was con-trolled by Bayesian Information Criterion (BIC). The work by Li et al. [14] presented a four-steps method to detect abnormality. First, samples were obtained using Dynamic time warping (DTW) clustering method. Next, the parameters in HMM were trained by iterative learning approach. Maximum a posteriori (MAP) technique was used to esti-mate the parameters of abnormal behaviors from normal behaviors. Lastly, topological HMM was built to classify the abnormal behaviors.
Supervised learning is the simplest approach as compared to its unsupervised and semi-supervised counterparts. However, it is not very practical to be implemented in
real world. This is because there are too many types of abnormal behaviors in practice, and a large number of data is needed for the network to learn and perform well for different scenarios. The existing labeled abnormal data are also hard to find and are often costly. On the contrary, unsupervised learning utilizes the statistics learned from unlabeled data samples to cluster normal and abnormal behaviors. The cost of imple-menting unsupervised learning approach is low. However, it might not obtain high ac-curacy due to the fact that the labels are undefined and it depends on statistical approach to cluster the labels. Semi-supervised is said to be the hardest method as it is challenging to discover how to deal with the mixture of labeled and unlabeled data for training. But one of the advantages of semi-supervised learning is that it solves the problem of insuf-ficient labeled data and the mixture of cheap unlabeled data can be used together for training.
3
Proposed Approach
In this section, we provide the detail for the proposed approach. The input images are converted from video sequences containing normal and abnormal behaviors such as walking, jogging, fighting, kicking and punching. The RGB images are selected man-ually using eye inspection and the images undergo a pre-processing stage by applying a 3x3 moving average filter to remove noises in the images, 𝑦𝑖𝑗=
∑𝑚𝑘=−𝑚∑𝑚𝑙=−𝑚𝑤𝑘𝑙𝑥𝑖+𝑘,𝑗+𝑙 where 𝑥𝑖𝑗 denotes the input image and i, j represent the
num-ber of pixels in the image. The image output is referred to as 𝑦𝑖𝑗. A linear filter of size
3 x 3 is used where (2m + 1) x (2m + 1) with weights 𝑤𝑘𝑙 for k, l = -m,…, m and m
equals to 1 [15].
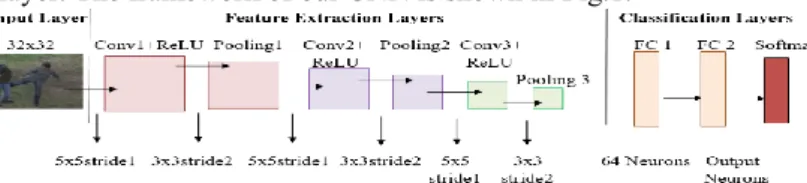
The video frames are manually sampled from the video sequences. Some important information might be lost when sampling the frames from the video sequences. High concentration is needed when selecting the frames to form normal or abnormal behavior dataset as some abnormal behaviors only occur in the middle of the video. Actions in the rest of the frames are categorized as normal behavior. The images are stored in image datastore, and the labels are assigned manually (also known as supervised learn-ing) to each training image. CNN consists of three main components: the input layer which contains the input image, the middle layers which are also known as the feature detection layers, and the final layer which is the classification layer. The images in different sizes (due to video sequences obtained from different datasets) are resized to 32x32 pixels for speedy training. The input image goes through middle layers that con-sist of three operations: convolution, pooling and Rectified Linear Unit (ReLU). This paper uses 6 layers that consist of 3 convolution layers, 2 fully connected layers and a softmax layer. The framework of our CNN is shown in Fig.1.
5
The convolution layer filters the input image and activates certain features of the image for example the edge, corner and texture information. The features are useful to detect the type of action being performed, and how compact the scene is (e.g. people pushing each other). The first convolutional layer has a number of 32 (5x5x3) filters. The third dimension refers to the colored-images input. A padding of 2 pixels is added symmetrically to ensure that image borders are taken into account. This step is im-portant as it prevents the borders from being eliminated too early in the network. Next, the ReLU layer is added to map negative values to zero and to ensure there are only positive values. The ReLU layer allows faster training in the network. This is followed by a max pooling layer which has a 3x3 spatial pooling area with strides of 2 pixels. The size of the data is then down-sampled from 32x32 to 15x15. The three layers of convolutional, ReLU and pooling are repeated two times to complete the feature ex-traction layers. We avoid using too many pooling layers to prevent downsampling the data prematurely as some of the important features might be discarded too early.
After performing feature extraction, the network performs classification. There are basically two layers that form the final layers of the network for classification. The final layers consist of fully connected layers and a softmax layer. The first fully connected layer is made up of 64 output neurons from the input size of 32x32. A ReLU layer is added after that. Next, the second fully connected layer is used to output the number of signals which are the categories to be classified. For Experiment 1, the categories are abnormal and normal behaviors, whereas for Experiment 2, there are six categories in-clude punching, kicking, pushing, hand-shaking, pointing, and hugging. Lastly, a soft-max loss layer and a classification layer are used to calculate the probability of distri-bution for each category. The input layer, middle layers and final layers are combined together to form the complete network.
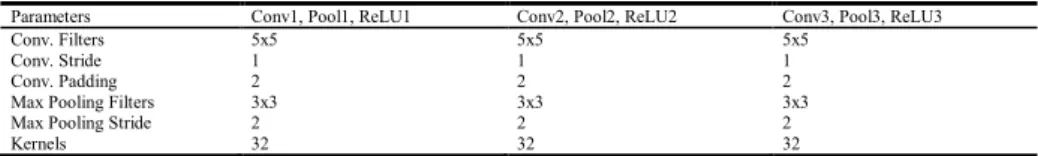
The first weights in the convolutional layer are initialized using normally distributed random numbers with 0.0001 as the standard deviation to decrease the loss when the learning of network takes place. This paper uses stochastic gradient descent with mo-mentum (SGDM) to train the network. We tune the parameters inside the network to find out which features affect the outcome of the results. In this paper, the number of epochs is tuned from 10 to 100 with a step size of 10 and the initial learning rate is configured from 0.001 to 0.1. The number of epoch is a complete forward and backward passing of the training samples while the learning rate refers to the speed of finding the correct weights in the network. Deep learning often requires a large number of inputs to obtain the best accuracy. It also relies heavily on the computational resources and requires a high-performance GPU. The experiments in this paper are carried out using Matlab R2017b version on a workstation equipped with Intel® HD Graphics 5500 8GB CPU. A summary of the proposed CNN framework is shown in Table 1.
Table 1. Summary of CNN configuration.
Parameters Conv1, Pool1, ReLU1 Conv2, Pool2, ReLU2 Conv3, Pool3, ReLU3
Conv. Filters 5x5 5x5 5x5
Conv. Stride 1 1 1
Conv. Padding 2 2 2
Max Pooling Filters 3x3 3x3 3x3
Max Pooling Stride 2 2 2
4
Experiments and Results
4.1 Dataset DescriptionIn this paper, five benchmark databases have been tested namely CMU Graphics Lab Motion Capture Database (CMU) [16], UT-Interaction dataset (UTI) [17], Peliculas Dataset (PEL) [18], Hockey Fighting Dataset (HOF) [19], and Web Dataset (WED) [20]. All datasets have different background settings such as indoor, game field, lawn, public places like pedestrian crossing and movie scenes.
The CMU dataset contains 11 videos with 6 normal and 5 abnormal behaviors. Nor-mal behaviors include walking, hand-shaking, and jogging. AbnorNor-mal behaviors in-clude resistant actions or violent gestures. For example, subject A pulls subject B by elbow but subject B resists; A pulls B by hand but B resists; A and B quarrel with angry hand gestures; A picks up a high stool and threatens to throw at B. There are a total of 2477 images, with 1209 positive images and 1268 negative images. There are 800 pos-itive and negative images each for training, and 409 pospos-itive and 468 negative images for testing. The images are in RGB format in the size of 352x240 pixels, which are then resized to smaller pixels of 32x32 to shorten the training time.
The second dataset used is UTI dataset that consists of videos with 6 classes of hu-man interactions. This includes 976 images of hand-shaking, 983 images of pointing, 904 images of hugging, 1027 images of pushing, 872 images of kicking and 847 images of punching. The dataset is taken on a lawn outdoor. 30 videos of abnormal behaviors and 24 videos of normal behaviors are selected. In this paper, we categorize pushing, kicking and punching as abnormal behaviors while hand-shaking, pointing and pushing as normal behaviors. There are a total number of 5609 images, 2706 positive images and 2903 negative images. This dataset is used to perform both binary and multi-class classifications. In the first part of the experiment, binary classification is carried out to identify normal and abnormal behaviors. 1800 positive and negative images are used for training, while 906 positive images and 1103 images for testing. The images are in RGB format in size of 276x236 pixels which are then resized to 32x32 pixels. In the second part of the experiment, multi-class classification is performed to categorize the images into six categories using 650 images for training and testing.
The third dataset used is the PEL dataset that consists of 368 images. There are 268 fighting images and 100 non-fighting images. The dataset consists of fighting scenes from movies. We categorize the fighting behavior as abnormal behavior and non-fighting behavior as normal behavior. There are 80 positive and negative images re-spectively for training, while 188 positive images and 20 images for testing. The images are in RGB format in size of 352x240 pixels which are resized to 32x32 pixels. The fourth dataset used is the HOF dataset that consists of 1800 images with 900 positive and negative images respectively for training. As for the testing set, we use 600 images each as positive and negative images. The dataset is taken on real life hockey games when fighting against players happened. The positive images consist of fighting behaviors and negative images consist of normal archery images from the UCF Dataset [21]. The images are in RGB format in size of 360x288 pixels before resized to 32x32 pixels.
7
The fifth dataset used is the WED that consists of abnormal crowd behaviors like running in chaos in a public place. There are a total of 1280 images with 640 positive and negative images respectively. The training set is 450 for both positive and negative images, the testing set is 190 for positive and negative images respectively. The images are in RGB format in size of 320x240 pixels which are resized to 32x32 pixels.
4.2 Results and Discussions
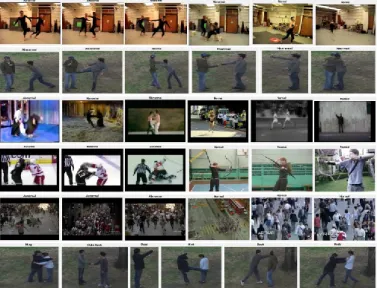
The experiment is carried out in two parts. The first part (Experiment 1) is to classify the images into binary classes; either abnormal or normal behavior using CMU, UTI, PEL, HOF and WED datasets; while the second part (Experiment 2) is to classify the images into 6 categories (punching, kicking, pushing as abnormal behaviors; hand-shaking, pointing and hugging as normal behaviors) using UTI dataset. The experi-ments are split into two parts to evaluate the effect of the number of classes on the performance of the network. Some screenshots for Experiment 1 and Experiment 2 are shown in Fig. 2 containing both abnormal and normal behaviors. The last row in the figure presents the six categories of actions for Experiment 2.
Fig. 2. Screenshots taken from datasets in rows: 1) CMU dataset, 2) UTI dataset, 3) PEL da-taset, 4) HOF dada-taset, 5) WED dada-taset, 6) UTI dataset for Experiment 2.
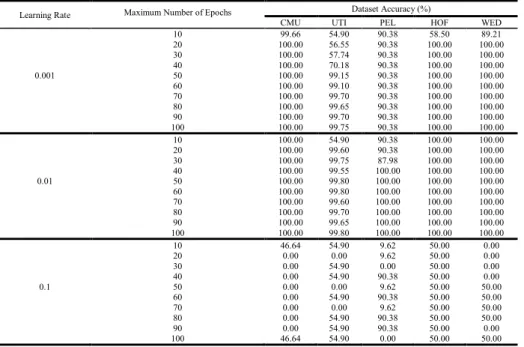
Table 2 records the different number of epochs used for training with different learning rates in Experiment 1. It is shown that the proposed approach achieves high accuracy around 100% for all the datasets. A learning rate of 0.01 gives the highest accuracy for all the datasets. A learning rate of 0.001 can also achieve high accuracy, but the result is slightly lower for the UTI dataset and PEL dataset. The large number of behaviors in the first dataset makes it harder for the network to learn. The images in the PEL dataset are slightly blurred as compared to others. These may be the reasons of the slightly decreased performance. From the viewpoint of learning rate, low learning rate will
cause slow convergence, overfitting and low accuracy. A learning rate of 0.1 is too fast for the network to learn the weights and this results in overshooting the global mini-mum. Apart from learning rate, the results also show that the higher the number of epochs, the better the accuracy. However, there is a risk for overfitting that results in a lower accuracy when it exceeds a certain number of epochs. The more epochs used, the more time-consuming the training is as shown in Table 3.
Table 2. Results obtained by using different learning rates in Experiment 1.
Learning Rate Maximum Number of Epochs Dataset Accuracy (%)
CMU UTI PEL HOF WED 10 99.66 54.90 90.38 58.50 89.21 20 100.00 56.55 90.38 100.00 100.00 30 100.00 57.74 90.38 100.00 100.00 40 100.00 70.18 90.38 100.00 100.00 0.001 50 100.00 99.15 90.38 100.00 100.00 60 100.00 99.10 90.38 100.00 100.00 70 100.00 99.70 90.38 100.00 100.00 80 100.00 99.65 90.38 100.00 100.00 90 100.00 99.70 90.38 100.00 100.00 100 100.00 99.75 90.38 100.00 100.00 10 100.00 54.90 90.38 100.00 100.00 20 100.00 99.60 90.38 100.00 100.00 30 100.00 99.75 87.98 100.00 100.00 40 100.00 99.55 100.00 100.00 100.00 0.01 50 100.00 99.80 100.00 100.00 100.00 60 100.00 99.80 100.00 100.00 100.00 70 100.00 99.60 100.00 100.00 100.00 80 100.00 99.70 100.00 100.00 100.00 90 100.00 99.65 100.00 100.00 100.00 100 100.00 99.80 100.00 100.00 100.00 10 46.64 54.90 9.62 50.00 0.00 20 0.00 0.00 9.62 50.00 0.00 30 0.00 54.90 0.00 50.00 0.00 40 0.00 54.90 90.38 50.00 0.00 0.1 50 0.00 0.00 9.62 50.00 50.00 60 0.00 54.90 90.38 50.00 50.00 70 0.00 0.00 9.62 50.00 50.00 80 0.00 54.90 90.38 50.00 50.00 90 0.00 54.90 90.38 50.00 0.00 100 46.64 54.90 0.00 50.00 50.00
Table 3. Time taken to complete the training.
Dataset Elapsed Time (s)
10 20 30 40 50 60 70 80 90 100 CMU 15.15 28.91 42.47 55.79 71.16 83.63 95.55 108.50 154.10 166.15 UTI 33.59 66.58 97.53 124.69 157.71 184.50 213.98 271.79 315.27 330.58 PEL 2.44 3.81 5.29 6.32 8.75 9.51 10.13 11.33 12.57 14.52 HOF 13.40 23.46 35.72 46.03 58.84 70.69 71.67 82.98 94.77 117.26 WED 9.98 16.71 23.96 32.07 40.26 47.24 55.86 62.96 70.15 79.13
For Experiment 2, the network is trained for multi-class classification. The results in Fig. 3 to Fig. 5 clearly show that the accuracy decreases when the learning rate ap-proaches 0.1, and the network is unable to perform at all eventually. The accuracy starts to drop when it reaches a maximum number of epochs. Out of all the 6 behaviors, hand-shaking has a higher accuracy because this action does not have obstructed views as compared to other actions. The results obtained from Experiment 1 and Experiment 2 suggest that the number of categories in the training data does not affect the accuracy of the result as long as there are enough data provided for training. Table 4 provides a comparison of the proposed method with the state-of-the-art meth-ods. It shows that the proposed method can achieve promising result for both Experi-ments 1 and 2 that consist of single-person behavior, two-person interactions and crowd
9
behaviors. This demonstrates that the proposed approach is able to work well for ab-normal behaviors across different settings.
Fig. 3 - 5. Results obtained by using learning rate of 0.001, 0.01, and 0.1 in Experiment 2.
Table 4. Comparisons between the proposed method and the related works.
5
Conclusion and Future Work
This paper studies human abnormal behavior detection under different situations such as various background settings and number of subjects using convolutional neural net-work. Experiment results show that the proposed approach achieves favorable perfor-mance across different scenarios. Besides, the effects of different network configura-tions are examined. We demonstrate that the learning rate used for training should not be too high to avoid overshooting and not too low to prevent overfitting and low con-vergence of the network. The number of epochs should be tuned from a small value and gradually increased to achieve the highest accuracy.
In the future, we will explore abnormal behavior detection for single person, two persons and crowd under more diverse situations. This will help to design a more robust intelligent surveillance system that can tackle different types of practical situations.
References
1. Nian Chi Tay, P. S. Tay, S. W. Tay: "Deep Learning for Abnormal Behavior Detection", in Security and Authentication: Perspectives, Management and Challenges, Nova Science Pub-lishers, United States (2018). (ISBN: 978-1-53612-942-7).
2. Cho, S., and Kang, H.:"Abnormal behavior detection using hybrid agents in crowded scenes," Pattern Recognition Letters, 44, 64-70. doi:10.1016/j.patrec.2013.11.017.(2014).
Authors Methodology Dataset Descriptions Accuracy (%) Ko and Sim [3] CNN, Karman Filter and LSTM UI-Interaction dataset 97%
Lv and Nevatia [6] Pyramid Match Kernel algorithm Action Net contains behaviors such as punch, kick, point and wave 80.6% Zhang et al. [10] Three-phase approach with HDP-HMM CAVIAR sequences consist of
walk-ing, browsing and fighting behaviors 100% with 60% false alarm rate Zou and Bhanu [12] Gaussian-based appearance similarity model
for feature extraction and Expectation-Maxi-mization algorithm for classification
Human activities observed in a
simu-lated camera network 100% with 4% false alarm rate Jager et al. [13] Three-phase learning procedure using
CHMMs, RSM and ESM Image sequence comprises up to 4000 frames 99.9% with 1.7% false positive rate Proposed approach CNN 5 datasets include UMI, UTI, HOF,
WED and PEL containing behaviors such as kicking, fighting, punching, pushing, pulling etc.
Experiment 1: 100% Experiment 2: 100%
3. Ko, K., and Sim, K.: "Deep convolutional framework for abnormal behavior detection in a smart surveillance system," Engineering Applications of Artificial Intelligence, 67, 226-234. doi:10.1016/j.engappai.2017.10.001. (2018).
4. Jogile Kuklyte: “Unusual event detection in real-world surveillance applications,” Doctoral
dissertation, Dublin City University. (2014).
5. F. Nater, H. Grabner, and L. Van Gool: “Exploiting simple hierarchies for unsupervised human behavior analysis,” in Proc. IEEE Conf. Comput. Vis. Pattern Recog., Jun. 13–18, pp. 2014–2021. (2010).
6. Fengjun. Lv and R. Nevatia: “Single view human action recognition using key pose
match-ing and viterbi path searchmatch-ing,” in Proc. IEEE Conf. Comput. Vision Pattern Recog., pp. 1–
8. (2007).
7. A. Choudhary, M. Pal, S. Banerjee, and S. Chaudhury: “Unusual activity analysis using video epitomes and pLSA,” in Proc. 6th Indian Conf. Comput. Vision, Graphics Image Pro-cess., pp. 390–397. (2008).
8. D. H. Hu, X. Zhang, J. Yin, V. W. Zheng, Q. Yang: “Abnormal activity recognition based
on HDP-HMM models,” in Proc. IJCAI, pp. 1715–1720. (2009).
9. J. Varadarajan and J. Odobez: “Topic models for scene analysis and abnormality detection,”
in Proc. IEEE 12th Int. Conf. Comput. Vision Workshops, Sep. 27–Oct. 4, pp. 1338–1345. (2009).
10. X. Zhang, H. Liu, Y. Gao, and D. H. Hu: “Detecting abnormal events via hierarchical Di-richlet processes,” in Proc. 13th Pacific-Asia Conf. Knowledge Discovery Data Mining, Apr.27–30, pp. 278–289. (2009).
11. Wang, Y., Li, X., & Ding, X.:"Probabilistic framework of visual anomaly detection for un-balanced data". Neurocomputing, 201, 12-18. doi:10.1016/j.neucom.2016.03.038. (2016). 12. X. Zou and B. Bhanu: “Anomalous activity classification in the distributed camera
net-work,” in Proc. 15th IEEE Int. Conf. Image Process., pp. 781–784. (2008).
13. M. Jager, C. Knoll, and F. A. Hamprecht: “Weakly supervised learning of a classifier for
unusual event detection,” IEEE Trans. Image Process., vol. 17, no. 9, pp. 1700–1708, Sep. (2008).
14. H. Li, Z. Hu, Y. Wu, and F. Wu: “Behavior modeling and abnormality detection based on
semi-supervised learning method,” Ruan Jian Xue Bao/J. Software, vol. 18, pp. 527–537. (2007).
15. Glasbey, C. A., & Horgan, G. W.: "Chapter 3: Filters. In Image Analysis for the Biological Sciences." Wiley, United States. (1995).
16. “CMU Graphics Lab Motion Capture Database.”, http://mocap.cs.cmu.edu/, last accessed 2018/1/2.
17. Ryoo, M.S. and Aggarwal, J.K.: “UT-Interaction Dataset, ICPR contest on Semantic
De-scription of Human Activities (SDHA)”,
http://cvrc.ece.utexas.edu/SDHA2010/Human\_Interaction.html.
18. “Peliculas Movies Fight Detection Dataset”, http://academictorrents.com/de-tails/70e0794e2292fc051a13f05ea6f5b6c16f3d3635/tech&hit=1&filelist=1, last accessed 2018/1/5.
19. E. Bermejo, O. Deniz, G. Bueno, R. Sukthankar: “Violence Detection in Video using Com-puter Vision Techniques”, Proceedings of ComCom-puter Analysis of Images and Patterns. (2011).
20. "CRF Web Dataset", http://crcv.ucf.edu/projects/Abnormal_Crowd/#WebDataset, last ac-cessed 2018/1/5.
21. "UCF101 Action Recognition Data Set", http://crcv.ucf.edu/data/UCF101.php, last accessed 2018/1/5.