Masters Theses Student Theses and Dissertations Fall 2018
Classification of EEG signals of user states in gaming using
Classification of EEG signals of user states in gaming using
machine learning
machine learning
Chandana MallapragadaFollow this and additional works at: https://scholarsmine.mst.edu/masters_theses
Part of the Databases and Information Systems Commons, and the Technology and Innovation Commons
Department: Department:
Recommended Citation Recommended Citation
Mallapragada, Chandana, "Classification of EEG signals of user states in gaming using machine learning" (2018). Masters Theses. 7831.
https://scholarsmine.mst.edu/masters_theses/7831
This thesis is brought to you by Scholars' Mine, a service of the Missouri S&T Library and Learning Resources. This work is protected by U. S. Copyright Law. Unauthorized use including reproduction for redistribution requires the permission of the copyright holder. For more information, please contact [email protected].
CLASSIFICATION OF EEG SIGNALS OF USER STATES IN GAMING USING MACHINE LEARNING
by
CHANDANA MALLAPRAGADA
A THESIS
Presented to the Faculty of the Graduate School of the MISSOURI UNIVERSITY OF SCIENCE AND TECHNOLOGY
In Partial Fulfillment of the Requirements for the Degree
MASTER OF SCIENCE IN INFORMATION SCIENCE & TECHNOLOGY 2018
Approved by
Dr. Fiona Fui-Hoon Nah, Advisor Dr. Keng Siau
Dr. Richard Hall Dr. Langtao Chen
ABSTRACT
In this research, brain activity of user states was analyzed using machine learning algorithms. When a user interacts with a computer-based system including playing computer games like Tetris, he or she may experience user states such as boredom, flow, and anxiety. The purpose of this research is to apply machine learning models to
Electroencephalogram (EEG) signals of three user states – boredom, flow and anxiety – to identify and classify the EEG correlates for these user states. We focus on three research questions: (i) How well do machine learning models like support vector
machine, random forests, multinomial logistic regression, and k-nearest neighbor classify the three user states – Boredom, Flow, and Anxiety? (ii) Can we distinguish the flow state from other user states using machine learning models? (iii) What are the essential components of EEG signals for classifying the three user states? To extract the critical components of EEG signals, a feature selection method known as minimum redundancy and maximum relevance method was implemented. An average accuracy of 85 % is achieved for classifying the three user states by using the support vector machine classifier.
Keywords:Neural Correlates, Flow, Electroencephalogram, Machine Learning, Support Vector Machine, Random Forests, Multinomial Logistic Regression, k-Nearest
ACKNOWLEDGMENTS
First and foremost, I gratefully acknowledge the generosity of Dr. Fiona Nah for providing me the opportunity to work under her as a thesis student. It was her constant
mentorship that made me succeed academically and helped me build strong professional relationships with my professors. Her positive influence and constant support are the reasons that inspired me to learn and explore the data science domain and complete my research work. Also, I wish to convey my gratitude to Dr. Langtao Chen, for his patience, constant support, and valuable feedback on my research. I was fortunate enough to work under Dr. Nah and Dr. Chen, who immensely helped in gauging my research in the right direction with their knowledge, without which this thesis would not be possible. Also, I was able to present my research work at the 2017 Midwest
Association for Information Systems conference, a great platform for a graduate student like me to broaden my perspective on research, which happened only with the support of Dr. Nah and Dr. Chen.
I am also grateful to Dr. Keng Siau and Dr. Richard Hall, my committee members, for their encouragement, insightful comments, and questions.
Finally, I thank my fellow thesis student, Tejaswini Yelamanchili, for assisting me throughout my research work. I also appreciate the consistent morale and emotional support of my family and friends.
TABLE OF CONTENTS
Page
ABSTRACT ... iii
ACKNOWLEDGMENTS ... iv
LIST OF ILLUSTRATIONS. ... vii
LIST OF TABLES……….viii
SECTION 1. INTRODUCTION ... 1 2. LITERATURE REVIEW ... 3 2.1. USER STATES ... 3 2.2. ELECTROENCEPHALOGRAM (EEG)………..4 2.3. RELATED WORK ………..5 3. RESEARCH METHODOLOGY ... 12 3.1. EXPERIMENTAL DESIGN ... 12 3.2. RESEARCH PROCEDURE ... 12 3.3. MEASUREMENT ... 14
3.4. CLASSIFICATION USING MACHINE LEARNING ... 15
3.4.1. Support Vector Machine………...16
3.4.2. Random Forests………16
3.4.3. k-Nearest Neighbors………16
3.4.4. Statistics for Evaluating Models ... 17
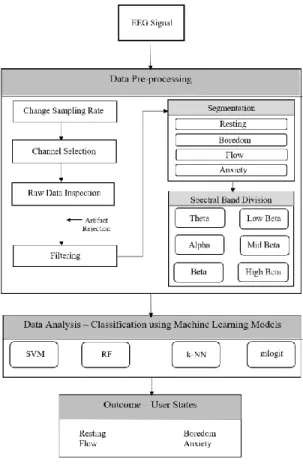
4. DATA ANALYSIS AND RESULTS ... 18
4.1. DATA PRE-PROCESSING ... 19
4.2. DATA ANALYSIS ... 21
4.3. RESULTS ... 23
5. DISCUSSION OF RESULTS ... 30
6. LIMITATIONS AND FUTURE RESEARCH ... 33
7. CONCLUSION ... 34
BIBLIOGRAPHY ... 36
LIST OF ILLUSTRATIONS
Figure Page 3.1. 64-Channel Cognionics EEG Headset ... ..15 4.1. Overview of Data Analysis Process ... ..18 4.2. Model Accuracies for Important EEG Components using MRMR-Method………...27 4.3. TOP 30 EEG Channels using MRMR-Method………29 5.1. Most Important Brain Regions from MRMR-Method………31
LIST OF TABLES
Table Page
2.1. Research on Application of Machine Learning to Classify EEG Signals………..9
3.1. List of Electrodes in EEG Headset and Positions in the Human Scalp………....14
4.1. Brainwaves with Wavelengths………...21
4.2. Model Performance for Every Band Combination………..24
4.3. Comparison of Models ... 25
4.4. Confusion Matrix for Flow vs Non-Flow ... 26
1. INTRODUCTION
User experience (UX) is a research area in Human-Computer Interaction (HCI) that provides a comprehensive view of a user’s interaction with an application, product or system (Tondello, 2016). Today, games are a focal point of user experience research in human-computer interaction (Nacke, 2017). Gaming is an engaging and accessible form of entertainment activities (Hartmann and Klimmt, 2006). The evaluation of user experience in gaming includes a variety of states such as flow, engagement,
involvement, fun, immersion, and presence. When there is a balance between a user’s skill and the difficulty level of a game, an optimal experience known as the flow state arises (Csikszentmihalyi, 1990). In contrast, too much challenge can lead to anxiety, and too low a challenge can result in boredom (Chanel et al., 2008). This research focuses on three user states – Flow, Boredom, and Anxiety – by examining their neural correlates using electroencephalogram (EEG). EEG refers to electrical activity in the brain that arises from electrical impulses that facilitate communication between the brain cells (Muller et al., 2015).
The primary objective of this research is to classify EEG signals into flow, boredom, and anxiety states by applying machine learning. Machine learning, a subset of artificial intelligence, is the implementation of quantitative techniques to learn from existing data to make predictions (Naqa and Murphy, 2015). It involves a process of creating, testing, and validating models to obtain reliable outcomes and trends in the data.
Among the various kinds of machine learning models available, we are interested in four supervised machine learning models – support vector machine (SVM), random
forests (RF), multinomial logistic regression (mlogit), and k-nearest neighbor (k-NN). The following are the statistics used to evaluate the machine learning models and compare their results – accuracy, kappa, and area under the receiver operating characteristic curve (AUC). Further, we identified the essential components of EEG signals for the user state classification task with the help of a feature selection method called minimum redundancy and maximum relevance (MRMR). The aim of this research is to identify machine learning models that perform well in classifying user states into flow, boredom, and anxiety.
Given the importance of applying machine learning techniques to determine user states (i.e., flow, boredom, and anxiety) in the HCI context, we put forth our research questions as follows:
Research Question 1: How well do machine learning models like SVM, RF, mlogit, and k-NN classify the three user states – Boredom, Flow, and Anxiety?
Research Question 2: Can we distinguish the flow state from other user states using machine learning models?
Research Question 3: What are the essential components of EEG signals for classifying the three user states?
This thesis is organized as follows. Section 2 provides a review of the literature. Section 3 covers the research methodology. Section 4 details the process of data
analysis and the results obtained. Section 5 discusses the results. Section 6 highlights the limitations and future research, and Section 7 concludes the thesis.
2. LITERATURE REVIEW
2.1. USER STATES
The study of interaction between human and computer has gained attention, particularly in the field of gaming. Traditionally, modeling of players’ engagement in gaming was qualitative and mostly based on psychology(Plotnikov et al., 2012). Among these traditional ways, two major lines were identified: 1) Malone and Lepper (1987) determined players’ engagement based on three intrinsic qualitative factors: challenge, fantasy and curiosity, and 2) Csikszentmihalyi (1990) assessed players’ enjoyment in gaming by incorporating flow in computer games. Three key user states were identified by Csikszentmihalyi, and they are boredom, flow, and anxiety
(Yelamanchili et al., 2017). Among the above-mentioned user states, flow is the focal point in human-computer interaction research that provides an optimal experience where an individual is totally absorbed in a task and is unaware of his/her surroundings or passing of time (Csikszentmihalyi, 1990; Yelamanchili et al., 2017).
In Csikszentmihalyi’s ‘Flow theory’, the flow state is conceptualized into nine
components: challenging activity that require skills, merging of action and awareness, well-defined goals, direct and instantaneous feedback, focus on the task at hand, loss of self-consciousness, sense of control, distorted sense of time, and intrinsic interest (Csikszentmihalyi, 1990). Flow state emerges when there is a balance between the skill of an individual and the challenge posed by the task (Csikszentmihalyi 1990; Lee et al., 2015; Nah et al., 2010). Boredom is a user state that arises when the skill level of a user is higher than the challenge level of the given task (Csikszentmihalyi, 1975, 1990).
Anxiety occurs when the skill level of a user is much lower than the challenge level of the task. This research focuses on classifying these three user states in gaming.
2.2. ELECTROENCEPHALOGRAM (EEG)
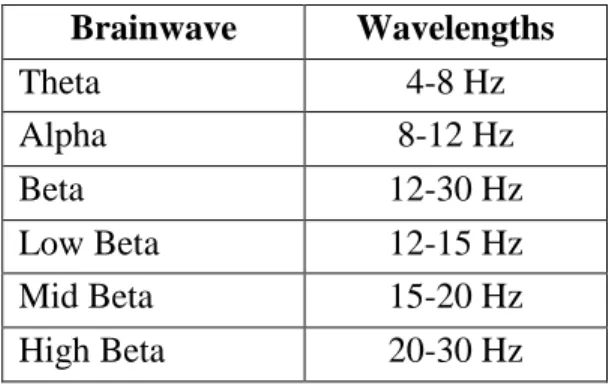
To measure user states, a range of technologies have been developed that record brain activity. Some of the tools are functional magnetic resonance imaging (fMRI), electroencephalography (EEG), magnetoencephalography (MEG), near infrared spectroscopy (NIRS), and electrocorticography (ECoG) (Brunner et al., 2011). Among the above-mentioned BCI technologies, we used EEG in our research to record the brain activity of users. The reason for selecting EEG is due to its high temporal resolution and non-invasive nature of the technology (Berta et al., 2013). The EEG recordings consist of delta (1-4 Hz), theta (4-8 Hz), alpha (8-12 Hz), beta (12-30 Hz) and gamma (30-32 Hz) spectral band frequencies. Each spectral band represents a set of cognitive activity occurring in the brain while performing a task. For example, alpha and theta bands are helpful to study users’ attention and sense of immersion. Since the beta band is large, it can be further divided into three sub-bands, namely, low-beta (12-15 Hz), mid-beta (15-20 Hz), and high-beta ((15-20-30 Hz). The beta band represents self-awareness, mental activity and reasoning (Berta et al., 2013). The neural correlates of different user states can be observed based on the density variations of the spectral bands discussed above (Li et al., 2014). In our research work, theta, alpha, beta and sub-bands of beta were considered to classify the user states while gaming.
2.3. RELATED WORK
Previous studies have assessed user states, especially the flow state, using data from different physiological and psychological technologies like galvanic skin response (GSR), electroencephalography (EEG), electrocardiogram (ECG), electromyography (EMG), and electrodermal activity (EDA) (Berta et al, 2013; Rissler et al, 2018). There are other approaches such as self-reported questionnaires and interviewsthat are based on the users’ recall of the experience (Bhattacherjee, 2012). Recent developments in
information systems (IS) have offered more ways to analyze user states. They include more objective measures that combine EEG signals and machine learning techniques to classify the user states.
Machine learning techniques provide a systematic approach for classifying multi-channel EEG signals (Garrett et al, 2003). Recent studies have used machine leaning to optimize players’ gaming experience (Hair, 2007), where players are
segregated based on their experience in gaming and their momentary scores. Analyzing variables such as scores and responses to situational changes in the computer-based gaming environment helps designers and developers understand both their target
population and design dynamics to optimize gaming experience (Hair, 2007). The SVM model is considered as a state-of-the-art machine learning technique for classifying brain activity obtained from EEG (Berta et al., 2013).
Berta et al (2013) focused on building a machine learning classifier that can distinguish three user states, namely, boredom, frustration/anxiety, and flow. They trained the SVM model with radial basis function kernel (RBF) in two different conditions:1) dependent with a classification accuracy of 50.1%, and 2) user-independent with an accuracy of classification of 66.4%. Berta et al (2013) also
implemented a feature selection method to extract important EEG components and then analyzed these components using SVM for reduced computational times and better classification accuracies. After comparing the models with and without feature selection variables, they found that the model with all the components from the data collected have higher performance than any other models. Another study by Chatterjee et al. (2016) also applied machine learning models to identify cognitive flow. They
implemented the Bayesian network to detect cognitive flow during gaming and derived an accuracy of 62.2 % based on data from the EEG and GSR technologies. Another research has used the SVM model to classify emotions into boredom, engagement, and anxiety while playing the Tetris game and obtained an accuracy of 53.33 % (Chanel et al., 2008). Chanel et al. used EEG and GSR data to classify the above-mentioned emotions using the SVM (Radial Basis Function kernel) model.
Plotnikov et al. (2012) used a gaussian kernel SVM model to assess flow in games based on EEG data and obtained an average accuracy of 57%. A study by Rissler et al. (2018) implemented SVM and random forests models to classify low flow and high flow in gaming using physiological data that include electrocardiography (ECG), blood volume pressure (BVP), and electrodermal activity (EDA). The result shows that cardiac features play an important role in categorizing the flow state, with random forests being a more accurate model (72.3%) than SVM (Rissler et al., 2018).
Lin et al. (2008) implemented the SVM – RBF model to classify 32 channel EEG data into four states – joy, arousal, sadness, and pleasure – based on emotions triggered by music. To classify emotions, the EEG data was divided into the following frequency bands: delta (1-3 Hz), theta (4-7 Hz), alpha (8-13 Hz), beta (14-30 Hz), and gamma (31-50 Hz). The study resulted in successful classifications of the emotions with
a maximum accuracy of 92.73% that used all the frequency bands combinations. Another study with the same context of listening to music utilized the multilayer perceptron classifier to classify the EEG data into joy, angry, sadness, and pleasure and obtained an accuracy of 69.69 % using a sample size of five (Lin et al., 2007).
Similarly, another study by Wang et al. (2011) used machine learning algorithms to classify user states in the context of movie elicitation. The time domain features and frequency domain features of EEG data were compared to assess which features classify emotions more correctly. They used the SVM-RBF model, k-NN model, and multilayer perceptron model to classify user states into joy, sad, relax, and fear. The SVM-RBF model achieved higher accuracy (66.51%) than other models with frequency domain EEG features as input. A similar study was conducted by Wang et al (2014) that compared three different EEG features, specifically power spectrum, wavelet, and nonlinear dynamical analysis, to understand the relationship between emotion and EEG data in the context of movie elicitation. The emotional state classification was done using the different kernels (RBF, polynomial, linear) of the SVM model across all the combinations of frequency bands (delta, beta, alpha, theta, and gamma). The results indicate that the power spectrum plays an important role in classifying the emotions with the linear kernel SVM (87.53%) model achieving the highest classification accuracy using a combination of all bands (Wang et al., 2014).
Several studies in the medical field studied the classification of EEG signals based on machine learning techniques, where the SVM model was frequently used. Lotte et al. (2007) reviewed the performance of all machine learning algorithms
available for the purpose of classification from EEG to BCI systems. The SVM model is the most efficient for synchronous BCI due to its regularization property, simplicity,
and robustness. Vladimir et al. (2015) investigated the performance of the SVM model for seizure prediction using EEG signals. The SVM – RBF kernel model was used in the classification of EEG signals into seizure and non-seizure signals with an accuracy of 95.33 % (Joshi et al., 2014). Another study classified EEG signals into epileptic seizure or not using the SVM model with an accuracy of 98.75 %, where principal component analysis (PCA), linear discriminant analysis (LDA), and independent component analysis (ICA) were used for the feature reduction process (Subasi et al., 2010).
Liang et al. (2006) evaluated the performance of backward propagation neural networks and SVM models for mental task classification based on EEG signals. Other models like k-NN and decision trees were used to classify the sleep stages, with k-NN achieving higher classification accuracy than decision tree (Güneş, Polat, & Yosunkaya., 2010). Alkan et al (2005) proposed an automatic seizure detection model using EEG, logistic regression, and neural networks models, with neural networks achieving higher accuracy (92%).
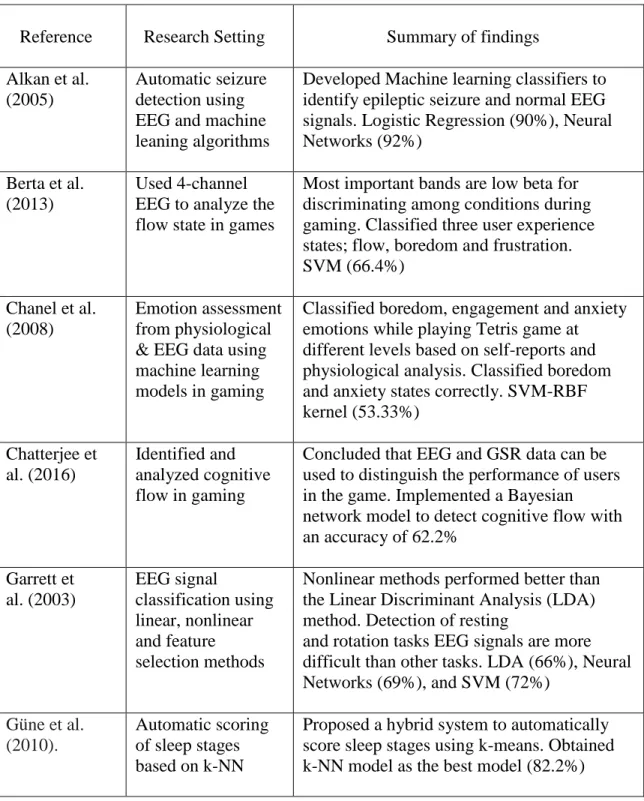
From the previous studies in the literature, we see that the SVM model has been implemented to categorize user states based on EEG data. There are only a few studies on classification of user states based on frequency bands, especially for the flow state. Hence, in this study, we explore different machine learning models to classify the user states into boredom, flow, and anxiety with different combinations of the frequency bands. Also, we are interested to identify the best performing machine learning model to distinguish the flow state from all the other states. Table 2.1 provides a brief overview
of previous studies that have applied various machine learning models in classifications of user states.
Table 2.1. Research on Application of Machine Learning to Classify EEG Signals
Reference Research Setting Summary of findings Alkan et al.
(2005)
Automatic seizure detection using EEG and machine leaning algorithms
Developed Machine learning classifiers to identify epileptic seizure and normal EEG signals. Logistic Regression (90%), Neural Networks (92%)
Berta et al. (2013)
Used 4-channel EEG to analyze the flow state in games
Most important bands are low beta for discriminating among conditions during gaming. Classified three user experience states; flow, boredom and frustration. SVM (66.4%)
Chanel et al. (2008)
Emotion assessment from physiological & EEG data using machine learning models in gaming
Classified boredom, engagement and anxiety emotions while playing Tetris game at different levels based on self-reports and physiological analysis. Classified boredom and anxiety states correctly. SVM-RBF kernel (53.33%) Chatterjee et al. (2016) Identified and analyzed cognitive flow in gaming
Concluded that EEG and GSR data can be used to distinguish the performance of users in the game. Implemented a Bayesian network model to detect cognitive flow with an accuracy of 62.2% Garrett et al. (2003) EEG signal classification using linear, nonlinear and feature selection methods
Nonlinear methods performed better than the Linear Discriminant Analysis (LDA) method. Detection of resting
and rotation tasks EEG signals are more difficult than other tasks. LDA (66%), Neural Networks (69%), and SVM (72%) Güne et al. (2010). Automatic scoring of sleep stages based on k-NN
Proposed a hybrid system to automatically score sleep stages using k-means. Obtained k-NN model as the best model (82.2%)
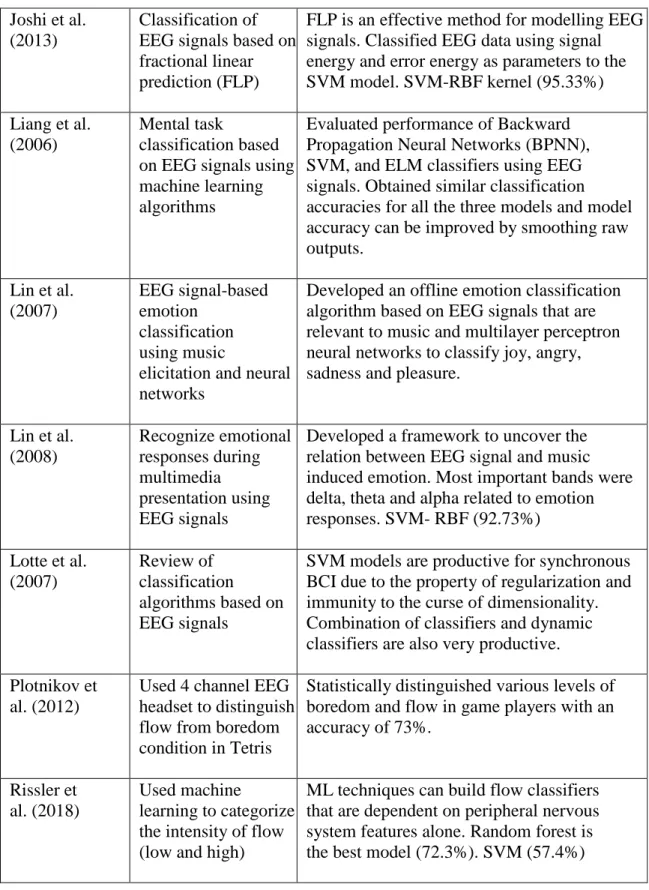
Table 2.1. Research on Application of Machine Learning to Classify EEG Signals (cont.)
Joshi et al. (2013)
Classification of EEG signals based on fractional linear prediction (FLP)
FLP is an effective method for modelling EEG signals. Classified EEG data using signal energy and error energy as parameters to the SVM model. SVM-RBF kernel (95.33%) Liang et al.
(2006)
Mental task
classification based on EEG signals using machine learning algorithms
Evaluated performance of Backward Propagation Neural Networks (BPNN), SVM, and ELM classifiers using EEG signals. Obtained similar classification accuracies for all the three models and model accuracy can be improved by smoothing raw outputs. Lin et al. (2007) EEG signal-based emotion classification using music
elicitation and neural networks
Developed an offline emotion classification algorithm based on EEG signals that are relevant to music and multilayer perceptron neural networks to classify joy, angry, sadness and pleasure.
Lin et al. (2008) Recognize emotional responses during multimedia presentation using EEG signals
Developed a framework to uncover the relation between EEG signal and music induced emotion. Most important bands were delta, theta and alpha related to emotion responses. SVM- RBF (92.73%) Lotte et al. (2007) Review of classification algorithms based on EEG signals
SVM models are productive for synchronous BCI due to the property of regularization and immunity to the curse of dimensionality. Combination of classifiers and dynamic classifiers are also very productive. Plotnikov et
al. (2012)
Used 4 channel EEG headset to distinguish flow from boredom condition in Tetris
Statistically distinguished various levels of boredom and flow in game players with an accuracy of 73%.
Rissler et al. (2018)
Used machine learning to categorize the intensity of flow (low and high)
ML techniques can build flow classifiers that are dependent on peripheral nervous system features alone. Random forest is the best model (72.3%). SVM (57.4%)
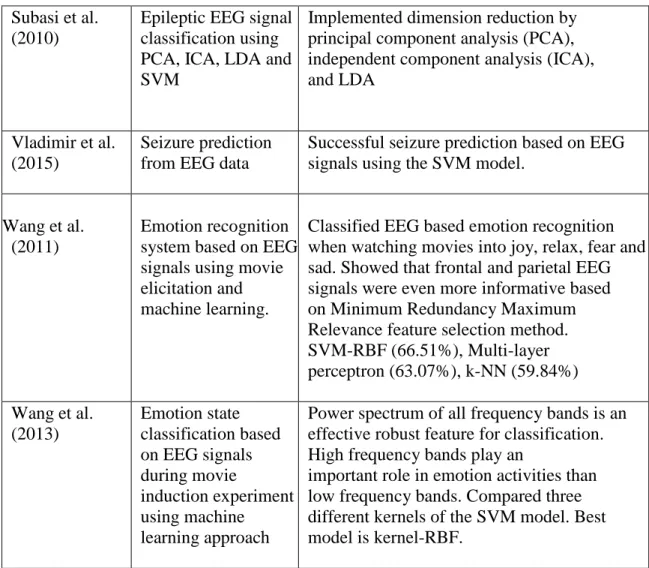
Table 2.1. Research on Application of Machine Learning to Classify EEG Signals (cont.)
Subasi et al. (2010)
Epileptic EEG signal classification using PCA, ICA, LDA and SVM
Implemented dimension reduction by principal component analysis (PCA), independent component analysis (ICA), and LDA
Vladimir et al.
(2015)
Seizure prediction from EEG data
Successful seizure prediction based on EEG signals using the SVM model.
Wang et al. (2011)
Emotion recognition system based on EEG signals using movie elicitation and machine learning.
Classified EEG based emotion recognition when watching movies into joy, relax, fear and sad. Showed that frontal and parietal EEG signals were even more informative based on Minimum Redundancy Maximum Relevance feature selection method. SVM-RBF (66.51%), Multi-layer perceptron (63.07%), k-NN (59.84%) Wang et al. (2013) Emotion state classification based on EEG signals during movie induction experiment using machine learning approach
Power spectrum of all frequency bands is an effective robust feature for classification. High frequency bands play an
important role in emotion activities than low frequency bands. Compared three different kernels of the SVM model. Best model is kernel-RBF.
3. RESEARCH METHODOLOGY
3.1. EXPERIMENTAL DESIGN
A within-subject experimental design was used in this research, where the same individuals experienced more than one conditions (i.e., resting, boredom, flow, and anxiety). Since the main purpose of our research is to assess the flow state against boredom, anxiety and resting states, a within-subject experimental design is appropriate, in which the subjects serve as their own control. This laboratory experiment was
designed to capture EEG recordings for the resting, boredom, flow, and anxiety states using a 64-channel EEG technology called Cognionics. The design was adopted from Berta et al. (2013) who used a plane battle game and 4-channel EEG technology. In our study, the animated game, Tetris, was used to induce boredom, anxiety, and flow states. The experiment consisted of four parts – each part is used to induce a specific user state,
i.e., resting, boredom, flow, and anxiety.
3.2. RESEARCH PROCEDURE
The following steps provide a detailed explanation of the laboratory experiment where the four user states were induced through the Tetris game.
Step 1: In order to capture the subject's orientation towards gaming, a questionnaire that was prepared based on previous studies was administered to the subject to fill out before the experiment started.
Step 2: The resting state was invoked by having the subject stare at a small cross on a dark background screen of the same color as the background color of the game in the experiment.
Step 3: The boredom state was induced using the lowest level (i.e., level 1) of the game. In addition, the subject was provided with a mouse that has been click-disabled, such that the subject could not shorten the wait time for the block to fall but had to wait for each block to fall to the base.
Step 4: The flow state was induced by setting the game at level 5 and having the subject play until all the blocks piled up to the top. During the gameplay, the game level automatically increased as the subject cleared each level of difficulty.
Step 5: The anxiety state was induced by setting the challenge of the game at a very high level (i.e., level 15 and above) such that it way surpassed the skill level of the subject. Here the subjects were required to play the Tetris game two times at level 15 followed by two times at level 20. At the end of each of step 3 to step 5, the subject was asked to fill out a questionnaire that served as a validation check for the manipulations.
Step 6: A retrospective process tracing was carried out for each of the induced states, where each participant was asked to verbalize his or her experience while watching a video playback of their gameplay recording. Based on the subject’s
verbalization of the experience, we determined a 30-second interval that best represents each of the three induced user states for data analysis.
3.3. MEASUREMENT
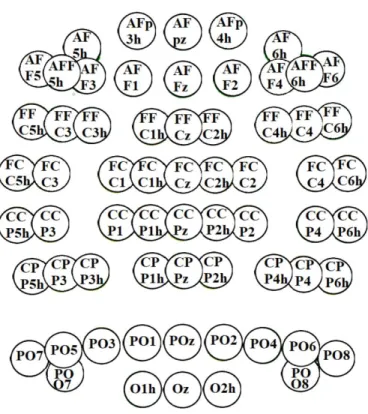
To measure the neurophysiological data while playing the Tetris game, a Cognionics dry EEG headset with 64 channels was placed on the subjects’ head (see Figure 3.1). The EEG headset contains 64 Ag-AgCl pin-type active electrodes mounted in a Bio Semi stretch-lycra head cap.
Table 3.1. List of Electrodes in EEG Headset and Positions in the Human Scalp
The commonly used 10-20 EEG electrode placement was implemented to record electrical activity of the subjects’ brain. Table 3.1 provides the list of electrodes in the
64-channel EEG headset used in this research and their respective positions on the scalp. Position Name Channel Name
Anterior – Frontal AFp3h, AFpz, AFp4h, AF5h, AFF5, AFF5h, AFF3, AFF1, AFFz, AFF2, AFF4, AFF6h, AFF6, AF6h Frontal FFC5h, FFC3, FFC3h, FFC1h, FFCz, FFC2h, FFC4h, FFC4, FFC6h Fronto – Central FCC5h, FCC3, FCC1, FCC1h, FCCz, FCC2h, FCC2, FCC4, FCC6h Central CCP5h, CCP3, CCP1, CCP1h, CCPz, CCP2h, CCP2, CCP4, CCP6h Central – Parietal CPP5h, CPP3, CPP3h, CPP1h, CPPz, CPP2h, CPP4h, CPP4, CPP6h
Parietal-Occipital POO7, PO7, PO5, PO3, PO1, POz, PO2, PO4, PO6, PO8, POO8
Figure 3.1. 64-Channel Cognionics EEG Headset
Figure 3.1 shows the electrode positions of 64-channel Cognionics EEG headset on the human scalp.
3.4. CLASSIFICATION USING MACHINE LEARNING
Machine learning is a subset of artificial intelligencethatfocuses on finding patterns based on the training data for making future predictions. It can also be
considered as real-time analytics using algorithms to analyze the rules of a game and in response to players’ actions to improve their performance (Ramirez, 2014). It is a combination of several other concepts like data mining, predictive modeling, clustering, mathematical modeling, and statistics. In this research, we focused on supervised
machine learning models – SVM, RF, k-NN, and mlogit to classify the user states. The following sub-sections briefly explain the above-mentioned machine learning models.
3.4.1. Support Vector Machine. SVM is considered as the state-of-the-art kernel-based supervised machine learning algorithm implemented for classification (Lin et al., 2008). The algorithm is built on nonlinear kernel function that converts the given input data into high dimensional space. The algorithm learns from the given data iteratively and generates optimal hyperplanes with maximal margins for every class in the high dimensional space (Subasi et al., 2010; Lin et al., 2008). These maximal margin hyperplanes result in decision boundaries that help in classifying different classes. SVM models have the capacity to deal with large sets of data with high classification accuracies (Chang & Lin, 2011). This research implements radial basis function kernel (RBF) of the SVM model which is a nonlinear kernel that maps the given data into a high dimensional space.
3.4.2. Random Forests. RF supervised machine learning model was proposed by Breiman (2001), where classification is performed by constructing each tree based on bootstrap samples of the given data. In comparison to standard trees where each node is split using best split among all input variables, random forests split each node based on a subset of predictors randomly selected at that specific node. This strategy gives random forests better performance and immunity against overfitting problems, when compared to other models such as linear discriminant analysis, support vector machine, and neural networks (Liaw and Wiener, 2002).
3.4.3. k-Nearest Neighbors. The k-NN model is the simplest classification model that searches the entire training data set to classify a single test point based on tuning process using cross validation. As the size of the training dataset increases, the
quality of classification also increases. This feature makes k-NN a model with good classification accuracy, but it suffers from overfitting issues (Goldberger, 2005).
3.4.4. Statistics for Evaluating Models. Machine learning models have various statistical metrics like F1-score, accuracy, kappa statistic, precision, recall, lift, and AUC (Caruana, 2006). The classification accuracy statistic assesses the ratio of correct predictions to the total number of cases evaluated. It ranges from 0 to 1 and is
dependent on input data. AUC is used to evaluate the machine learning classifier
model’s performance based on the area that is under the curve and is independent of the data (Bradley, 1997). The kappa statistic is used to evaluate the overall performance of the machine learning classifier, especially in a multi-class classification problem. It compares a correctly classified model’s performance with the performance of a classifier that randomly classifies data based on their frequency of occurrence (Landis and Koch, 1977). The kappa statistic not only evaluates a single classifier, but also evaluates various classifiers by comparing among them. In this research, we use the kappa statistic, accuracy, and AUC to evaluate the machine learning models’
performance as most of the previous studies also implemented these statistics for model comparisons.
4. DATA ANALYSIS AND RESULTS
The sample size for this research is 44. The subjects are all male who are graduate and undergraduate students from Missouri University of Science and Technology. The duration of the experiment was approximately 90 minutes. In order to control for gender, the experiment was limited to male subjects only and their age is between 18 and 30 years. To perform data pre-processing steps and analysis of the obtained EEG data, Brain Vision Analyzer (version 2.1) and RStudio were used. Figure 4.1 provides an overview of the data analysis process involved in this research.
4.1. DATA PRE-PROCESSING
The collected EEG data contains noises and several artifacts which need to be removed. The artifacts can result from the subjects’ movements like eye blinks, muscle activities, and eye movements, whereas noises result from poor subject grounding, external electric noise, poor electrode contacts, and electric lights (Harmon-Jones and Peterson, 2009; Pizzagalli, 2007). In order to remove these artifacts, the data is pre-processed in Brain Vision Analyzer, as explained in the following steps:
Step 1: Changing the Sampling Rate - The sampling rate of the EEG signals was down sampled (the number of samples per second has been decreased) to 256 Hz by applying spline interpolation to obtain fine-grained resolution. In order to obtain an even frequency resolution, the EEG signals need to have a sampling frequency of power of 2 such as 256 or 512 Hz, instead of 500 Hz, which was the initial sampling frequency that was set while collecting data using Cognionics software (Lin et al., 2007). (For further information, please refer to Yelamanchili, 2018).
Step 2: EEG Channel Selection Optimization - To obtain the best signal processing and classification accuracy, the EEG channels which do not contribute to neural activity need to be discarded. Here, the five channels, ACC0, ACC1, ACC2, Packet, and Trigger were eliminated because they serve as the reference channels to record the signals and hence do not contribute to the neural activity of the brain (For further information, please refer to Yelamanchili, 2018).
Step 3: Raw Data Inspection and Artifact Rejection - An automatic raw data inspection was performed using the built-in algorithm of Brain Vision Analyzer at each individual channel. This step helps in identifying artifacts like eye movements, body
movements, eye blinks, and external noise. Once the artifacts were identified, they were removed by ocular correction Independent Component Analysis based on the rejection criteria (Plank, 2013). (For further information, please refer to Yelamanchili, 2018).
Step 4: Filtering - To remove the effect of external noise on the EEG signals, Infinite Impulse Response (IIR) filters were applied. The recorded EEG signals were analog bandpass filters between 0.1 Hz (Low Pass Filter) and 100 Hz (High Pass Filter). Additionally, notch filter was applied at 60 Hz to remove external noise. (For further information, please refer to Yelamanchili, 2018).
Step 5: Segmentation - The filtered signals obtained from the above step was divided into interval-based approach for further analysis. Based on retrospective process tracing results from the experiment, the filtered data was segmented into four divisions named resting, boredom, flow, and anxiety. This segmentation was performed based on the start and end timestamps of the best second intervals of user states. Each 30-second segment was further divided into 10 segments, with 3-30-second length and 1-30-second overlap, which provides a large set of data points for the data analysis process.
Step 6: Spectral Band Division - To analyze the processed time-domain EEG signals using machine learning methods, we must transform them into the frequency domain (Berta et al, 2013). By using a built-in algorithm in Brain Vision Analyzer, Fast Fourier Transform (FFT) has been applied to transform the time-domain EEG epochs into equivalent frequency-domain epochs. The FFT values of theta, alpha, beta, low beta, mid-beta, and high beta were extracted using the FFT band export option provided by Brain Vision Analyzer. Finally, the mean values of EEG power in different frequency bands (theta, alpha, beta, low beta, mid-beta, and high beta) and at different brain regions
(frontal, temporal, parietal, and occipital) were exported in the form of text files. These text files were converted as Common Separated Value (CSV) files, to make them easily readable by R-Studio.
4.2. DATA ANALYSIS
The data analysis was performed in RStudio, where different machine learning models were applied to the processed EEG data. Table 4.1 provides the brainwave bands with their respective wavelengths used in this research.
Table 4.1. Brainwaves with Wavelengths (Berta et al., 2013)
The following are the band combinations used to implement machine learning models that classify EEG data into resting, boredom, flow, and anxiety states.
1. Theta 5. Low Beta
2. Alpha 6. Mid Beta
3. Beta 7. High Beta
4. Theta + Alpha + Beta 8. Low Beta + Mid Beta + High Beta
Brainwave Wavelengths Theta 4-8 Hz Alpha 8-12 Hz Beta 12-30 Hz Low Beta 12-15 Hz Mid Beta 15-20 Hz High Beta 20-30 Hz
In order to perform a reliable classification process, each band combination dataset mentioned above was divided into training and testing sets by a 70/30 split. Using the training and testing datasets, four machine learning classifiers, i.e., SVM-RBF, RF, mlogit, and k-NN, were used for the training and evaluated. To select common
parameters and pick best parameters for each classifier, the 10-fold cross-validation method was opted for the training sets. We implemented the hyperparameter tuning method to search for the optimal number of neighbors k in the k-NN classifier, number of trees (mtry) in the RF classifier, and cost C and gamma value for the SVM classifier. The models were compared based on average classification accuracy, kappa, and AUC for each band combination and analyzed.
We also tried to identify significant EEG components for each band combination to improve the model performance with only key components. In order to perform the feature selection process, we adopted the MRMR method as mentioned earlier. The MRMR method is based on information theory for sorting each EEG component in descending order resulting in discrimination between various EEG patterns (Wang et al., 2011). The results of this method were extracted in the form of sets, i.e., top 10, top 20, top 30 till top 180 (total number of EEG channels were 192). All the combinations were fed to the machine learning classifier individually and were compared based on the accuracy metric of the model to evaluate the classification performance for each set of EEG components.
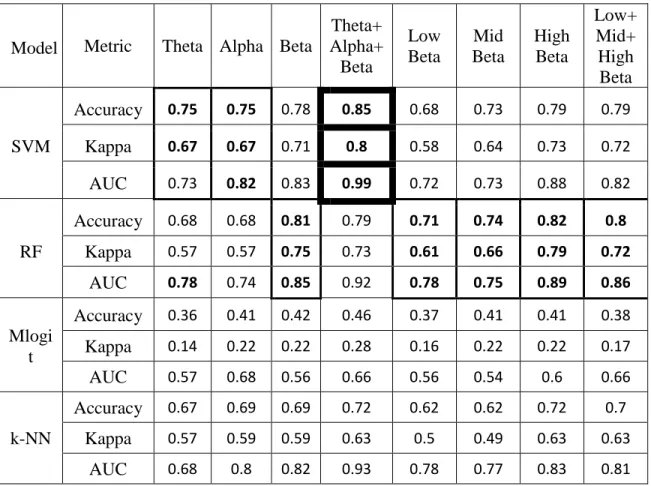
4.3. RESULTS
Table 4.2 shows the performance metrics of each machine learning model in classifying the user states into resting, boredom, flow, and anxiety respectively. The models were evaluated based on accuracy, kappa statistic, and the area under the receiver operating characteristic curve. The model with the best performance is
highlighted in bold for each band combination in Table 4.2. By observing Table 4.2, we see that the SVM model classifies best for theta, alpha, and the combination of theta + alpha + beta, whereas RF performs best for the beta band and all beta sub-band
combinations. The combination of theta + alpha + beta has the highest classification accuracy, kappa and AUC when compared to the other band combinations.
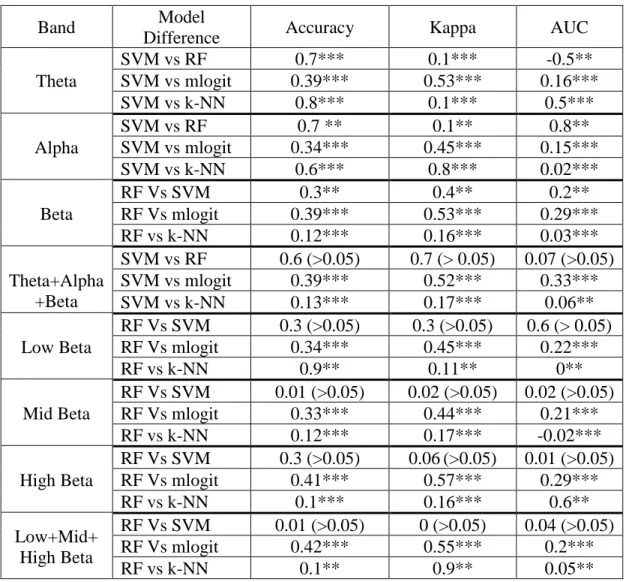
In Table 4.2, we compared the machine learning models based on accuracy, kappa, and AUC. Foe theta, alpha and theta + alpha + beta, the SVM model performs better than other models. For the band combinations of beta, low beta, mid beta, and high beta, the RF model performs better than other models. Table 4.3 provides the statistical difference between the best performing model and other models for each band
combination. The number mentioned in Table 4.3, represents the difference between the models based on the accuracy, kappa, and AUC values. We compared the model
differences based on statistical significance (p-value) for every band combination represented by the asterisk symbol in Table 4.3 to indicate the model efficiency for comparisons and their significance levels. In Table 4.3, three asterisks mean p <0.001, indicating that the efficiency of the best model as compared to the current model to classify user states is very highly statistically significant. Two asterisks mean p < 0.01, indicating that the efficiency of the best model as compared to the current model to
classify user states is highly statistically significant. One asterisk refers to p < 0.05, indicating that the efficiency of the best model as compared to the current model to classify user states is statistically significant. If p > 0.05, it means that the efficiency of the best model as compared to the current model is not statistically significant.
Table 4.2. Model Performance for Every Band Combination
Based on the above analysis, as presented in Table 4.3, we can see that for the theta band, the SVM is the best model as the statistical significance when compared to other models is very high (p < 0.001). For the alpha band, SVM performs better than mlogit, k-NN, and RF as all comparisons with these models are statistically significant.
Metric Theta Alpha Beta
Theta+ Alpha+ Beta Low Beta Mid Beta High Beta Low+ Mid+ High Beta SVM Accuracy 0.75 0.75 0.78 0.85 0.68 0.73 0.79 0.79 Kappa 0.67 0.67 0.71 0.8 0.58 0.64 0.73 0.72 AUC 0.73 0.82 0.83 0.99 0.72 0.73 0.88 0.82 RF Accuracy 0.68 0.68 0.81 0.79 0.71 0.74 0.82 0.8 Kappa 0.57 0.57 0.75 0.73 0.61 0.66 0.79 0.72 AUC 0.78 0.74 0.85 0.92 0.78 0.75 0.89 0.86 Mlogi t Accuracy 0.36 0.41 0.42 0.46 0.37 0.41 0.41 0.38 Kappa 0.14 0.22 0.22 0.28 0.16 0.22 0.22 0.17 AUC 0.57 0.68 0.56 0.66 0.56 0.54 0.6 0.66 k-NN Accuracy 0.67 0.69 0.69 0.72 0.62 0.62 0.72 0.7 Kappa 0.57 0.59 0.59 0.63 0.5 0.49 0.63 0.63 AUC 0.68 0.8 0.82 0.93 0.78 0.77 0.83 0.81 Model
For the beta band, RF performs better than mlogit, k-NN, and SVM as all comparisons with these models are statistically significant. For the theta + alpha + beta combination, SVM is the best performing model when compared to mlogit and k-NN, and there is no statistical difference between the performance of SVM and RF models.
Table 4.3. Comparison of Models
Band Model
Difference Accuracy Kappa AUC Theta SVM vs RF 0.7*** 0.1*** -0.5** SVM vs mlogit 0.39*** 0.53*** 0.16*** SVM vs k-NN 0.8*** 0.1*** 0.5*** Alpha SVM vs RF 0.7 ** 0.1** 0.8** SVM vs mlogit 0.34*** 0.45*** 0.15*** SVM vs k-NN 0.6*** 0.8*** 0.02*** Beta RF Vs SVM 0.3** 0.4** 0.2** RF Vs mlogit 0.39*** 0.53*** 0.29*** RF vs k-NN 0.12*** 0.16*** 0.03*** Theta+Alpha +Beta SVM vs RF 0.6 (>0.05) 0.7 (> 0.05) 0.07 (>0.05) SVM vs mlogit 0.39*** 0.52*** 0.33*** SVM vs k-NN 0.13*** 0.17*** 0.06** Low Beta RF Vs SVM 0.3 (>0.05) 0.3 (>0.05) 0.6 (> 0.05) RF Vs mlogit 0.34*** 0.45*** 0.22*** RF vs k-NN 0.9** 0.11** 0** Mid Beta RF Vs SVM 0.01 (>0.05) 0.02 (>0.05) 0.02 (>0.05) RF Vs mlogit 0.33*** 0.44*** 0.21*** RF vs k-NN 0.12*** 0.17*** -0.02*** High Beta RF Vs SVM 0.3 (>0.05) 0.06(>0.05) 0.01 (>0.05) RF Vs mlogit 0.41*** 0.57*** 0.29*** RF vs k-NN 0.1*** 0.16*** 0.6** Low+Mid+ High Beta RF Vs SVM 0.01 (>0.05) 0 (>0.05) 0.04 (>0.05) RF Vs mlogit 0.42*** 0.55*** 0.2*** RF vs k-NN 0.1** 0.9** 0.05** Note: One asterisk means p <0.05, two asterisks means p <0.01, three asterisks
For low beta, mid beta, and high beta, RF performs better than mlogit and k-NN models, but there is no statistical difference between the performance of RF and SVM models (p > 0.05). Similarly, for the band combination of low + mid + high beta, RF performs better than mlogit and k-NN models, and there is no statistical difference between the performance of SVM and RF models (p > 0.05).
From the above analysis, we can observe that both SVM and RF models perform better in classifying the user states into resting, boredom, flow, and anxiety. However, higher classification accuracy, kappa value and AUC were achieved by the SVM model for theta + alpha + beta band combination, making it the best model for classifying the user states. When we take the best performing model, SVM, and the theta + alpha + beta band combination to see if it can distinguish the flow state from the non-flow states i.e., resting, boredom, and anxiety, we obtain the resulting confusion matrix shown in Table 4.4.
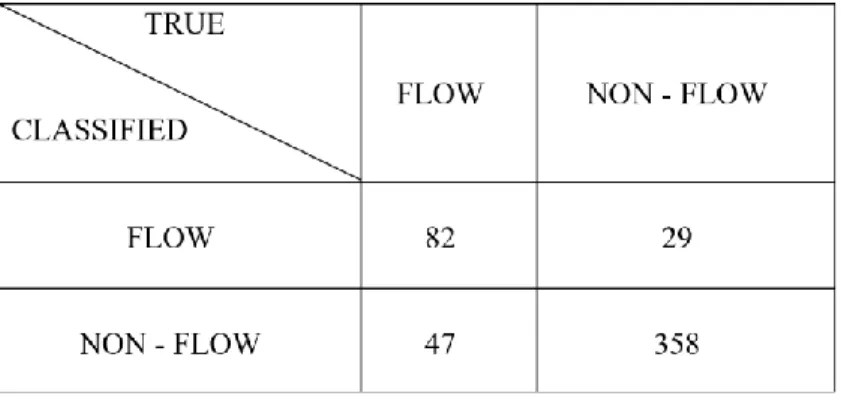
Table 4.4. Confusion Matrix for Flow vs Non-Flow
As we can see from the confusion matrix in Table 4.4, 82 cases were correctly classified into the flow state, whereas the remaining 29 flow state cases were identified
as non-flow. The accuracy for this model is 0.85, with kappa value of 0.58, and AUC of 0.85. Though the accuracy seems good, the kappa value is low, and the output class ofthe model was identified as a non-flow state. This discrepancy in the classification could be caused by the imbalanced dataset with large number of non-flow states (75% of data), and small number of flow states (25% of data).
Next, we performed a feature selection method to identify the best EEG
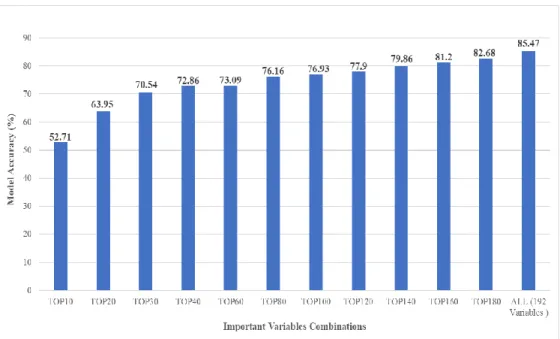
components for better classification accuracies. We performed the MRMR method. The results obtained were differentiated based on top 10, top 20, top 30, top 40, till top 180 (the total number of components is 192). Once the list of top components were collected from the MRMR method, we performed SVM modeling for each combination, to see which combination generated better classification accuracy. Figure 4.2 shows the model accuracy for each set of the important EEG components.
Figure 4.2 indicates that including all the EEG components generates higher classification accuracy when compared to any other combinations of EEG components.
Table 4.5. Top 30 EEG Channels using MRMR (Ranked by Variable Importance)
Rank Variable Band Brain Region
1 B_Oz Beta Occipital
2 A_PO8 Alpha Parietal – Occipital
3 A_Oz Alpha Occipital
4 B_POO8 Beta Parietal – Occipital 5 B_CCP1 Beta Central – Parietal
6 B_O2h Beta Occipital
7 A_O2h Alpha Occipital
8 B_PO3 Beta Parietal – Occipital 9 A_POO8 Alpha Parietal – Occipital 10 B_PO7 Beta Parietal – Occipital 11 B_PO6 Beta Parietal – Occipital 12 A_PO6 Alpha Parietal – Occipital 13 B_POO7 Beta Parietal – Occipital 14 T_PO8 Theta Parietal – Occipital 15 B_FFC4 Beta Fronto – Central 16 B_CPP4h Beta Central – Parietal 17 B_PO1 Beta Parietal – Occipital 18 B_FFC6h Beta Fronto – Central 19 A_PO1 Alpha Parietal – Occipital 20 B_CPP6h Beta Central – Parietal 21 B_FCC5h Beta Fronto – Central 22 B_CPP3 Beta Central – Parietal 23 B_CPP3h Beta Central - Parietal 24 B_CPP5h Beta Central - Parietal 25 B_PO5 Beta Parietal - Occipital 26 A_CPP3 Alpha Central - Parietal
27 B_O1h Beta Occipital
28 B_CCP5h Beta Central - Parietal 29 B_CPP4 Beta Central - Parietal 30 B_CCP4 Beta Central - Parietal
Table 4.5 shows the list of TOP 30 EEG components extracted using the MRMR feature selection method. To understand the most important regions and bands, we examined the TOP 30 EEG components obtained from the MRMR method. These EEG components and their respective bands and brain regions are explained in Table 4.5.
From Table 4.5, we can see that the most informative bands are beta and alpha while the most important brain regions are occipital, parietal – occipital, central –
parietal, fronto-central. The important channels with their rankings are marked according to the electrode positions in the 64-channel Cognionics EEG headset presented in Figure 4.3. In Figure 4.3, the most important channels (first 10) are indicated with dark color (black color), the next ten channels are indicated with medium color (grey color), and the next ten channels are shown with light color (light grey color) to show the level of importance of the variables.
5. DISCUSSION OF RESULTS
Our research results indicate that machine learning can be applied to classify EEG signals of user states with accuracy of 85%. Among the four machine learning models used in this research, SVM-RBF kernel and RF are the two better performing models when compared to k-NN and mlogit models. As we can see from the literature review, most of the studies implemented SVM to classify EEG signals of user states. Berta et al. (2013) implemented the SVM model to classify user states into frustration, boredom and flow in gaming. In this research, SVM and RF are the better models that classify user states into resting, boredom, flow, and anxiety, with higher performance metrics than k-NN and mlogit.
Wang et al (2011) and several other studies examined the performance of important components of EEG and found that the machine learning with all EEG
components performed well. Similarly, we implemented the MRMR method to extract all sets of important components of EEG and compared the model accuracies accordingly. As shown in Figure 4.2 earlier, the model with all EEG components and frequency bands has the highest classification accuracy when compared to other combinations. We took a step forward and analyzed the top 30 variables shown in Table 4.5 to understand the most informative EEG channels and their locations on the human brain. Our results suggest that the most important regions that contribute to better classification of user states are Occipital, Parietal – Occipital, Central – Parietal, and Fronto – Central (mentioned according to the number of occurrences in Table 4.5) with beta and alpha bands being the most informative bands. These regions are indicated in Figure 5.1 which displays the brain regions that are sensitive to capturing user states during gaming.
Figure 5.1. Most Important Brain Regions from MRMR-Method
The Occipital and Parietal – Occipital regions of the brain are responsible for visual and spatial perception, an essential cognitive task demanded by our experimental condition which is gaming (Knyazev, 2007). According to Goldman et al. (2002), when a given task involves the user to implement strategies visually, the occipital part of the brain records higher activity of visual processing. The corresponding increased visual activity results in alpha and band activity which represents the process related to visual attention occurring in the occipital regions of the human brain (Teplan, 2002). The
Parietal - Occipital region of the brain is associated with the perception of movement, and visuospatial processing activities (Sauseng et al., 2004). The task in our research is
playing the Tetris game which requires the user to spatially arrange the falling blocks with the help of visual strategies. The Occipital and Parietal - Occipital regions are
responsible for the visual and spatial attention demanded by the task in our research. The alpha band is responsible for visual activity, which is one of the cognitive activities demanded by the task in this research.Hence the Occipital and Parietal - Occipital regions were observed as the most important brain regions and the alpha band being the most informative band. In Figure 5.1, the occipital region is highlighted with horizontal black lines indicating more activity followed by the parietal-occipital region that is indicated by grey horizontal lines suggesting the next active area according to the results in Table 4.5.
In this research, playing a game is a cognitive task that involves learning,
feedback processing, and increased cognitive load accordingly as the levels of the game increase. Previous studies indicate that the Central – Parietal and Fronto - Central parts of the brain are responsible for cognitive tasks like learning and feedback processing
(Sauseng et al., 2005). The Central – Parietal and Fronto – Central regions are highlighted with light grey horizontal lines with less intensity indicating the reduced activity in the brain according to the MRMR results in Table 4.5.
From previous research, it can be observed that the beta band activity occurs more in the frontal and central regions of the brain representing focused attention and self-awareness (Berta et al., 2013; Taywade and Raut, 2014). Beta waves areresponsible for attention and alertness (Tinguely et al., 2006). The task in our experiment demands attention, self-awareness, and learning with feedback from the user, so that they would not lose the game, which explains the reason underlying the beta and the Central – Parietal, and Fronto – Central brain regions being highly activated areas of the brain after the Occipital and Parietal – Occipital regions and the alpha band.
6. LIMITATIONS AND FUTURE RESEARCH
This research was conducted to understand the application of machine learning on EEG data to classify user states into flow, boredom, and anxiety. One of the limitations of our study is the sample size of 44 and the use of only male participants. Also, we used EEG data only as the physiological data in this research. In future research, other forms of physiological data such as Galvanic Skin Response can be added to the machine learning models to get a better understanding of the classification results for the flow state.
We focused on a set of four models, specifically SVM, RF, k-NN and mlogit. Future work can focus on improving the performance metrics of the current models to get better classifications of the user states. Future research can focus on testing other models like neural networks, linear regression, Bayesian network to find the best model for user states classification. Since the nature of the data collected is balanced, the results could be over-inflated. As such, the components of EEG obtained in our research may vary with respect to a users’ behavior. To avoid such variability, one needs to understand the
relation between the EEG signals and user state at a deeper level and in other contexts like music, reading a book, etc.
7. CONCLUSION
The goal of our research is to investigate the application of machine learning on EEG data and obtain the best model that classifies the user states into resting, boredom, flow, and anxiety. Our findings suggest that SVM and RF are the models with better classification accuracies when compared to other machine learning models that we have implemented, specifically k-NN and mlogit. We implemented the best model to
distinguish between flow and non-flow states with an accuracy of 85%, which can be further improved in future research. Also, we tried to extract the important EEG components that can contribute to better classification accuracies based on feature selection methods. Models that include all the EEG components with the theta + alpha + beta band combination generate higher classification rates when compared to other models.
Berta et al. (2013) implemented the SVM model to classify the user states. In this research, we compared four machine learning models to classify the user states. The most informative band, according to Berta el al. (2013), was low beta, whereas in this research alpha and beta bands are the most informative bands. The important brain regions and frequency bands were extracted with the help of feature selection method in this research. Previous studies used various kinds of machine learning techniques to classify user states in different contexts like game, music, and movie. Most of the studies implemented the SVM model for the classification of user states. Also, the literature indicates that few studies implemented the classification including frequency bands. This study compares four different machine learning models with different band combinations to obtain the best classification of user states. This research serves as a starting point for the analysis of
user states using machine learning techniques in the gaming context. To be able to classify user states using advanced techniques, which enables us to understand the relation between the physiological data and the user responses, can bring big changes to the human–computer interaction field. The implementation of a real-time flow
monitoring system with a standard hardware and software system to collect physiological data can become the next generation of analysis of user states and can help the gaming industry immensely.
BIBLIOGRAPHY
Alkan, A., Koklukaya, E., & Subasi, A. (2005). Automatic seizure detection in EEG using logistic regression and artificial neural network. Journal of Neuroscience Methods, 148(2), 167-176.
Berta, R., Bellotti, F., De Gloria, A., Pranantha, D., & Schatten, C. (2013).
Electroencephalogram and physiological signal analysis for assessing flow in games. IEEE Transactions on Computational Intelligence and AI in Games, 5(2), 164-175.
Bhattacherjee, A. (2012). Social science research: Principles, methods, and practices. Textbooks Collection. 3
Bradley, A. P. (1997). The use of the area under the ROC curve in the evaluation of machine learning algorithms. Pattern recognition, 30(7), 1145-1159.
Breiman, L. (2001). Random forests. Machine learning, 45(1), 5-32.
Brunner, P., Bianchi, L., Guger, C., Cincotti, F., & Schalk, G. (2011). Current trends in hardware and software for brain–computer interfaces (BCIs). Journal of neural engineering, 8(2), p. 025001
Chanel, G., Rebetez, C., Bétrancourt, M., & Pun, T. (2008). Boredom, engagement and anxiety as indicators for adaptation to difficulty in games. In Proceedings of the 12th International Conference on Entertainment and Media in the Ubiquitous Era (pp. 13-17). ACM.
Chang, C. C., & Lin, C. J. (2011). LIBSVM: a library for support vector
machines. ACM transactions on intelligent systems and technology, 2(3), 1-27. Chatterjee, D., Sinha, A., Sinha, M., & Saha, S. K. (2016, June). A Probabilistic
Approach for Detection and Analysis of Cognitive Flow. In Bayesian Modeling Applications-Uncertainty in Artificial Intelligence (pp. 44-53).
Caruana, R., & Niculescu-Mizil, A. (2006, June). An empirical comparison of supervised learning algorithms. In Proceedings of the 23rd international conference on Machine learning (pp. 161-168). ACM.
Csikszentmihalyi, M. (1975). Beyond boredom and anxiety. San Francisco: JosseyBass. Well-being: The foundations of hedonic psychology, 134-154. Csikszentmihalyi, M. (1990). Flow: The Psychology of Optimal Experience, Harper &
El Naqa, I., & Murphy, M. J. (2015). What is machine learning? In Machine Learning in Radiation Oncology. Springer, Cham (pp. 3-11).
Garrett, D., Peterson, D. A., Anderson, C. W., & Thaut, M. H. (2003). Comparison of linear, nonlinear, and feature selection methods for EEG signal
classification. IEEE Transactions on neural systems and rehabilitation engineering, 11(2), 141-144.
Goldberger, J., Hinton, G. E., Roweis, S. T., & Salakhutdinov, R. R. (2005). Neighbourhood components analysis. In Advances in neural information processing systems (pp. 513-520).
Goldman, R. I., Stern, J. M., Engel Jr, J., & Cohen, M. S. (2002). Simultaneous EEG and fMRI of the alpha rhythm. Neuroreport, 13(18), 2487
Güneş, S., Polat, K., & Yosunkaya, Ş. (2010). Efficient sleep stage recognition system based on EEG signal using k-means clustering based feature weighting. Expert Systems with Applications, 37(12), 7922-7928.
Hair Jr, J. F. (2007). Knowledge creation in marketing: the role of predictive analytics. European Business Review, 19(4), 303-315
Hartmann, T., & Klimmt, C. (2006). Gender and computer games: Exploring females’ dislikes. Journal of Computer-Mediated Communication, 11(4), 910-931. Joshi, V., Pachori, R. B., & Vijesh, A. (2014). Classification of ictal and seizure-free
EEG signals using fractional linear prediction. Biomedical Signal Processing and Control, 9, 1-5.
Knyazev, G. G. (2007). Motivation, emotion, and their inhibitory control mirrored in brain oscillations. Neuroscience & Biobehavioral Reviews, 31(3), 377-395 Landis, J.R.; Koch, G.G. (1977). “The measurement of observer agreement for
categorical data”. Biometrics 33 (1): 159–174
Lee, C., Wyeth, P., Johnson, D., & Hall, J. (2015, October). Flow during individual and co-operative gameplay. In Proceedings of the 2015 Annual Symposium on Computer-Human Interaction in Play (pp. 103-107). ACM.
Li, M., Jiang, Q., Tan, C. H., & Wei, K. K. (2014). Enhancing user-game engagement through software gaming elements. Journal of Management Information Systems, 30(4), 115-150.
Liang, N. Y., Saratchandran, P., Huang, G. B., & Sundararajan, N. (2006). Classification of mental tasks from EEG signals using extreme learning machine. International journal of neural systems, 16(01), 29-38.
Liaw, A., & Wiener, M. (2002). Classification and regression by random Forest. R news, 2(3), 18-22.
Lin, Y. P., Wang, C. H., Wu, T. L., Jeng, S. K., & Chen, J. H. (2007, October).
Multilayer perceptron for EEG signal classification during listening to emotional music. In TENCON 2007-2007 IEEE Region 10 Conference (pp. 1-3). IEEE. Lin, Y. P., Wang, C. H., Wu, T. L., Jeng, S. K., & Chen, J. H. (2008, October). Support
vector machine for EEG signal classification during listening to emotional music. In Multimedia Signal Processing, 2008 IEEE 10th Workshop on(pp. 127-130). IEEE.
Lotte, F., Congedo, M., Lécuyer, A., Lamarche, F., & Arnaldi, B. (2007). A review of classification algorithms for EEG-based brain–computer interfaces. Journal of neural engineering, 4(2), R1.
Malone, T. W., Lepper, M. R., Snow, R. E., & Farr, M. J. (1987). Aptitude, learning and instruction III: Cognitive and affective process analysis.
Müller-Putz, G. R., Riedl, R., and Wriessnegger, S. C. (2015). Electroencephalography (EEG) as a Research Tool in the Information Systems Discipline: Foundations, Measurement, and Applications. CAIS, 37, 46.
Nacke, L. E. (2017). Games user research and gamification in human-computer
interaction. XRDS: Crossroads, The ACM Magazine for Students, 24(1), 48-51. Nah, F., Eschenbrenner, B., DeWester, D., & Park, S. (2010). Impact of flow and brand
equity in 3D virtual worlds, Journal of Database Management, 21(3), 69-89. Plotnikov, A., Stakheika, N., Schatten, C., Belotti, F., Pranantha, D., Berta, R., & De
Gloria, A. (2012, October). Measuring enjoyment in games through electroencephalogram (EEG) signal analysis. In Proceedings of the 6th
European Conference on Games-Based Learning (ECGBL 2012) (pp. 393-400). Rissler, R., Nadj, M., Li, M. X., Knierim, M. T., & Maedche, A. (2018, April). Got
Flow? Using Machine Learning on Physiological Data to Classify Flow. In Extended Abstracts of the 2018 CHI Conference on Human Factors in Computing Systems, ACM, (p. LBW612).
Sauseng, P., and Klimesch, W. (2008). What does phase information of oscillatory brain activity tell us about cognitive processes? Neuroscience & Biobehavioral
Reviews, 32(5), 1001-1013.
Subasi, A., & Gursoy, M. I. (2010). EEG signal classification using PCA, ICA, LDA and support vector machines. Expert systems with applications, 37(12), 8659-8666.
Taywade, S. A., & Raut, R. D. (2014). A review: EEG signal analysis with different methodologies. In Proceedings of the National Conference on Innovative Paradigms in Engineering and Technology (NCIPET’12) (pp. 29-31).
Teplan, M. (2002). Fundamentals of EEG measurement. Measurement Science Review, 2(2), 1-11.
Tinguely, G., Finelli, L. A., Landolt, H. P., Borbély, A. A., & Achermann, P. (2006). Functional EEG topography in sleep and waking: state-dependent and state-independent features. Neuroimage, 32(1), 283-292.
Tondello, G. F. (2016). An introduction to gamification in human-computer interaction. XRDS: Crossroads, The ACM Magazine for Students, 23(1), 15-17.
Vladimir. C., Veber, B., Lee, J., Shiao, H. T., Patterson, N., Worrell, G. A., & Brinkmann, B. H. (2015, July). Reliable seizure prediction from EEG data. In Neural Networks (IJCNN), 2015 International Joint Conference on (pp. 1-8). IEEE.
Wang, X. W., Nie, D., & Lu, B. L. (2011, November). EEG-based emotion recognition using frequency domain features and support vector machines. In International conference on neural information processing (pp. 734-743). Springer, Berlin, Heidelberg.
Wang, X. W., Nie, D., & Lu, B. L. (2014). Emotional state classification from EEG data using machine learning approach. Neurocomputing, 129, 94-106.
Yelamanchili, T., Nah, F. F.-H., Siau, K., and Chen, L. (2017, May). Neural Correlates of User Experience in Gaming. In Proceedings of the Twelfth Midwest
Association for Information Systems Conference (pp. 1-4), Article 3.
Yelamanchili, T. (2018). Neural correlates of flow, boredom, and anxiety in gaming: An electroencephalogram study, Unpublished MS IST thesis, Missouri University of Science and Technology.
VITA
Chandana Mallapragada was born in Andhra Pradesh, India. In May 2015, she received her bachelor’s degree in Electronics and Communication Engineering from
Gandhi Institute of Technology and Management University, India. She then joined Missouri University of Science & Technology in Fall 2016. She earned a Graduate Certificate in Human Computer Interaction in May 2018 and received her Master of Science degree in Information Science and Technology from Missouri S&T in December 2018.