EHACED IMAGE PROCESSIG TECHIQUES BASED O TECHICAL CHALLEGES OF MAMMOGRAM IMAGE CHARACTERISTICS
By
ZAILAI BI MOHD ORDI
Thesis submitted in fulfilment of the requirements for the degree of
Master of Science
ACKOWLEDGEMET
Syukur Alhamdulillah, with His grace, this thesis has been completed successfully. First of all, I would like to thank my supervising lecturer, Assoc. Prof. Dr. Nor Ashidi Mat Isa for giving me the opportunity to work on this research. He has provided me with valuable knowledge and guidance required for the completion of this thesis. The opportunity to work on this research has enriched my knowledge in image processing field. Experience accumulated during the research will be very beneficial for my future endeavour.
I would also like to thank Dr. Mohd Ezane Aziz and Dr. Lizam Zahina from Hospital Universiti Sains Malaysia, Kubang Kerian who has helped me to gather samples of mammogram image required for this study. The experience working with them has helped me to better understand the mammography technology used for breast cancer diagnosis. In addition to that, it has also helped me to identify technical challenges associated with these images.
Next, I would like to acknowledge the support from Ministry of Higher Education (MOHE) Malaysia towards this research. The fund received through the Fundamental Research Grant Scheme (FRGS) entitled ‘Investigation of Mammogram Images Characteristics for Medical Imaging Application’ has allowed us to acquired resources needed for the completion of this study.
Finally, I would also like to thank my parents Mohd Nordin bin Muhamad and Zaitun binti Din as well as the rest of my family, on whose constant encouragement and
love I have relied throughout my time at the university. I am also grateful to my friends especially Zamani, Fauzi, Fahmi and Subhi for their support and assistance in completing my study. I will cherish the our experience together throughout the time of my study in Universiti Sains Malaysia, Engineering Campus, Nibong Tebal, Pulau Pinang for the rest of my life.
TABLE OF COTETS
ACKNOWLEDGEMENT ...i
TABLE OF CONTENTS...iv
LIST OF TABLES ...ix
LIST OF FIGURES ...xi
LIST OF ABBREVIATIONS ...xix
ABSTRAK...xxi
ABSTRACT...xxiii
CHAPTER 1 - INTRODUCTION 1.1 Introduction ... 2
1.2 Problem Statement and Motivation ... 3
1.3 Objective of the Research ... 5
1.4 Scope of the Research ... 7
CHAPTER 2 - LITERATURE REVIEW
2.1 Introduction ... 11
2.2 Breast Cancer ... 12
2.2.1 Etiology of Breast Cancer ... 13
2.2.2 Detection and Screening ... 15
2.3 Mammography ... 17
2.3.1 Mammography Operation ... 17
2.3.2 Signs and Symptoms Detectable Through Mammography ... 19
2.3.3 Architecture of Computer Aided Diagnosis for Breast Cancer ... 21
2.3.4 Technical Challenges in Mammogram Image ... 22
2.4 Existing Mammogram Image Processing Techniques ... 24
2.4.1 Contrast Enhancement ... 24
2.4.2 Noise Suppression ... 29
2.4.3 Segmentation ... 32
2.5 Summary ... 35
CHAPTER 3 - MAMMOGRAM IMAGE CHARACTERISTICS 3.1 Introduction ... 36
3.2.1 Objective and Scope ... 37
3.2.2 Methodology ... 38
3.2.3 Results and Discussions ... 42
3.3 Noise Characteristics ... 48
3.3.1 Objective and Scope ... 50
3.3.2 Methodology ... 51
3.3.3 Results and Discussions ... 55
3.4 Edge Characteristics ... 57
3.4.1 Objective and Scope ... 59
3.4.2 Methodology ... 61
3.4.3 Results and Discussions ... 64
3.5 Texture Characteristics ... 67
3.5.1 Objective and Scope ... 67
3.5.2 Methodology ... 70
3.5.3 Results and Discussion ... 75
3.6 Summary ... 90
4.2 Background Foreground Segmentation ... 93
4.2.1 Objective and Scope ... 94
4.2.2 Methodology ... 95
4.2.3 Results and Discussions ... 100
4.3 Contrast Enhancement ... 107
4.3.1 Objective and Scope ... 109
4.3.2 Methodology ... 110
4.3.3 Results and Discussions ... 117
4.4 Noise Suppression ... 130
4.4.1 Objective and Scope ... 131
4.4.2 Methodology ... 132
4.4.3 Results and Discussions ... 137
4.5 Calcification Detection ... 145
4.5.1 Objective and Scope ... 146
4.5.2 Methodology ... 147
4.5.3 Results and Discussions ... 154
4.6 Mass Detection ... 161
4.6.1 Objective and Scope ... 162
4.6.3 Results and Discussions ... 176
4.7 Summary ... 186
CHAPTER 5 - CONCLUSION 5.1 Conclusion ... 190
5.2 Suggestion for Future Development ... 194
REFERENCES...196
LIST OF TABLES
Page Table 2.1 Status of efforts on computer aided diagnosis for
mammography (Rangayyan, et al., 2007)
20
Table 2.2 Performance of microcalcification detection methods (Rangayyan, et al., 2007)
34
Table 2.3 Performance of mass detection methods (Rangayyan, et al., 2007)
34
Table 3.1 Summary of statistical measurement for histograms in Figure 3.4(a), (b), (c) and (d)
43
Table 3.2 Summary of statistical measurement for histograms in Figure 3.5
46
Table 3.3 Summary of findings for grey level distribution analysis 48 Table 3.4 Noise variance measurement for 10 randomly selected samples 57 Table 3.5 The distribution summary of gradient measurement 66 Table 3.6 Summary of statistical measurement used in this study 69 Table 3.7 Statistical summary for median measurement 78 Table 3.8 Statistical summary for mean measurement 79 Table 3.9 Statistical summary for standard deviation measurement 81 Table 3.10 Statistical summary for skewness measurement 83 Table 3.11 Statistical summary for smoothness measurement 85 Table 3.12 Statistical summary for uniformity measurement 87
Table 3.13 Statistical summary for entropy measurement 89 Table 4.1 The distribution summary of gradient measurement for DVED
technique
161
Table 4.2 The technique performance with median, mean, standard deviation, smoothness, skewness, uniformity and entropy as measurement
178
Table 4.3 The technique performance with median, mean, uniformity and entropy as measurement
179
Table 4.4 The technique performance with median, mean, uniformity, entropy, boundary variance and boundary ratio as measurement
LIST OF FIGURES
Page Figure 2.1 Cancer cases among women in Malaysia. (a) Age 15 to 49. (b)
Age 50 to 69. (Lim, et al., 2008)
13
Figure 2.2 Reduction of breast cancer mortality rate in Sweden (The Swedish Organised Service Screening Evaluation Group, 2006)
16
Figure 2.3 Block diagram of a mammography unit 18
Figure 2.4 Example of mammogram image for (a) CC view (b) MLO view 19 Figure 2.5 3 stages in computer aided diagnosis for breast cancer. 21 Figure 2.6 Preference of contrast enhancement techniques among
radiologist observation (Sivaramakrishna, et al., 2000) (a) Microcalcification observation (b) Mass
28
Figure 2.7 An example of over enhancement on mammogram image by the CLAHE technique (a) Original image (b) Enhanced using the CLAHE technique
29
Figure 3.1 Manual thresholding tool which was used to divide mammogram image to background and foreground regions
40
Figure 3.2 Mammogram image which has been thresholded manually (a) Original image (b) Background region (c) Foreground region
40
Figure 3.3 1% and 99% percentile were selected as minimum and maximum value for image histogram (a) Histogram for background region (b) Histogram for foreground region
42
Figure 3.4 The grey level distribution for background region (a) Mean measurement (b) Median measurement (c) Minimum value measurement (d) Maximum value measurement
43
Figure 3.5 The grey level distribution for foreground region (a) Mean measurement (b) Median measurement (c) Maximum value measurement
Figure 3.6 The shape of a Poisson distribution approaches the shape of a Gaussian distribution as the mean value increases.
49
Figure 3.7 Histogram is used to divide mammogram image into low, medium and high intensity regions
52
Figure 3.8 A mammogram image being divided into 3 regions based on their intensity level (a) Original image (b) Low intensity region (c) Medium intensity region (d) High intensity region
53
Figure 3.9 Selection of ROI for noise variance measurement (a) An example of a mammogram image (b) Selected ROIs for high, medium and low intensity regions
54
Figure 3.10 Histogram for noise variance distribution 55 Figure 3.11 Impact of Gaussian noise on a simulated image (a) Original
image (b) Added with Gaussian noise with variance of 0.0001
56
Figure 3.12 Calcification image processed using Sobel edge detector (a) Original image (b) Resulting image
58
Figure 3.13 Microcalcifications signature camouflaged by other structures (a) Original image (b) Processed through Sobel edge detector
59
Figure 3.14 Comparison of result from conventional edge detection
techniques for microcalcification detection (a) Sobel (b) Prewitt (c) Roberts (d) Laplacian
60
Figure 3.15 Example of a mammogram image processed using Sobel edge detection technique and thresholded heuristically (a) Original image (b) Resulting image
62
Figure 3.16 Image in Figure 3.14(b) which has been processed through shrink morphological operator
63
Figure 3.17 Histograms showing distribution of gradient measurement for (a) Calcification boundary (b) Other structures
65
Figure 3.18 Procedure for the selection of seed pixel (a) Original image (b) Thresholded pixels with the highest intensity level (c) The seed pixel location
Figure 3.19 Sudden decrease in variance measurement detected during region growing process
74
Figure 3.20 Potential mass segmented through the region growing technique (a) Original image (b) Segmentation of potential mass
75
Figure 3.21 Histograms for the distribution of median measurement (a) Mass (b) Other dense tissue structures
77
Figure 3.22 Histograms for the distribution of mean measurement (a) Mass (b) Other dense tissue structures
79
Figure 3.23 Histograms for the distribution of standard deviation measurement (a) Mass (b) Other dense tissue structures
81
Figure 3.24 Histograms for the distribution of skewness measurement (a) Mass (b) Other dense tissue structures
82
Figure 3.25 Histograms for the distribution of smoothness measurement (a) Mass (b) Other dense tissue structures
84
Figure 3.26 Histograms for the distribution of uniformity measurement (a) Mass (b) Other dense tissue structures
86
Figure 3.27 Histograms for the distribution of entropy measurement (a) Mass (b) Other dense tissue structures
88
Figure 4.1 Edge smoothing process using morphological close and open (a) Jagged edge (b) Smoothened edge
97
Figure 4.2 The gradual process of reducing Tn until the value of m and µ overlaps (a) To=96,Tn=96, m=50, µ=52.0395 (b)To=96, Tn=84, m=49, µ=50.1571 (c)To=96, Tn=72, m=47, µ=47
99
Figure 4.3 Thresholded images which correspond to the gradual reduction in Tn value (a) Original image (b) Tn = 96 (c) Tn = 84 (d) Tn = 72
100
Figure 4.4 Segmentation result of Mammo_1 (a) Manual thresholding (b) MMCS
101
Figure 4.5 Segmentation result of Mammo_2 (a) Manual thresholding (b) MMCS
Figure 4.6 Segmentation result of Mammo_3 (a) Manual thresholding (b) MMCS
102
Figure 4.7 Segmentation result of Mammo_4 (a) Manual thresholding (b) MMCS
102
Figure 4.8 Segmentation result of Mammo_5 (a) Manual thresholding (b) MMCS
103
Figure 4.9 The distribution of threshold value obtained through (a) Manual thresholding technique (b) MMCS
105
Figure 4.10 Histogram of a sample image with background foreground threshold at intensity level 7
106
Figure 4.11 Small difference in the segmentation result of Mammo_6 between (a) Manual thresholding technique with threshold value 24 (b) MMCS technique with threshold value 7
106
Figure 4.12 The percentage of difference between the proposed MMCS technique and the manual thresholding technique
107
Figure 4.13 Histogram normalization performed on sample image
Mammo_7c (a) Original image (b) Histogram normalized image 113
Figure 4.14 Histogram for sample image Mammo_7c (a) Histogram for original image (b) Histogram for histogram normalized image
113
Figure 4.15 Result of the linear contrast enhancement technique performed at intensity level 150 (a) Resulting image (b) Histogram of the resulting image
115
Figure 4.16 Result of the non-linear contrast enhancement technique performed at intensity level 150 (a) Resulting image (b) Histogram of the resulting image
115
Figure 4.17 Result of the midtone shift contrast enhancement technique performed at intensity level 150 (a) Resulting image (b) Histogram of the resulting image
Figure 4.18 Resulting images for intensity level range from 100 to 240 with incremental step size 20. The images have been enhanced at intensity levels: (a) 100 (b)120 (c)140 (d)160 (e)180 (f)200 (g)220 (h)240
116
Figure 4.19 Result of the linear contrast enhancement technique on sample image Mammo_8c (a) At intensity level 135 (b) At intensity level 250
118
Figure 4.20 Result of the non-linear contrast enhancement technique on sample image Mammo_8c (a) At intensity level 150 (b) At intensity level 255
118
Figure 4.21 Result of the midtone shift contrast enhancement technique on sample image Mammo_8c (a) At intensity level 140 (b) At intensity level 200
119
Figure 4.22 Comparison of contrast enhancement techniques (a) Original sample image Mammo_8c (b) Linear contrast enhancement technique (c) Non-linear contrast enhancement technique (d) Midtone shift contrast enhancement technique (e) Histogram equalization technique (f) CLAHE technique
121
Figure 4.23 Comparison of contrast enhancement techniques (a) Original sample image Mammo_9c (b) Linear contrast enhancement technique (c) Non-linear contrast enhancement technique (d) Midtone shift contrast enhancement technique (e) Histogram equalization technique (f) CLAHE technique
123
Figure 4.24 Comparison of contrast enhancement techniques (a) Original image (b) Linear contrast enhancement technique (c) Non-linear contrast enhancement technique (d) Midtone shift contrast enhancement technique (e) Histogram equalization technique (f) CLAHE technique
125
Figure 4.25 Sample image Mammo_8c enhanced using non-linear contrast enhancement technique at intensity level (a) 140 (b) 150 (c) 160 (d) 170 (e) 180 (f) 190 (g) 200 (h) 210 (i) 220 (j) 230 (k) 240 (l) 250
127
Figure 4.26 Sample image Mammo_9c enhanced using non-linear contrast enhancement technique at intensity level (a) 140 (b) 150 (c) 160 (d) 170 (e) 180 (f) 190 (g) 200 (h) 210 (i) 220 (j) 230 (k) 240 (l) 250
Figure 4.27 Sample image Mammo_7c enhanced using non-linear contrast enhancement technique at intensity level (a) 140 (b) 150 (c) 160 (d) 170 (e) 180 (f) 190 (g) 200 (h) 210 (i) 220 (j) 230 (k) 240 (l) 250
129
Figure 4.28 3×3 neighbourhood window which corresponds to Equation 4.8 135 Figure 4.29 Exposing the noise effect using Roberts edge detection
technique (a) Original sample image Mammo_10c (b) Resulting image after being processed through the edge detection
technique
137
Figure 4.30 The result of noise suppression techniques on sample image Mammo_10c (a) Adaptive Wiener Filter (b) MAAWF
138
Figure 4.31 The result of noise suppression techniques on sample image Mammo_11c (a) Original image (b) Before being processed with noise suppression technique (c) Processed with Adaptive Wiener Filter (d) Processed with MAAWF
140
Figure 4.32 The result of noise suppression techniques on sample image Mammo_12c (a) Original image (b) Before being processed with noise suppression technique (c) Processed with Adaptive Wiener Filter (d) Processed with MAAWF
141
Figure 4.33 Result of RMSE measurements from noise variance 0.00005 to 0.005
143
Figure 4.34 Result of RMSE measurements from noise variance 0.00395 to 0.005
144
Figure 4.35 Reduction of noise variance as the noise variance increases from 0.00005 to 0.005
145
Figure 4.36 (a) 7×7 simulated image (b) The corresponding pixel value 149 Figure 4.37 The simulated image after being processed through mean filter
(a) The resulting image (b) The corresponding pixel intensity value
150
Figure 4.38 The local variance of the original image 150 Figure 4.39 The local variance for the mean filtered image 151
Figure 4.40 The difference in local variance 152 Figure 4.41 The resulting edge detected through the DVED technique 153 Figure 4.42 Edge detection performed on sample image Mammo_13c (a)
Original image (b) Sobel technique (c) Prewitt technique (d) Roberts technique (e) Laplacian technique (f) DVED technique
155
Figure 4.43 Edge detection performed on sample image Mammo_14c (a) Original image (b) Sobel technique (c) Prewitt technique (d) Roberts technique (e) Laplacian technique (f) DVED technique
156
Figure 4.44 Edge detection performed on sample image Mammo_15c (a) Original image (b) Sobel technique (c) Prewitt technique (d) Roberts technique (e) Laplacian technique (f) DVED technique
158
Figure 4.45 Result of DVED measurements (a) Calcification boundary (b) Other tissue structures
160
Figure 4.46 Outline drawn around potential mass 167
Figure 4.47 Histograms for standard deviation measurement with PDF function line (a) Mass (b) Other dense tissue structures
168
Figure 4.48 Histograms for smoothness measurement with PDF function line (a) Mass (b) Other dense tissue structures
169
Figure 4.49 Histograms for skewness measurement with PDF function line (a) Mass (b) Other dense tissue structures
169
Figure 4.50 Histograms for uniformity measurement with PDF function line (a) Mass (b) Other dense tissue structures
170
Figure 4.51 PDF functions for median measurements 171
Figure 4.52 PDF functions for mean measurements 171
Figure 4.53 PDF functions for standard deviation measurements 172 Figure 4.54 PDF functions for smoothness measurements 172 Figure 4.55 PDF functions for skewness measurements 173
Figure 4.56 PDF functions for uniformity measurements 173
Figure 4.57 PDF functions for entropy measurements 174
Figure 4.58 Score result using median, mean, standard deviation,
smoothness, skewness, uniformity and entropy as measurement (a) Mass (b) Other tissue structures
177
Figure 4.59 Score result using median, mean, uniformity and entropy as measurement (a) Mass (b) Other tissue structures
179
Figure 4.60 Score result using median, mean, uniformity, entropy, boundary variance and boundary ratio as measurement (a) Mass (b) Other tissue structures
182
Figure 4.61 Resulting images where the mass boundary is clearly
represented in sample images: (a) Mammo_16 (b) Mammo_17 (c) Mammo_18
184
Figure 4.62 Resulting images where the mass boundary is not accurately represented in sample images: (a) Mammo_19 (b) Mammo_20
184
Figure 4.63 High density tissue incorrectly identified as mass in sample images (a) Mammo_21 (b) Mammo_22
185
Figure 4.64 Structure in pectoral area incorrectly identified as mass in sample images: (a) Mammo_23 (b) Mammo_24
LIST OF ABBREVIATIOS
ANCE – Adaptive Neighbourhood Contrast Enhancement BRCA1 – Breast Cancer Gene 1
BRCA2 – Breast Cancer Gene 2
CC – Craniocaudal
CLAHE – Contrast Limited Adaptive Histogram Equalization
CT – Computer Tomography
DVED – Delta Variance Edge Detection
DWCE – Density Weighted Contrast Enhancement FFDM – Full Field Digital Mammography
HIW – Histogram Based Intensity Windowing
IQR – Interquartile Range
MAAWF – Mean Approximation Adaptive Wiener Filter
MCC – Microcalcification
MCS – Moving Contrast Sweep
MLO – Mediolateral Oblique
MMCS – Mean Median Crossing Segmentation MMIW – Mixture Model Intensity Windowing
MRI – Magnetic Resonance Imaging PDF – Probability Density Function PET – Positron Emission Tomography
Q1 – Quartile 1
Q3 – Quartile 3
RMSE – Root Mean Squared Error
PERLUASA TEKIK PEMPROSESA IMEJ BERDASARKA CABARA TEKIKAL BAGI CIRI-CIRI IMEJ MAMMOGRAM
ABSTRAK
Kanser payu dara adalah jenis kanser yang paling kerap dilaporkan di Malaysia. Lebih 30% daripada jumlah keseluruhan kes kanser di kalangan wanita Malaysia yang dilaporkan, adalah terdiri daripada kanser payu dara. Pada ketika ini, mammografi adalah salah satu daripada teknik terbaik untuk pengesanan kanser payu dara. Walaubagaimanapun, imej yang dihasilkan menerusi mammografi sering dicemari hingar dan mempunyai kadar perbezaan tahap kecerahan piksel yang rendah menyebabkan tanda-tanda awal kanser payu dara (iaitu mikrokalsifikasi dan kelompokan tisu) sukar dikesan. Oleh itu, terdapat banyak kajian yang telah dijalankan untuk membangunkan teknik-teknik pemprosesan imej bagi membantu pengesanan tanda-tanda awal tersebut. Walaubagaimanapun, kebanyakan teknik yang dibangunkan tidak mengambil kira ciri-ciri teknikal imej mammogram secara terperinci. Oleh sebab itu, kualiti imej yang telah ditingkatkan dari satu aspek mungkin akan mengalami kemerosotan dari aspek yang lain. Menerusi kajian ini, pembangunan teknik-teknik pemprosesan imej baru akan dibuat berdasarkan penemuan ciri-ciri teknikal imej mammogram. Proses mengenal pasti ciri-ciri imej mammogram merangkumi analisis taburan tahap kelabu, hingar, tepi dan tekstur. Pemahaman terperinci ke atas ciri-ciri ini akan menyediakan asas yang kukuh di dalam kajian ini untuk pembangunan teknik-teknik pemprosesan imej baru. Teknik-teknik-teknik pemprosesan imej baru yang diketengahkan menerusi kajian ini termasuklah algoritma peningkatan kadar perbezaan tahap kecerahan (iaitu “Moving Contrast Sweep”), penyekatan hingar (iaitu “Mean Approximation Adaptive Wiener Filter”) dan pembahagian kawasan (iaitu “Mean Median Crossing Segmentation”). Selain itu, suatu algoritma pengesanan tepi (iaitu “Delta Variance Edge Detection”) yang baru juga telah dibangunkan untuk mengesan
kehadiran mikrokalsifikasi. Suatu teknik pengelasan kelompakan tisu berdasarkan ciri-ciri tekstur juga telah dibangunkan. Berdasarkan analisis yang dijalankan, didapati prestasi teknik "Mean Approximation Adaptive Wiener Filter" dan "Delta Variance Edge Detection" adalah lebih baik daripada teknik terdahulu. Prestasi "Mean Median Crossing Segmentation" dan "Moving Contrast Sweep" adalah setanding teknik yang sedia ada, tetapi mempunyai pendekatan yang lebih praktikal. Teknik pengelasan kelompakan tisu berdasarkan ciri-ciri tekstur menunjukkan potentsi yang besar tetapi masih mempunyai banyak ruang untuk diperbaiki. Teknik-teknik pemprosesan imej baru yang telah dibangunkan berdasarkan pemahaman mendalam ke atas ciri-ciri imej mammogram di dalam kajian ini dipercayai dapat menyediakan asas yang kukuh bagi pembangunan aplikasi pengimejan perubatan pada masa hadapan.
EHACED IMAGE PROCESSIG TECHIQUES BASED O TECHICAL CHALLEGES OF MAMMOGRAM IMAGE
CHARACTERISTICS ABSTRACT
Breast cancer is the leading type of cancer in Malaysia. More than 30% of total cancer case reported among women in Malaysia is made up of breast cancer. At the moment, one of the best known techniques used for breast cancer detection is mammography. Unfortunately, the image produced through mammography is normally noisy and low in contrast making detection of early signs of breast cancer (i.e. microcalcification and mass) difficult. Therefore, a lot of studies have been conducted to develop image processing techniques which would help in the detection of these early signs. However, most of these techniques were developed without a thorough study upon the mammogram image technical characteristics. Hence, an image which has been enhanced from one aspect may end up worst from another aspect. In this study, new image processing techniques have been developed based on findings which have been gathered from characterization of mammogram images. The characterization process covered the analysis of grey level distribution, noise, edge and texture. Detailed understanding of these characteristics, provide a solid basis for the development of new image processing techniques in this study. The new techniques brought forth through this study include contrast enhancement (i.e. Moving Contrast Sweep), noise suppression (i.e. Mean Approximation Adaptive Wiener Filter) and segmentation algorithm (i.e. Mean Median Crossing Segmentation). In addition to that, a new edge detection algorithm (i.e. Delta Variance Edge Detection) has also been developed to assist in microcalcification detection. Furthermore, a new classification system which is based on texture characteristic has also been developed for mass detection. Based on the analysis, it has been found that the Mean Approximation Adaptive Wiener Filter and
Delta Variance Edge Detection techniques perform better than their predecessor. The performance of Mean Median Crossing Segmentation and Moving Contrast Sweep techniques is equivalent to existing techniques but they can be implemented through a more practical approach. The mass detection technique through statistical texture analysis demonstrates a lot of potential but still has room for improvement. It is hoped that, the new image processing techniques developed through solid understanding of mammogram image characteristic in this study could provide a strong foundation for the development of medical imaging applications in the future.
CHAPTER 1 ITRODUCTIO
1.1 Introduction
Breast cancer is the most common type of cancer among women in Malaysia. It is also one of the most common types of cancer affecting women worldwide. Since genetic mutation which is the major cause of breast cancer could not be entirely avoided, early detection has been identified as one of the most effective method to reduce mortality rate among breast cancer patients. Therefore, a number of screening programs have been deployed in the United States of America as well as in European countries for early detection of breast cancer.
These screening programs have achieved some level of success in reducing mortality rate among breast cancer patients. At the heart of these screening programs is a technique called mammography which utilizes low dose X-ray to reveal the internal breast tissue structures. Even though mammography is known as one of the best techniques for breast cancer detection to date, it still has its own shortcomings. Low contrast and the presence of noise are technical challenges which make observation of breast cancer signs within the resulting mammogram image difficult. Furthermore, the presence of early signs such as clusters of microcalcification (MCC) and masses may not be clearly visible within mammogram image. Clusters of MCC tend to reside within high density tissues which make it difficult to set them apart from the background. Besides that, observation of mass can also be very challenging due to its obscure boundary which appears in smooth gradient manner. These are the major challenges faced by radiologists and doctors in interpreting mammogram images for breast cancer signs.
As a result, a lot of studies have been conducted in image processing field for mammogram image enhancement. However, not all the studies put a lot of focus in understanding the characteristics of mammogram image. Thus, as the technique successfully enhances the image from one aspect, it may make it worst from another. Therefore, the approach which will be used in this study is to understand the characteristics of mammogram image. Then, technical challenges associated with the characteristics will be identified. Finally, new image processing techniques will be developed based on the identified challenges. It is hoped that the new image processing techniques which will be presented in this study will be useful in the development of medical imaging applications in the future.
1.2 Problem Statement and Motivation
Low contrast is one of the fundamental challenges in mammogram image. It constitutes that the difference between the intensity values of a pixel with the neighbouring pixels is small. Human eye may not be able to distinguish the difference if the value is too small to be detected by human eyes receptor cells (Russ, 2007). As a result, subtle details such as the presence of microcalcification (MCC) within high density tissue will be left visually undetected. Furthermore, boundary for masses which normally appears in smooth gradient manner will not be prominently visible for observation. Currently, quite a number of studies have been conducted towards the development of contrast enhancement technique to deal with this problem. However, not all of them are suitable for the job. Improper use of contrast enhancement technique will aggravate the presence of noise in the image. Furthermore, some contrast enhancement techniques may produce overenhanced
mammogram images which are less preferred by radiologists and doctors (Sivaramakrishna, et al., 2000).
The presence of noise is another fundamental challenge in mammogram image. Film grain and the nature of X-ray photons are the 2 main culprits which lead to the presence of noise in mammogram image (Pisano, et al., 2000). These 2 factors are native to the existing mammography technology and cannot be entirely avoided. Hence, noise suppression technique is required to smoothen out the grainy texture produced by the presence of noise. Similar to contrast enhancement technique, improper use of noise suppression technique may lead to other types of problem. Excessive noise suppression will destroy fine details within the image, while inadequate smoothing will leave the grainy noise texture intact.
The presence of cluster of MCC has long been identified as an early sign of breast cancer because it indicates the presence of rapidly dividing cells (Stephan, 2007). The MCC is recognizable through its hard boundary signature which represents abrupt changes in pixel value. This type of signature is easily exposed through the use of edge detection techniques (Gonzalez & Woods, 2002). However, MCC is not the only signature being detected by conventional edge detection techniques. Abrupt changes in pixel value due to other structures within mammogram image will also produce similar result. As a result, the MCC boundary signature detected by conventional technique tends to be camouflaged by the presence of other structures within mammogram image.
The presence of mass is another strong sign for breast cancer. However, in a mammogram image the boundary for mass is normally obscure and appears in a smooth gradient manner. As a result, segmentation and identification of the mass can
be very challenging. Therefore, a lot of studies have been conducted to develop image processing techniques which can be used for mass detection. Yet, despite many attempts in the past, the false positive rate for existing mass detection techniques are still relatively high in comparison to MCC detection techniques (Rangayyan, et al., 2007). An accurate mass detection technique is still elusive until this day.
These challenges are the motivation to continually develop new image processing techniques for mammogram image enhancement. The approach which will be taken in this study is to identify technical challenges of mammogram image enhancement through characteristic analysis. Then, new image processing techniques will be developed based on the identified challenges. Thus, the resulting image processing techniques will fit much better into the unique requirements of mammogram image enhancement.
1.3 Objective of the Research
Generally, the objective of this study can be divided into two. The first objective is to identify technical challenges associated with mammogram image characteristics. The second objective is to develop new image processing techniques based on the identified challenges.
In the first objective, four characteristics of mammogram image will be analyzed. They are:
• Grey level distribution
• Texture
The first two characteristics of mammogram image which will be analyzed in this study are the grey level distribution and noise. These characteristics are closely related to the two fundamental challenges in mammogram image which are low contrast and noise. The next two mammogram image characteristics which will be covered in this study are closely related to two of the breast cancer signs. They are the edge characteristic for MCC detection and the texture characteristic for mass detection. In this study, statistical method will be used for the characteristics analysis. The technical challenges identified through the analysis will be used as the basis for the development of new image processing techniques.
In the second objective, new image processing techniques will be presented. They are:
• Mean Median Crossing Segmentation (MMCS) technique
• Moving Contrast Sweep (MCS) technique
• Mean Approximation Adaptive Wiener Filter (MAAWF) technique
• Delta Variance Edge Detection (DVED) technique
• Statistical texture analysis technique based on probability density function (PDF)
The theory of operation and methodology of the new image processing techniques will be disclosed. Then, the performance of the new image processing techniques will be analyzed and presented. Statistical method will be used for the performance analysis of each technique.
1.4 Scope of the Research
The scope of the research covers the characteristic study of mammogram image. Based on the characteristic study, technical challenges associated with mammogram image will be identified. Then, new image processing techniques will be developed based on these challenges. The characteristic study covers grey level distribution, noise, edge and texture characteristics for mammogram image.
The grey level distribution analysis will cover the characteristic of the background and foreground regions of the mammogram image. In this study, grey level distribution for 960 mammogram images will be measured. Minimum and maximum intensity values of both background and foreground regions will be recorded and analyzed. Next, the distribution of threshold value between both regions will be observed. Finally, mean and median values which summarize the grey level distribution of both regions will be measured and studied. Based on the collected data, challenges associated with grey level distribution of mammogram image will be identified.
The study of noise characteristic will analyze the nature of noise within the mammogram image. A sample of 960 mammogram images will be used for noise variance measurement. 3 measurements will be recorded from each sample which covers the high, medium and low intensity regions. Then, the noise variance data will be studied and analyzed. Finally, challenges which may affect the performance of existing noise suppression techniques will be identified.
In the study of edge characteristic, edge pixels belonging to MCC will be analyzed. Gradient measurement using conventional edge detection method will be recorded from these pixels. The result will be compared against the measurement of
edge pixels for other structures within mammogram image. Then, the challenges which may affect the effectiveness of the existing edge detection method in exposing MCC boundary pixels will be identified.
In the study of texture characteristic, mass texture will be compared against the texture of other tissue structures within mammogram image. Statistical texture measurements will be used for this analysis. The result will be used to determine whether any of the texture measurement can be used effectively to differentiate mass from other tissue structures within mammogram image. Then, the challenges associated with texture characteristic will be identified and studied.
Once the characteristic studies have been completed and the challenges associated with each characteristic have been identified, the findings will be used to develop new image processing techniques. The theory of operation and the methodology of new image processing techniques resulting from these findings will be explained in detail. Then, the performance of each new image processing technique will be analyzed and discussed.
The sample mammogram images which will be used in this study are taken from Hospital Universiti Sains Malaysia, Kubang Kerian. The sample comprises of both normal mammogram images and those which have been confirmed positive for breast cancer signs by radiologists and doctors. The implementation of measurements which will be used during characteristic study will be done using MATLAB. Similarly, the implementation of the new image processing techniques presented in this study will also be done using MATLAB. This tool is selected as it helps to simplify the implementation of experiments which are required in this study. By using MATLAB, the researcher will no longer be burden with the tedious
programming tasks such as initializing variable and constructing arrays which exist in programming languages such as C. Therefore, the mathematical algorithm for the new image processing techniques can be prototyped and tested within a much shorter timeframe.
1.5 Thesis Outline
This thesis is divided into 5 chapters. The first chapter is the introduction chapter. The problem statement as well as the motivation behind this study will be discussed in this chapter. The objective and the scope of the study are also covered in this chapter.
The second chapter is focused on the literature review covered in this study. It includes general information on breast cancer and the importance of early detection for the patients. Basic understanding of mammography technology as well as its capability is also covered in this chapter. Then, the background study focuses on the limitations of mammogram image produced through mammography which justify the need of image processing techniques. Existing image processing techniques used for mammography will be discussed in this chapter covering both their strengths and weaknesses.
The characteristic study on mammogram image will be covered in the third chapter. Four characteristics will be analyzed in the study, namely, grey level distribution, noise, edge and texture characteristics. The methodology used to measure each characteristic will be explained in this chapter. Then, it is followed by result analysis and discussion. Technical challenges associated with mammogram image will be identified based on the analysis performed on these characteristics. The
findings from this chapter will be the basis for the development of new image processing techniques for mammogram image.
The fourth chapter covers the new image processing techniques which will be developed based on the technical challenges identified in the third chapter. The theory of operation and methodology of each new technique will be covered in this chapter. Then, it is followed by performance analysis which will be conducted on each new image processing technique. Finally the result of the analysis will be discussed covering both the strengths and weaknesses of each new image processing technique.
Chapter 5 is the final chapter in this thesis. This chapter concludes the findings in this study. Summarization of findings both from the characteristic studies and the analysis of the new image processing techniques will be included in this chapter. The conclusion will also include suggestion and recommendation for future research.
CHAPTER 2 LITERATURE REVIEW
2.1 Introduction
Breast cancer is the leading type of cancer affecting women in Malaysia. It is also one of the major causes of cancer death among women worldwide. Breast cancer is mainly caused by genetic mutation which could not be entirely avoided by prevention programs and adoption of healthy lifestyle. Therefore, early detection through effective screening program is vital in the effort to reduce mortality rate among breast cancer patient. Currently, mammography is the most popular and effective technique for breast cancer screening and diagnosis. However, technical challenges such as low contrast, noise and obscure boundary prevent radiologists and doctors from extracting maximum amount of details from the mammogram image. As a result, potential benefits from mammography technology could not be exploited to the fullest. Hence, a lot of studies have been conducted to overcome these technical challenges through image processing techniques using computing technology. Some studies have shown promising results, yet there are still a lot of room for improvement in some areas.
This chapter covers the literature review on breast cancer, mammography and existing image processing techniques applied to mammogram image. General literature on breast cancer is discussed in Section 2.2. This section is divided into two subsections. Section 2.2.1 focuses on etiologies of breast cancer, while Section 2.2.2 talks about existing detection and screening methods. Section 2.3 centres on mammography which is currently the most effective technique for breast cancer detection. This section is divided into three subsections. Basic operation for
mammography is explained in Section 2.3.1. Then it is followed by Section 2.3.2 which describes the list of signs and symptoms detectable through mammography. Technical challenges associated to mammogram image are identified in Section 2.3.3. Existing image processing techniques used for mammogram image are covered in Section 2.4. It is divided into 3 subsections. Section 2.4.1 covers existing contrast enhancement for mammogram image. Next is Section 2.4.2 where both conventional and advanced noise suppression techniques are discussed. The third subsection, Section 2.4.3 is focused on segmentation techniques used to isolate calcifications and masses within mammogram image. Finally, the content of this chapter is summarized in Section 2.5.
2.2 Breast Cancer
Breast cancer is the leading cause of cancer death among women in America (Licker, et al., 2007). It is also most common type of cancer among women in Malaysia. Based on a report by National Cancer Registry of Malaysia (Lim, et al., 2008) which was published in 2008, more than 30% of total cancer incident among women in Malaysia is made up of breast cancer. Figure 2.1 shows the breakdown of cancer cases among women in Malaysia. The first chart shows that 39.1% out of total cancer case among women from age 15 to 49 is made up of breast cancer. The second chart shows that breast cancer contributed 31.9% out of total cancer case among women from age 50 to 69 in Malaysia.
(a)
(b)
Figure 2.1: Cancer cases among women in Malaysia. (a) Age 15 to 49. (b) Age 50 to 69. (Lim, et al., 2008)
2.2.1 Etiology of Breast Cancer
Cancer is a condition where a group of cells starts dividing out of control. These cancer cells would invade healthy tissue turning them into cancer cells as well (American Cancer Society, 2009). Based on a report by American Cancer Society in 2005 (Smigal, et al., 2005), there are 3 factors which could lead to breast cancer. The
Breast Cancer Gene 1 (BRCA1) and Breast Cancer Gene 2 (BRCA2) genes from his or her parents. The second factor is hormonal imbalance, which happens to patient who experience very early period or very late menopause. A person who is undergoing hormone therapy is also at a higher risk of contracting breast cancer. The third factor as identified by the report is related to lifestyle and dietary. Obesity, lack of exercise, high alcohol intake and even smoking have been identified as potential cause of breast cancer.
An article from eMedicineHealth (Buechler & Buechler, 2007) also agrees with the three factors as identified in the report by American Cancer Society. Furthermore, the authors have identified 2 more potential factors which could lead to breast cancer. There is a potential that some benign breast changes which normally would not pose any threat to the patient could develop into malignant cancer cells. Besides that, the authors also pointed out that a patient who is undergoing a continuous radiation therapy for some other illness is also more susceptible to breast cancer.
A book written by Md. Noor (2008) also agrees with those 5 factors and added 2 more potential causes of breast cancer. Patients, who previously had breast cancer but have recovered, have a higher chance of contracting the disease again. Reoccurrence of the disease is common among breast cancer patient. Furthermore, breast cancer could also be caused by other type of cancer. Patients who are already suffering from other type of cancer have a strong likelihood of developing breast cancer.
In summary, all 3 sources agreed that genetic mutation is the immediate cause of breast cancer. The mutation causes healthy cells to grow into malignant cells. In
addition to that, these sources also agreed on the 3 main factors which lead to this genetic mutation. The genetic mutation could be inherited from the parents, due to hormonal imbalance or due to dietary and lifestyle. It is obvious that some of these factors could not be avoided especially the hereditary factor. Therefore, it is imperative to have an effective detection method for breast cancer. Prompt detection would ensure the patient could receive treatment while the cancer is still in its early stage.
2.2.2 Detection and Screening
It has been established that early detection of breast cancer through effective screening program could help in the reduction of mortality rate. The survival rate of the patient is significantly higher if the breast cancer is detected at an early stage (Singhal, et al., 2008). The screening program implemented since early 90s is believed to be an important factor in the steady decline of breast cancer mortality rate (Smigal, et al., 2005). A study in Sweden (The Swedish Organised Service Screening Evaluation Group, 2006) has recorded up to 40% of reduction in mortality rate due to the screening program implemented. Figure 2.2 shows the reduction in breast cancer mortality rate in Sweden through mammography screening program. A survey was conducted at multiple locations in Sweden. Significant reductions in actual death cases as compared to expected death cases have been observed at all locations.
Figure 2.2: Reduction of breast cancer mortality rate in Sweden Organised Service Screening Evaluation Group, 2006)
The report by American Cancer Society in 2005 (Smigal, 2 of the most popular detection method
examination through palpation. This includes both breast self examination and clinical based examination. The second method is mammography where low dose X ray is passed through the
these 2 methods, the article in eMedicineHealth (Buechler & Buechler, 2007) listed 3 more methods for breast cancer detection. They are biopsy, magnetic resonance imaging (MRI) and ultrasound
more methods which are computed tomography (CT) scan and positron emission tomography (PET) scan. However, these methods are normally used for second level diagnostic because their equipments are not as w
mammography.
Generally, all sources agree that mammography is the most popular method for breast cancer screening after physical breast examination through palpation. It has a clear advantage over physical breast exami
Figure 2.2: Reduction of breast cancer mortality rate in Sweden (The Swedish Organised Service Screening Evaluation Group, 2006)
The report by American Cancer Society in 2005 (Smigal, et al., 2005) identified popular detection methods for breast cancer. First is the physical breast examination through palpation. This includes both breast self examination and clinical based examination. The second method is mammography where low dose X ray is passed through the breast tissue to view internal structure of the breast. Besides these 2 methods, the article in eMedicineHealth (Buechler & Buechler, 2007) listed 3 more methods for breast cancer detection. They are biopsy, magnetic resonance imaging (MRI) and ultrasound. Meanwhile, a book by Md. Noor (2008) identified 2 more methods which are computed tomography (CT) scan and positron emission tomography (PET) scan. However, these methods are normally used for second level diagnostic because their equipments are not as widely available in local hospitals as
, all sources agree that mammography is the most popular method for breast cancer screening after physical breast examination through palpation. It has a clear advantage over physical breast examination due to its ability to detect 80%
(The Swedish
, 2005) identified for breast cancer. First is the physical breast examination through palpation. This includes both breast self examination and clinical based examination. The second method is mammography where low dose
X-breast tissue to view internal structure of the X-breast. Besides these 2 methods, the article in eMedicineHealth (Buechler & Buechler, 2007) listed 3 more methods for breast cancer detection. They are biopsy, magnetic resonance Meanwhile, a book by Md. Noor (2008) identified 2 more methods which are computed tomography (CT) scan and positron emission tomography (PET) scan. However, these methods are normally used for second level idely available in local hospitals as
, all sources agree that mammography is the most popular method for breast cancer screening after physical breast examination through palpation. It has a nation due to its ability to detect 80% to
90% of cases where physical symptoms such as lumps are not present (Smigal, et al., 2005). However, mammography result alone is not 100% accurate. It still needs to be confirmed through a secondary method such as biopsy (Licker, et al., 2007; Md. Noor, 2008).
2.3 Mammography
Mammography is one of the best breast cancer detection methods to date. Mammography offers the greatest level of sensitivity and it has been widely accepted as an effective screening program for many years (Maggio, 2008).
2.3.1 Mammography Operation
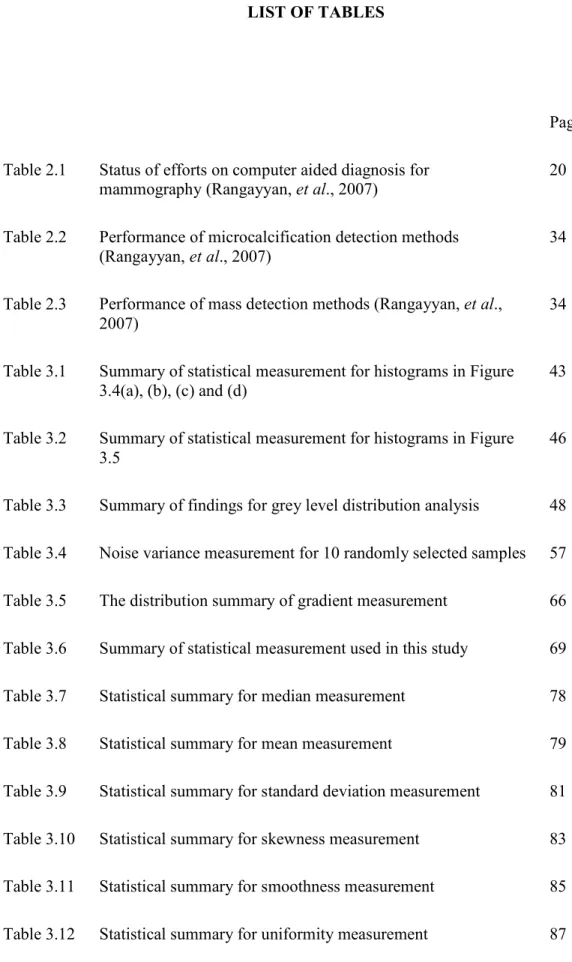
The theory of operation for mammography is quite similar to abdominal X-ray equipment (Harris, 2002). The difference is mammography is using a much lower dose X-ray because it is intended for soft tissue in the breast. Abdominal X-ray normally utilizes a higher dose X-ray because it is intended for higher density tissues and bone structures in the abdomen area. Figure 2.3 shows a basic diagram of film based mammography unit. It is made up of 3 basic constructions, namely, X-ray source, compression paddle and mammography film holder.
Figure 2.3: Block diagram of a mammography unit
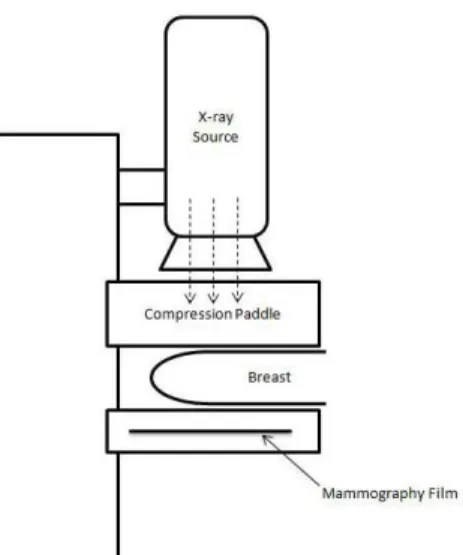
Based on article from Radiology Info (Radiology Society of North America, 2008), the first step in mammography operation is to place and compress breast in the mammography unit. This step is necessary in order to even out the breast thickness as well as to minimize motion which would cause blurring in the resulting image. Then, low dose X-ray from the X-ray source is passed through the breast tissue. There are variations in the level X-ray absorption for different parts of the body. Dense tissue tends to absorb more X-ray compared to softer tissue. This process produces an image where high density tissue would appear as bright and low density tissue would appear as dark on the X-ray film. Finally, resulting image on the film will be interpreted by radiologist and doctor. Normally, 2 mammography images will be taken for each breast. First is from craniocaudal (CC) view which is a top to bottom view. The other is from mediolateral oblique (MLO) view which is a side view. Figure 2.4 (a) and (b) show an example of mammogram image from CC and MLO views respectively.
(a) (b)
Figure 2.4: Example of mammogram image for (a) CC view (b) MLO view
2.3.2 Signs and Symptoms Detectable Through Mammography
Generally, signs and symptoms detectable through mammography can be classified into 4. They are the presence of calcification, the presence of mass, bilateral asymmetry and architectural distortion (Rangayyan, et al., 2007).
Calcification is defined as deposit of calcium within tissue. Cluster of microcalcifications are tiny specks of calcium deposit and they are normally found around rapidly dividing cells. Rapidly dividing cells could indicate early signs of breast cancer (Stephan, 2007). Mass refers the presence of high density tissue within a small locality. A mass with irregular shape and spiculated boundary is a compelling signature of a malignant tumour. This is a strong sign of breast cancer (Popli, 2001).
is a significant different in the presence of high density tissue, duct or other structures between left and right breast. Architectural distortion is a condition where there is a distortion in the structure of the breast without the presence of any visible mass (Popli, 2001). The presence of such condition could indicate early signs of breast cancer. However, a distortion which is due to surgery or trauma should not be considered as an early signs.
A lot of efforts have been put in place to increase the effectiveness of mammography in signs and symptoms detection through the use of computer technology. Computer aided diagnosis have been found effective in enhancing mammogram image, detection and classification of subtle signs. Table 2.1 summarized the status of computer aided diagnosis efforts for mammography. Result of studies on microcalcification detection is considered satisfactory but more efforts are required for mass detection. Besides that, more studies related to bilateral asymmetry and architectural distortion are still desired.
Table 2.1: Status of efforts on computer aided diagnosis for mammography (Rangayyan, et al., 2007)
Efforts Status
Microcalcification Detection
Considered satisfactory
Mass Detection Detection capability is satisfactory but number of false positive is still high.
Bilateral Asymmetry More methods are desired. Architectural
Distortion
2.3.3 Architecture of Computer Aided Diagnosis for Breast Cancer
Based on a study by Rangayyan et al. (2007), the architecture of computer aided diagnosis for breast can be divided into 3 stages. Figure 2.5 shows the 3 stages in the computer aided diagnosis for breast cancer. The first stage is image processing, where the mammogram image will be enhanced to expose features of interest which are useful for breast cancer diagnosis. The second stage is feature extraction, where the regions containing the feature of interest will be identified and segmented out from the mammogram image. Finally, in the third stage, the segmented region of interest will be analyzed and classified based on its characteristic.
This study mainly focuses on the first stage of computer aided diagnosis for breast cancer. Characteristic studies are performed on mammogram image to identify its technical challenges. Then, new image processing techniques will be developed based on these challenges. In addition to that, this study will also cover a portion of microcalcification and mass segmentation in the feature extraction stage since the performance of the segmentation algorithm is highly dependent upon the technical challenges identified in the first stage.
Figure 2.5: 3 stages in computer aided diagnosis for breast cancer. Image Processing
Feature Extraction
Feature Analysis and Classification
2.3.4 Technical Challenges in Mammogram Image
Technical challenges in mammogram image are defined as factors which make interpretation of breast cancer signs and symptom difficult. Fundamental challenges associated with mammogram image are low contrast, noise and the absence of definitive boundaries. Presence of artefacts and blurring are also considered as challenges but they originate from external factors. Such challenges could be avoided or minimized if mammography operation procedure is adhered to strictly. Therefore, only fundamental challenges are covered in this study.
Contrast from visual perspective is defined as the difference visual properties which set apart an object in an image from other objects as well as the background (Pratt, 1991). Low contrast means the level of difference between a specific intensity level in an image and its nearest value is small. The difference in value must be big enough before it can be distinguished by a human eye (Gonzalez & Woods, 2002). In mammography, the resulting image is often low in contrast making it difficult to identify subtle details within the image. Level of contrast in mammogram image is closely associated to the characteristic of its grey level distribution. Detailed understanding of grey level distribution will allow the mammogram image to be enhanced effectively without introducing other problems such as noise and artefacts.
Noise from visual perspective is defined as random variations of colour information in an image (Pratt, 1991). In mammogram film, noise within a small neighbourhood is distributed in Gaussian manner (Aghdasi, et al., 1992). This type of noise is due to film grain. However, over a large area the noise distribution follows Poisson distribution. This type of noise is due to the nature of X-ray photons (Aghdasi, et al., 1992). These noises may not affect the visual perception of radiologists and doctors directly. However, they have significant impact over
subsequent image processing techniques especially in microcalcification detection and classification algorithms. Analysis of noise characteristic in mammogram image will lead to more accurate noise estimation. Eventually, such information will allow the development of a much more effective noise suppression technique.
Boundary is defined as the line that marks the limit (Hornby, 1995). In mammography, the term boundary is used to mark the outer limit of a structure such as microcalcifications and masses. Boundary for microcalcifications is much easier to detect because it is abrupt and solid. However, boundary for masses is much more obscure where the pixel value changes occur in smooth gradient manner. This limitation has forced the masses boundary to be drawn manually in earlier works such as the study by Mudigonda et al. (2000) and Rangayyan et al. (2000). Development of most microcalcification detection and segmentation algorithms is closely related to the understanding of its edge characteristic. Unique signature in microcalcification boundary allows it to be differentiated from other structures such as artefacts and noise. However, development of mass detection and segmentation algorithms could not rely on its edge characteristic due to the lack definitive boundary. Therefore, characteristic such as texture shall be analyzed and explored in the development of a more effective mass detection and segmentation algorithm.
These technical challenges are the motivation behind a lot of effort to develop better image processing techniques for mammography. Currently, there are two types of mammography technologies. The conventional film based mammography and the newer full field digital mammography (FFDM). In order to apply digital image processing techniques on conventional film based mammography, the film must be digitized into digital form before being process through computer. Digital image
2.4 Existing Mammogram Image Processing Techniques
There have been a lot of studies conducted worldwide in developing image processing techniques to address fundamental challenges in mammogram image. Image processing techniques are developed to solve low contrast issue falls into the contrast enhancement category. Noise problem is addressed through noise suppression techniques. Segmentation techniques are used to isolate and identify different structures within mammogram image which does not have definitive boundary.
2.4.1 Contrast Enhancement
Generally, contrast enhancement techniques can be divided into 2 categories. First is the conventional contrast enhancement category with techniques which are simple to be implemented and have been around for quite some time. The other category is the advance contrast enhancement category for newer techniques which apply complex algorithm with more refined result.
Conventional contrast enhancement techniques which have been used for mammogram image include contrast stretching, histogram equalization, Contrast Limited Adaptive Histogram Equalization (CLAHE), intensity windowing and unsharp masking. Contrast stretching is a technique where the difference between a specific intensity level and its adjacent value is increased to create a greater degree of separation between them. Bigger difference between intensity levels makes it easier for human eyes to set them apart (Gonzalez & Woods, 2002). This technique could be used to expose microcalcification within mammogram image as demonstrated in a study by Nunes et al. (2001). However, the biggest challenge in this technique is to
identify specific intensity level with high probability of association to microcalcification accurately.
Histogram equalization is a technique where histogram of intensity levels is re-mapped according to their probability density (Pratt, 1991). As a result, difference in intensity level with high probability is increased while difference in intensity level with low probability is reduced. This technique is very popular due to its simplicity. Nonetheless it is not very suitable for mammogram image because high intensity region tends to be over enhanced. As a result, trace of microcalcifications becomes even more obscure and difficult to be detected.
Adaptive histogram equalization is an improvement over histogram equalization. It is based on similar algorithm as histogram equalization but implemented locally through small neighbourhood window (Pratt, 1991). Adaptive histogram equalization performs better than histogram equalization by providing a much better contrast enhancement for small details within the image (Gonzalez & Woods, 2002). However, it has one major disadvantage where the resulting image tends to be over enhanced. This problem is mitigated through the Contrast Limited Adaptive Histogram Equalization (CLAHE) where contrast limit is put in place to reduce over enhancement effect on the image (Pizer, et al., 1987). Properly used, the CLAHE technique could bring out subtle details within mammogram image. However, improper setting would amplify undesirable noise (Pisano, et al., 1998).
Intensity windowing is a technique where a specific range of intensity levels is selected and re-mapped to the full range of intensity levels (Aylward, et al., 1998). Thus, contrast for the selected range is stretched across full range of intensity levels. In the Histogram Based Intensity Windowing (HIW) multiple ranges of intensity
levels to be enhanced are selected based on the location of peak in the histogram. In the Mixture Model Intensity Windowing (MMIW), multiple ranges of intensity levels to be enhanced are selected based on major region of the mammography image. These major regions such as background, fatty tissue, dense tissue and muscle are first identified through geometric and statistical analysis. The HIW and MMIW techniques allow radiologist to see through the densest part of the breast. However, details in low intensity levels region might be lost (Pisano, et al., 2000).
Unsharp masking is a technique used to increase contrast and sharpness by subtracting the blurred version of an image from the original image (Gonzalez & Woods, 2002). A study by Hemminger et al. (1999) found that unsharp masking generally does a fairly good job in enhancing a mammogram image on global basis. However, unsharp masking is also susceptible to noise.
Advance contrast enhancement techniques which have been used for mammogram image include fuzzy logic based enhancement, morphological approach, region based contrast enhancement and wavelet analysis.
In the fuzzy logic based contrast enhancement, fine details within mammogram image is enhanced while keeping noise amplification to minimum. It has been demonstrated that this technique successfully exposed feature of interest such as microcalcification without aggravating undesirable noise (Cheng & Xu, 2002).
The morphological based contrast enhancement used morphological approach to identify and enhance fine structure within mammogram image which correspond to microcalcification signature. This technique has been proven more effective in exposing microcalcification than conventional technique such as the CLAHE (Wirth, et al., 2004).