Volume 14 Issue 4 Article 2
2020
Time-Driven Activity-Based Costing in the Assembly Industry
Time-Driven Activity-Based Costing in the Assembly Industry
Olga VedernikovaUniversity of Cuenca, Cuenca, Ecuador, [email protected]
Lorena Siguenza-Guzman
University of Cuenca, Ecuador; Research Centre Accountancy, Faculty of Economics and Business, KU Leuven, Leuven, Belgium, [email protected]
Johanna Pesantez
University of Cuenca, Ecuador, [email protected]
Rodrigo Arcentales-Carrion
Research Group in Accounting, Finance and Taxation, Faculty of Economic and Administrative Sciences, University of Cuenca, [email protected]
Follow this and additional works at: https://ro.uow.edu.au/aabfj
Copyright ©2020 Australasian Accounting Business and Finance Journal and Authors. Recommended Citation
Recommended Citation
Vedernikova, Olga; Siguenza-Guzman, Lorena; Pesantez, Johanna; and Arcentales-Carrion, Rodrigo, Time-Driven Activity-Based Costing in the Assembly Industry, Australasian Accounting, Business and Finance Journal, 14(4), 2020, 3-23. doi:10.14453/aabfj.v14i4.2
Research Online is the open access institutional repository for the University of Wollongong. For further information contact the UOW Library: [email protected]
Abstract Abstract
Costs and their determination play a critical role in all manufacturing companies. The traditional costing system has received criticism resulting from the arbitrary allocation of indirect manufacturing costs. As an important initiative to address its weaknesses, new costing methods such as the Time-Driven Activity-Based Costing (TDABC) have emerged. Unfortunately, up to our knowledge, no investigations have been applied in analyzing assembly companies thoroughly nor considering all the processes necessary to obtain the final products. This article explores the TDABC application in the assembly industry through comparison with traditional volume-based costing by focusing on manual and semi-automatized production. Since the research is descriptive, a multiple-case study design was implemented in the assembly of televisions, motorcycles, and printed circuit boards. The developed methodology allowed determining the existence of factory overhead and direct labor cost variances between two different cost accounting systems, which also affected the unit cost of the products. Findings also highlight the
benefits of TDABC application in the assembly industry, along with the shortcomings and future potential of research in this area.
Keywords Keywords
Assembly industry, Processes, Time-Driven Activity-Based Costing, TDABC
Cover Page Footnote Cover Page Footnote
This study is part of the research project "Management model for the optimization of processes and costs in the Assembly Industry," supported by the Research Department of the University of Cuenca (DIUC). The authors gratefully acknowledge the contributions and feedback provided by the IMAGINE Project team and the enterprises utilized as case studies.
This article is available in Australasian Accounting, Business and Finance Journal: https://ro.uow.edu.au/aabfj/vol14/ iss4/2
Time-Driven Activity-Based Costing
in the Assembly Industry
Olga Vedernikova1, Lorena Siguenza-Guzman2,3, Johanna Pesantez4, and Rodrigo
Arcentales-Carrion5
Abstract
Costs and their determination play a critical role in all manufacturing companies. The traditional costing system has received criticism resulting from the arbitrary allocation of indirect manufacturing costs. As an important initiative to address its weaknesses, new costing methods such as the Time-Driven Activity-Based Costing (TDABC) have emerged. Unfortunately, up to our knowledge, no investigations have been applied in analyzing assembly companies thoroughly nor considering all the processes necessary to obtain the final products. This article explores the TDABC application in the assembly industry through comparison with traditional volume-based costing by focusing on manual and semi-automatized production. Since the research is descriptive, a multiple-case study design was implemented in the assembly of televisions, motorcycles, and printed circuit boards. The developed methodology allowed determining the existence of factory overhead and direct labor cost variances between two different cost accounting systems, which also affected the unit cost of the products. Findings also highlight the benefits of TDABC application in the assembly industry, along with the shortcomings and future potential of research in this area.
JEL classification: M40, M41
Keywords: Assembly industry, Processes, Time-Driven Activity-Based Costing, TDABC.
1 Faculty of Economics and Administrative Sciences, University of Cuenca, Cuenca, Ecuador
2 Department of Computer Sciences, Faculty of Engineering, University of Cuenca, Cuenca, Ecuador
3Research Centre Accountancy, Faculty of Economics and Business, KU Leuven, Leuven, Belgium
4 Faculty of Economics and Administrative Sciences, University of Cuenca, Cuenca, Ecuador
5 Research Group in Accounting, Finance, and Auditing, Faculty of Economics and Administrative Sciences,
University of Cuenca, Cuenca, Ecuador
1.
Introduction and background
In a globalized and highly competitive environment, there is a need to look for new costing approaches to improve the efficiency of production processes and to reduce costs. In fact, in accounting matters, remarkable achievements have been made, especially regarding cost issues and their management for its leading role in all companies, including assembly. This is because the only variable that can be controlled by an organization is the cost, while the price is imposed by the market (Ruiz de Arbulo et al., 2012).
Traditional volume-based costing systems have received numerous criticisms resulting from the arbitrary allocation of indirect manufacturing costs. Due to their nature, they cannot be easily quantified individually about the object of charge, unlike raw material and direct labor (Meric and Gersil, 2018). This drawback causes a substantial bias in the information concerning production costs (Santana et al., 2017). Therefore, it is difficult to answer questions about how and where charges are incurred and to detect inefficient activities or products (Soekardan, 2016).
To answer those questions, in the late 1980s, Cooper and Kaplan developed Activity-Based Costing, ABC. In this system, costs are assigned in the first instance to the activities and then to the products that consume these activities based on different cost drivers (Cooper and Kaplan, 1988). ABC is oriented towards obtaining more reasonable costs through the logical allocation of factory overhead, based on the direct relationship with the necessary activities to produce a good or service (Pawłyszyn, 2017). However, after the great enthusiasm for its application in the early '90s, companies stopped using ABC completely or continued implementing it, but only partially (Szychta, 2010). This effect was mainly due to its complexity, time-consuming, and high costs of implementation and maintenance (Rahman et al., 2018). Its high degree of subjectivity was also a concern since when allocating the percentages of time an employee carries out his/her activities, inevitably needs to be added up to 100% (Kaplan and Anderson, 2007). As a consequence, the processes operate at their full capacity without taking into account the idle and unused time. This makes the model theoretically incorrect (Namazi, 2016).
A major initiative to address the weaknesses of ABC was the development of a new costing model based on the time invested per activity by Kaplan and Anderson in 2004 (Tse and Gong, 2009). Time-Driven Activity-Based Costing (TDABC) is a much more precise and simplified approach in cost because of its simple integration into the management system, its ability to provide timely and accurate information, the lower maintenance cost, and its straightforward interpretation of data (Medeiros et al., 2017). This is especially true when fast changes in technologies towards automated processes produced notable growth in the proportion of overhead costs (Chansaad et al., 2012).
In the context of the existing literature, TDABC can be used in different environments that can be grouped into three principal fields: healthcare, industry, and libraries (Areena and Abu, 2019). Within the manufacturing industry, Stout and Propri (2011) highlight the potential power of TDABC and the vital role of enterprise resource planning (ERP) by partial implementation in an electronics company. The results of their research indicate that TDABC can provide more accurate costing information and easy to maintain models. Moreover, Ruiz de Arbulo et al. (2012) also suggest that TDABC is simpler and more accurate than ABC in the product or multi-process auto-parts factory through comparison of TDABC with a Value Stream Costing (VSC) in a tight manufacturing environment. The authors showed that TDABC could help to analyze overused or underused capacity. Ramida and Rungchat (2015) found that TDABC is a more
accurate method to determine the appropriate prices for the products into a wooden toy manufacturing company.
Concerning assembly, evidence of partial TDABC applications in small-scale furniture manufacturing can be found in India (Ganorkar et al., 2018a). In this case, only part of the production was taken into account with the assembly activities of furniture. No investigations have been presented analyzing assembly companies thoroughly nor considering all the processes necessary to obtain the products.
Despite the TDABC advantages, several studies have reported some inherent weaknesses of TDABC. For instance, Gervais et al. (2010) criticize the accuracy of the time estimations collected by interviews when it is not possible to observe them directly. Moreover, although Kaplan and Anderson (2007) affirm that the time collection can be done through direct observation with sufficient precision to perform the calculations, this does not prevent a certain degree of subjectivity in their measurement. It is because the method involves interviews with employees, which often overestimate the times when they feel being controlled (Siguenza-Guzman et al., 2013). Another disadvantage is the data quality since the accuracy of costs can be severely affected as a result of a small inaccuracy in minutes' estimation. For example, the non-consideration of seconds, which at first sight is not significant for an event of this activity, becomes essential when multiplied by the number of repetitions made, while being the same manner for all activities within a period (Adkins, 2008). Therefore, errors can result in a domino effect (Dejnega, 2011). In addition, data estimation (times) is based on historical averages or judgments, and its high variation can affect the quality of information (Mortaji et al., 2013). Other studies, as Öker and Adigüzel (2010) reveal specific difficulties in the practical application of TDABC in a manufacturing company that produces sheet metal and plastic parts due to restriction to measure capacity in terms of labor time. Another case study in a medium-sized manufacturing company recognizes that time equations used in TDABC are a compelling manner of describing product variety, but this is not always possible in practice (Wouters and Stecher, 2017). Despite the inconveniences mentioned above, the TDABC costing system has proven to be more convenient than traditional costing systems (Ganorkar et al., 2018b).
The main objective of this article is to analyze the TDABC application in the assembly industry through comparison with traditional volume-based costing by focusing on manual and semi-automatized production. For this purpose, the remainder of this document is organized as follows. The next section provides a theoretical framework of TDABC. This is followed by the material and methods applied in the study in Section 3. Next, Section 4 discusses the research findings and limitations. The final section provides the conclusion, implications, and further directions for research.
Theoretical Framework of TDABC
TDABC originality consists in the allocation of costs directly to cost objects based on only two parameters: the cost per unit of time of the supplied capacity of resources (capacity cost rate) and the estimated time required for each activity (Kaplan and Anderson, 2007). The breakthrough consists of avoiding the complicated stage of first allocating resource costs to activities before assigning them to the processes, orders, or products (Ganorkar et al., 2018a). Hence, time is the only inducer of costs for all activities, unlike multiple cost drivers in the ABC costing system (Medeiros et al., 2017).
With the use of time equations, TDABC breaks with the simplification trend of ABC, where each particular activity always requires the same amount of time to be processed and allows estimates of time units to vary depending on the order and characteristics of the activity (Rahman et al., 2018). The resulting time equation is expressed in Equation 1.
𝑃𝑟𝑜𝑐𝑒𝑠𝑠 𝑡𝑖𝑚𝑒 = ∑ 𝑜𝑓 𝑖𝑛𝑑𝑖𝑣𝑖𝑑𝑢𝑎𝑙 𝑎𝑐𝑡𝑖𝑣𝑖𝑡𝑦 𝑡𝑖𝑚𝑒𝑠 = 𝛽0+ 𝛽1∗ 𝑋1+ ⋯ + 𝛽𝑖 ∗ 𝑋𝑖
where 𝛽0 is the standard time for performing the basic activity
𝛽1…𝛽𝑖 is the time for the additional activities
𝑋1…𝑋𝑖 are the frequencies for the additional activities
(1)
Time equations allow understanding with detail the dynamic of operational processes (Meric and Gersil, 2018). In addition, this costing system enables the recognition of idle capacity or inefficiency in the use of resources, where the resources consumed are allocated to the product instead of the performing ones (Tse and Gong, 2009). This idle capacity recognition helps in quick identification of the origin of existing problems in an organization (Kaplan and Anderson, 2007).
Materials and Methods
1.1.
Research Methodology
This study aimed to analyze the application of TDABC in assembly industries through a comparison with traditional volume-based costing. For this purpose, the multiple-case design was utilized, which is instrumental in understanding complex organizational phenomena, giving more compelling evidence than a single case (Yin, 2003). The case study research method implicates an in-depth investigation of the phenomenon within a real-life situation (Cooper and Morgan, 2008). Case studies help to understand the applicability of specific innovations in complex contexts and re-assessing their conceptualizations of problems (Cooper and Morgan, 2008).
In this context, the research was conducted through three case studies. The selection of cases was based on the convenience of accessibility and proximity of the subjects to the researchers. All the data (e.g., times, costs, financial information, frequency of activities, monthly production, practical capacity, used capacity, method of cost allocation in each company) were collected through semi-structured interviews, focus groups, direct and documentary observation. The analysis of primary and secondary data was applied through costing matrices with the TDABC system, graphs, Pareto Chart, and descriptive statistics to determine the averages of variation in unit costs of the products.
1.2.
Case studies
The first case study belongs to the TV assembly (fourteen models). It has a manual type of production and low technological use trough conveyor manufacturing. In the second case study, only manual manufacturing is used for motorcycle assembly (thirteen models) in six workstations. These two cases are situated in the same company. Meanwhile, the third case study corresponds to the other company and relates to the assembly of printed circuit boards, PCB (nineteen models), with the implementation of semi-automated manufacturing. Both companies belong to an important business group in Ecuador, with a complex functional organic structure and manner of operating through the parent company, which is in charge of most of the strategic and support processes. The names of the companies and their products are not disclosed, respecting the confidentiality agreement established.
Interviews with the accounting staff indicated that these companies lack a well-defined costing system from a traditional perspective, and the accounting process is as well rudimentary. The monthly costs are determined in totalized form, without assigning to specific processes or orders. The indirect manufacturing costs (4%, 8%, and 18% of production costs respectively) and direct labor (1%, 2%, and 3% respectively) are assigned according to the raw material used, which represents 95%, 90%, and 79% per case study. In addition, in the first company, costs are divided equally for the cost centers of televisions and motorcycles except for raw material. Therefore, the cost distribution does not consider the characteristics of each product and the processes needed for its production. This means that an arbitrary apportionment of indirect manufacturing costs and direct labor is utilized, which may distort the final value of the products.
1.3 TDABC methodology
According to Everaert et al. (2008) and Reynolds et al. (2018), the calculation methodology with the TDABC costing system contemplates six steps: 1) Identifying various resource groups (departments or processes). 2) Estimating the total costs of each resource group. 3) Obtaining the practical capacity of each resource group in terms of time. 4) Determining the unit cost of each group of resources (Step1 divide by Step2). 5) Determining the estimated time for each event (time equations). 6) Evaluating each task, multiplying Step 4 by Step 5. However, for the current study, there was a need to expand Steps 1, 2, and 4 to give a more in-depth cost analysis. In addition, Step 6 was unbundled, adding Steps 7 and 8 for better visualization of calculation sequence. Therefore, the following methodological framework was created with the approach to assembly processes, consisting of eight steps:
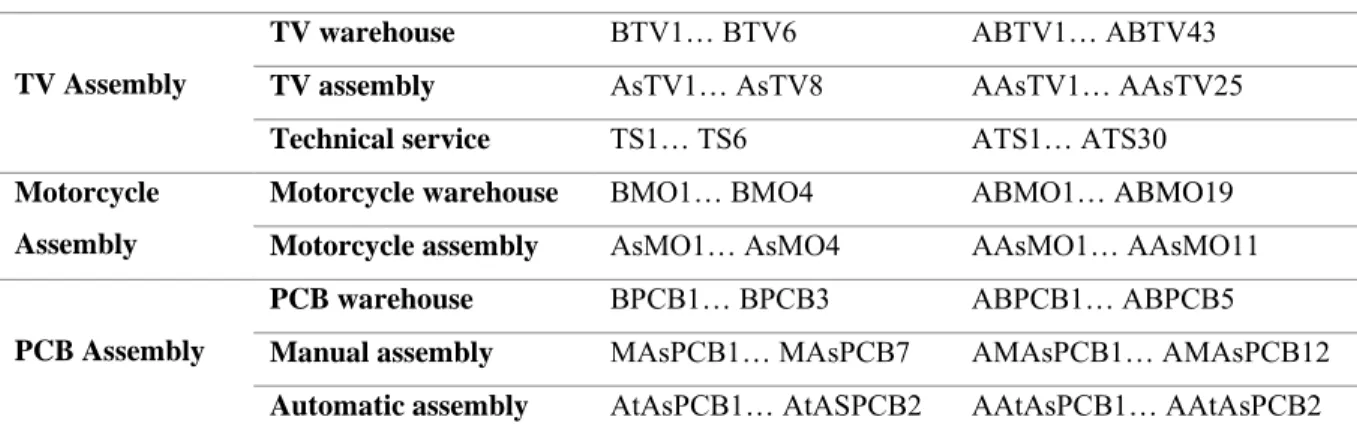
1. Identify various resource groups. As resource groups were considered the main processes necessary to obtain each product. Those processes were categorized into sub-processes and activities based on direct observation during visits to the assembly lines. To facilitate the analysis, the following codifications were done, as shown in Table 1. The original TDABC methodology has only two levels: the departments (processes) and the activities (Kaplan and Anderson, 2007). In the current study, three levels are proposed: processes, sub-processes, and activities. Through the division of the processes into smaller units (sub-processes), better visualization and understanding of the business dynamics are achieved.
Table 1. Codifications of sub-processes and activities
Case study Process Sub-processes Activities
TV Assembly
TV warehouse BTV1… BTV6 ABTV1… ABTV43
TV assembly AsTV1… AsTV8 AAsTV1… AAsTV25
Technical service TS1… TS6 ATS1… ATS30
Motorcycle Assembly
Motorcycle warehouse BMO1… BMO4 ABMO1… ABMO19
Motorcycle assembly AsMO1… AsMO4 AAsMO1… AAsMO11
PCB Assembly
PCB warehouse BPCB1… BPCB3 ABPCB1… ABPCB5
Manual assembly MAsPCB1… MAsPCB7 AMAsPCB1… AMAsPCB12 Automatic assembly AtAsPCB1… AtASPCB2 AAtAsPCB1… AAtAsPCB2
2. Estimate the total costs of each process (supplied resources). The monthly company's accounting basis, obtained from documentary observation, was classified by direct labor, indirect labor, and factory overhead and grouped in costing matrices. While Kaplan and Anderson (2003) determine the cost by adding all resources without the segregation mentioned above, the proposed change identifies the financial influence of each cost element within the total unit cost and the total monthly cost. Additionally, this modification is used for determination in cost variation between TDABC and traditional cost systems. Data were obtained from the financial statements of the companies in 2017.
3. Estimate the practical capacity of each process. In this step, 80% is applied to the theoretical capacity (hours worked per month) of employees and 85% to the machinery (Kaplan and Anderson, 2007). For these calculations, only the working hours of the direct workers (those who directly intervene in the process with the respective activities) were considered. In addition, it was necessary to perform the conversion of the days worked (accounting) given through pay role reports to the working days according to the model. Therefore, out of the 365 days available on 2017, 11 days were deducted corresponding to holidays, 52 Saturdays and 53 Sundays; then, 11 days of vacation (15 days, minus 2 Saturdays and 2 Sundays), and finally, three days off for different reasons. As a result, 235 available days per year were obtained, which divided by 12 months resulted in 19.58 days per month for each person. Therefore, the proportional part in minutes was found, according to the days indicated in pay role reports.
4. Estimate the unit cost of each process. This value was obtained by dividing the estimated total cost for each cost element (direct labor, indirect labor, and factory overhead) identified in Step 2 by each process practical capacity from Step 3 (Equation 2).
𝑈𝑛𝑖𝑡 𝑐𝑜𝑠𝑡 =𝐷𝑖𝑟𝑒𝑐𝑡 𝑙𝑎𝑏𝑜𝑟 $ 𝑜𝑟 𝐼𝑛𝑑𝑖𝑟𝑒𝑐𝑡 𝑙𝑎𝑏𝑜𝑟 $ 𝑜𝑟 𝐹𝑎𝑐𝑡𝑜𝑟𝑦 𝑜𝑣𝑒𝑟ℎ𝑒𝑎𝑑 $ 𝑃𝑟𝑎𝑐𝑡𝑖𝑐𝑎𝑙 𝑐𝑎𝑝𝑎𝑐𝑖𝑡𝑦 𝑚𝑖𝑛𝑢𝑡𝑒𝑠
(2)
5. Determine the time used in each process and sub-process. This step was given according to the time (in minutes) and frequencies of each activity (time equations). Data was obtained with measurements by a chronometer. In addition, the times of TV assembly, Motorcycles assembly, Manual assembly, and Automatic assembly processes were distributed individually to the respective model of products. Times of TV warehouse, Motorcycles warehouse, and PCB warehouse processes, as well as, Technical service were determined overall. Consequently, the time equations were formulated as indicated in Equations 3, 5, and 7 and with time values in Equations 4, 6, and 8.
𝑇𝑉 𝐴𝑠𝑠𝑒𝑚𝑏𝑙𝑦 𝑡𝑖𝑚𝑒 = 𝑇𝑉 𝑆𝑒𝑡𝑢𝑝𝑠 𝑇𝑖𝑚𝑒 ∗ 𝑁𝑢𝑚𝑏𝑒𝑟 𝑜𝑓 𝑇𝑉 𝑆𝑒𝑡𝑢𝑝𝑠 + (𝐴𝑠𝑠𝑒𝑚𝑏𝑙𝑦 𝑇𝑖𝑚𝑒 + 𝐾𝑒𝑦𝑏𝑜𝑎𝑟𝑑 𝐴𝑠𝑠𝑒𝑚𝑏𝑙𝑦 𝑇𝑖𝑚𝑒 + 𝐶𝑜𝑛𝑡𝑟𝑜𝑙𝑠 𝐴𝑠𝑠𝑒𝑚𝑏𝑙𝑦 𝑇𝑖𝑚𝑒 + 𝐴𝑐𝑐𝑒𝑠𝑠𝑜𝑟𝑖𝑒𝑠 𝐴𝑠𝑠𝑒𝑚𝑏𝑙𝑦 𝑇𝑖𝑚𝑒 + 𝐹𝑖𝑛𝑖𝑠ℎ𝑒𝑑 𝑃𝑟𝑜𝑑𝑢𝑐𝑡 𝑄𝑢𝑎𝑙𝑖𝑡𝑦 𝐶𝑜𝑛𝑡𝑟𝑜𝑙 𝑇𝑖𝑚𝑒 + 𝑃𝑎𝑐𝑘𝑖𝑛𝑔 𝑎𝑛𝑑 𝑝𝑎𝑐𝑘𝑎𝑔𝑖𝑛𝑔 𝑇𝑖𝑚𝑒) ∗ 𝑇𝑉 𝑃𝑟𝑜𝑑𝑢𝑐𝑡𝑖𝑜𝑛 + 𝐵𝑎𝑡𝑐ℎ 𝑄𝑢𝑎𝑙𝑖𝑡𝑦 𝐶𝑜𝑛𝑡𝑟𝑜𝑙 𝑇𝑖𝑚𝑒 ∗𝑇𝑉 𝑃𝑟𝑜𝑑𝑢𝑐𝑡𝑖𝑜𝑛 100 (3)
𝑇𝑉 𝐴𝑠𝑠𝑒𝑚𝑏𝑙𝑦 𝑡𝑖𝑚𝑒 = 46.83 ∗ 𝑁𝑢𝑚𝑏𝑒𝑟 𝑜𝑓 𝑇𝑉 𝑆𝑒𝑡𝑢𝑝𝑠 + 7.70 {𝑖𝑓 𝑇𝑉1} ∗ 𝑃𝑟𝑜𝑑𝑢𝑐𝑡𝑖𝑜𝑛 𝑇𝑉1 + 9.66 {𝑖𝑓 𝑇𝑉2, 𝑇𝑉3, 𝑇𝑉4} ∗ 𝑃𝑟𝑜𝑑𝑢𝑐𝑡𝑖𝑜𝑛 (𝑇𝑉2, 𝑇𝑉3, 𝑇𝑉4) + 10.99 {𝑖𝑓 𝑇𝑉5, 𝑇𝑉6} ∗ 𝑃𝑟𝑜𝑑𝑢𝑐𝑡𝑖𝑜𝑛 (𝑇𝑉5, 𝑇𝑉6) + 15.11 {𝑖𝑓 𝑇𝑉13} ∗ 𝑃𝑟𝑜𝑑𝑢𝑐𝑡𝑖𝑜𝑛 𝑇𝑉13 + 16.93 {𝑖𝑓 𝑇𝑉8} ∗ 𝑃𝑟𝑜𝑑𝑢𝑐𝑡𝑖𝑜𝑛 𝑇𝑉8 + 17.65 {𝑖𝑓 𝑇𝑉7, 𝑇𝑉9, 𝑇𝑉10} ∗ 𝑃𝑟𝑜𝑑𝑢𝑐𝑡𝑖𝑜𝑛 (𝑇𝑉7, 𝑇𝑉9, 𝑇𝑉10) + 21.55 {𝑖𝑓 𝑇𝑉11, 𝑇𝑉12} ∗ 𝑃𝑟𝑜𝑑𝑢𝑐𝑡𝑖𝑜𝑛 (𝑇𝑉11, 𝑇𝑉12) + 26.89 {𝑖𝑓 𝑇𝑉14} ∗ 𝑃𝑟𝑜𝑑𝑢𝑐𝑡𝑖𝑜𝑛 𝑇𝑉14 + 12.83 ∗𝑃𝑟𝑜𝑑𝑢𝑐𝑡𝑖𝑜𝑛 (𝑇𝑉1, 𝑇𝑉. . . 𝑇𝑉14) 100 (4) 𝑀𝑜𝑡𝑜𝑟𝑐𝑦𝑐𝑙𝑒 𝐴𝑠𝑠𝑒𝑚𝑏𝑙𝑦 𝑡𝑖𝑚𝑒 = (𝑀𝑜𝑡𝑜𝑟𝑐𝑦𝑐𝑙𝑒 𝑆𝑒𝑡𝑢𝑝 𝑇𝑖𝑚𝑒 + 𝑀𝑜𝑡𝑜𝑟𝑐𝑦𝑐𝑙𝑒 𝐴𝑠𝑠𝑒𝑚𝑏𝑙𝑦 𝑇𝑖𝑚𝑒 + 𝑄𝑢𝑎𝑙𝑖𝑡𝑦 𝐶𝑜𝑛𝑡𝑟𝑜𝑙 𝑇𝑖𝑚𝑒 𝑜𝑓 𝑓𝑖𝑛𝑖𝑠ℎ𝑒𝑑 𝑝𝑟𝑜𝑑𝑢𝑐𝑡 + 𝑃𝑎𝑐𝑘𝑖𝑛𝑔 𝑎𝑛𝑑 𝑝𝑎𝑐𝑘𝑎𝑔𝑖𝑛𝑔 𝑡𝑖𝑚𝑒) ∗ 𝑃𝑟𝑜𝑑𝑢𝑐𝑡𝑖𝑜𝑛 𝑜𝑓 𝑚𝑜𝑡𝑜𝑟𝑐𝑦𝑐𝑙𝑒𝑠 (5) 𝑀𝑜𝑡𝑜𝑟𝑐𝑦𝑐𝑙𝑒 𝐴𝑠𝑠𝑒𝑚𝑏𝑙𝑦 𝑡𝑖𝑚𝑒 = 163.73 {𝑖𝑓 𝑀𝑂11} ∗ 𝑃𝑟𝑜𝑑𝑢𝑐𝑡𝑖𝑜𝑛 𝑀𝑂11 + 184.72 {𝑖𝑓 𝑀𝑂10} ∗ 𝑃𝑟𝑜𝑑𝑢𝑐𝑡𝑖𝑜𝑛 𝑀𝑂10 + 185.62 {𝑖𝑓 𝑀𝑂4} ∗ 𝑃𝑟𝑜𝑑𝑢𝑐𝑡𝑖𝑜𝑛 𝑀𝑂4 + 193.73 {𝑖𝑓 𝑀𝑂7} ∗ 𝑃𝑟𝑜𝑑𝑢𝑐𝑡𝑖𝑜𝑛 𝑀𝑂7 + 203.26 {𝑖𝑓 𝑀𝑂1, 𝑀𝑂2, 𝑀𝑂3, 𝑀𝑂6, 𝑀𝑂8, 𝑀𝑂13} ∗ 𝑃𝑟𝑜𝑑𝑢𝑐𝑡𝑖𝑜𝑛 (𝑀𝑂1, 𝑀𝑂2, 𝑀𝑂3, 𝑀𝑂6, 𝑀𝑂8, 𝑀𝑂13) + 226.37 {𝑖𝑓 𝑀𝑂9} ∗ 𝑃𝑟𝑜𝑑𝑢𝑐𝑡𝑖𝑜𝑛 𝑀𝑂9 + 233.89 {𝑖𝑓 𝑀𝑂12} ∗ 𝑃𝑟𝑜𝑑𝑢𝑐𝑡𝑖𝑜𝑛 𝑀𝑂12 + 234.75 {𝑖𝑓 𝑀𝑂5} ∗ 𝑃𝑟𝑜𝑑𝑢𝑐𝑡𝑖𝑜𝑛 𝑀𝑂5 (6) 𝑃𝑟𝑖𝑛𝑡𝑒𝑑 𝑐𝑖𝑟𝑐𝑢𝑖𝑡 𝑏𝑜𝑎𝑟𝑑𝑠 𝐴𝑠𝑠𝑒𝑚𝑏𝑙𝑦 𝑡𝑖𝑚𝑒 = (𝑀𝑎𝑛𝑢𝑎𝑙 𝑆𝑒𝑡𝑢𝑝 𝑇𝑖𝑚𝑒 + 𝐴𝑡𝑜𝑚𝑎𝑡𝑖𝑐 𝑆𝑒𝑡𝑢𝑝 𝑇𝑖𝑚𝑒) ∗ 𝑁𝑢𝑚𝑏𝑒𝑟 𝑜𝑓 𝑆𝑒𝑡𝑢𝑝𝑠 𝑃𝑟𝑖𝑛𝑡𝑒𝑑 𝑐𝑖𝑟𝑐𝑢𝑖𝑡 𝑏𝑜𝑎𝑟𝑑𝑠 + (𝑀𝑎𝑛𝑢𝑎𝑙 𝐴𝑠𝑠𝑒𝑚𝑏𝑙𝑦 𝑇𝑖𝑚𝑒 + 𝐴𝑢𝑡𝑜𝑚𝑎𝑡𝑖𝑐 𝐴𝑠𝑠𝑒𝑚𝑏𝑙𝑦 𝑇𝑖𝑚𝑒 2 + 𝑄𝑢𝑎𝑙𝑖𝑡𝑦 𝐶𝑜𝑛𝑡𝑟𝑜𝑙 𝑇𝑖𝑚𝑒 + 𝑃𝑎𝑐𝑘𝑎𝑔𝑖𝑛𝑔 𝑇𝑖𝑚𝑒) ∗ 𝑃𝑟𝑖𝑛𝑡𝑒𝑑 𝑐𝑖𝑟𝑐𝑢𝑖𝑡 𝑏𝑜𝑎𝑟𝑑𝑠 𝑃𝑟𝑜𝑑𝑢𝑐𝑡𝑖𝑜𝑛 + 𝑅𝑒𝑝𝑎𝑖𝑟 𝑇𝑖𝑚𝑒 𝑜𝑓 𝑝𝑟𝑖𝑛𝑡𝑒𝑑 𝑐𝑖𝑟𝑐𝑢𝑖𝑡 𝑏𝑜𝑟𝑑𝑠 ∗ 𝑃𝑟𝑖𝑛𝑡𝑒𝑑 𝑐𝑖𝑟𝑐𝑢𝑖𝑡 𝑏𝑜𝑎𝑟𝑑𝑠 𝑃𝑟𝑜𝑑𝑢𝑐𝑡𝑖𝑜𝑛 ∗ 1% + (𝐴𝑠𝑠𝑒𝑚𝑏𝑙𝑦 𝑡𝑖𝑚𝑒 𝑏𝑜𝑡𝑜𝑚 𝑠𝑖𝑑𝑒 + 𝐴𝑠𝑠𝑒𝑚𝑏𝑙𝑦 𝑡𝑖𝑚𝑒 𝑡𝑜𝑝 𝑠𝑖𝑑𝑒) ∗ 𝑃𝑟𝑖𝑛𝑡𝑒𝑑 𝑐𝑖𝑟𝑐𝑢𝑖𝑡 𝑏𝑜𝑎𝑟𝑑𝑠 𝑃𝑟𝑜𝑑𝑢𝑐𝑡𝑖𝑜𝑛 (7)
𝑃𝑟𝑖𝑛𝑡𝑒𝑑 𝑐𝑖𝑟𝑐𝑢𝑖𝑡 𝑏𝑜𝑎𝑟𝑑𝑠 𝐴𝑠𝑠𝑒𝑚𝑏𝑙𝑦 𝑡𝑖𝑚𝑒 = 162.83 {𝑖𝑓 𝑇𝐽1, 𝑇𝐽2 … 𝑇𝐽12} ∗ 𝑆𝑒𝑡𝑢𝑝𝑠 (𝑇𝐽1, 𝑇𝐽2 … 𝑇𝐽12) + 371.90 {𝑖𝑓 𝑇𝐽13, 𝑇𝐽14 … 𝑇𝐽19} ∗ 𝑆𝑒𝑡𝑢𝑝𝑠 (𝑇𝐽13, 𝑇𝐽14 … 𝑇𝐽19) + 4.74 {𝑖𝑓 𝑇𝐽1, 𝑇𝐽2 … 𝑇𝐽12} ∗ 𝑃𝑟𝑜𝑑𝑢𝑐𝑡𝑖𝑜𝑛 (𝑇𝐽1, 𝑇𝐽2 … 𝑇𝐽12) + 17.03 {𝑖𝑓 𝑇𝐽13, 𝑇𝐽14 … 𝑇𝐽19} ∗ 𝑃𝑟𝑜𝑑𝑢𝑐𝑡𝑖𝑜𝑛 (𝑇𝐽13, 𝑇𝐽14 … 𝑇𝐽19) + 32.56 ∗ 𝑃𝑟𝑜𝑑𝑢𝑐𝑡𝑖𝑜𝑛 (𝑇𝐽1, 𝑇𝐽2 … 𝑇𝐽19) ∗ 1% + 2.08 {𝑖𝑓 𝑇𝐽1, 𝑇𝐽2 … 𝑇𝐽6, 𝑇𝐽12} ∗ 𝑃𝑟𝑜𝑑𝑢𝑐𝑡𝑖𝑜𝑛 (𝑇𝐽1, 𝑇𝐽2 … 𝑇𝐽6, 𝑇𝐽12) + 2.60 {𝑖𝑓 𝑇𝐽8, 𝑇𝐽9} ∗ 𝑃𝑟𝑜𝑑𝑢𝑐𝑡𝑖𝑜𝑛 (𝑇𝐽8, 𝑇𝐽9) + 2.75 {𝑖𝑓 𝑇𝐽7, 𝑇𝐽10, 𝑇𝐽11} ∗ 𝑃𝑟𝑜𝑑𝑢𝑐𝑡𝑖𝑜𝑛 ( 𝑇𝐽7, 𝑇𝐽10, 𝑇𝐽11) + 1.75 {𝑖𝑓 𝑇𝐽13, 𝑇𝐽14 … 𝑇𝐽19} ∗ 𝑃𝑟𝑜𝑑𝑢𝑐𝑡𝑖𝑜𝑛 (𝑇𝐽13, 𝑇𝐽14 … 𝑇𝐽19) (8)
6. Value each process, sub-process, and activities (utilized resources). This step was done by multiplying the unit cost of each resource group from Step 4 by the estimated time from Step 5 (Equation 9). This calculation was made in a totalized form, as well as separately regarding direct labor, indirect labor, and factory overhead.
𝑈𝑡𝑖𝑙𝑖𝑧𝑒𝑑 𝑟𝑒𝑠𝑜𝑢𝑟𝑐𝑒𝑠 = 𝑈𝑛𝑖𝑡 𝑐𝑜𝑠𝑡 ∗ 𝑇𝑖𝑚𝑒 (9)
7. Establish inefficiencies in the use of assigned resources. Its valuation was made for each process, both in dollars and in percentages (Equations 10 and 11).
𝐼𝑛𝑛𝑒𝑓𝑓𝑖𝑐𝑖𝑒𝑛𝑐𝑖𝑒𝑠 $ = 𝑆𝑢𝑝𝑝𝑙𝑖𝑒𝑑 𝑟𝑒𝑠𝑜𝑢𝑟𝑐𝑒𝑠 − 𝑈𝑡𝑖𝑙𝑖𝑧𝑒𝑑 𝑟𝑒𝑠𝑜𝑢𝑟𝑐𝑒𝑠 (10)
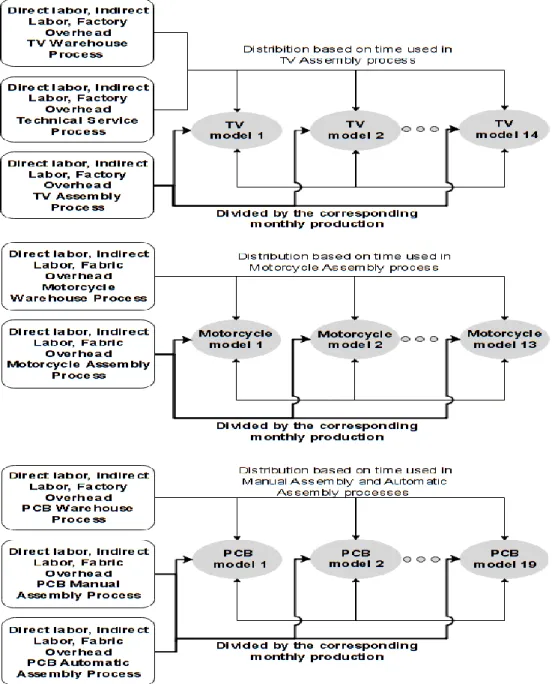
8. Determine the unit costs per each product. To develop this action, the total costs per product of the processes TV assembly, Motorcycle assembly, Manual assembly, and Automatic assembly were divided by the corresponding monthly production. In other processes, the distribution of costs was done, as shown in Figure 1. Meanwhile, the raw material was directly assigned per product.
𝐼𝑛𝑛𝑒𝑓𝑓𝑖𝑐𝑖𝑒𝑛𝑐𝑖𝑒𝑠 % = 𝑆𝑢𝑝𝑝𝑙𝑖𝑒𝑑 𝑟𝑒𝑠𝑜𝑢𝑟𝑐𝑒𝑠 − 𝑈𝑡𝑖𝑙𝑖𝑧𝑒𝑑 𝑟𝑒𝑠𝑜𝑢𝑟𝑐𝑒𝑠 𝑆𝑢𝑝𝑝𝑙𝑖𝑒𝑑 𝑟𝑒𝑠𝑜𝑢𝑟𝑐𝑒𝑠
The instruments of descriptive statistics were used to compare the unit cost of the products between the TDABC and the traditional volume-based costing. First, the annual averages were obtained based on monthly values for each model. Then, this annual data per case study were averaged. To determine the variances between the two accounting systems, the total overhead (indirect manufacturing costs), factory overhead, and direct labor cost were also compared through costing matrices. Then, the obtained data were analyzed and displayed by Pareto Charts and statistical software.
Results and Discussion
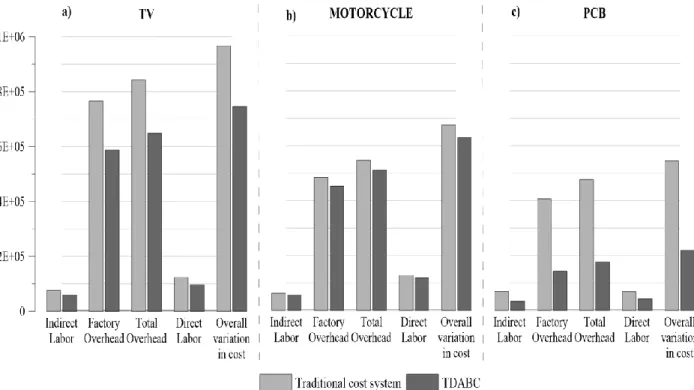
One of the implications of this research is the comparison of TDABC results with the traditional costing system in three selected case studies of the assembly industry focused on manual and semi-automatized production. The developed methodology allowed determining the existence of an overhead variance between two cost accounting systems. In the first case study, the indirect labor cost decreased by 21%, the factory overhead 23%, and the total overhead or indirect manufacturing costs 23% in comparison with traditional volume-based costing. Meanwhile, in the second case study, a reduction of 8%, 6%, and 6%, respectively, was obtained in each item of mentioned costs. Furthermore, in the third case study, the indirect labor cost declined 52%, the factory overhead 65%, and the total overhead 63%, respectively (see Figure 2). Given that direct labor cost is also part of the TDABC resources, the analysis was also performed in the variation of this cost item. Direct labor decreased by 22%, 8, and 39%, respectively, in each case study.
Figure 2. Comparison of TDABC with traditional volume-based costing a) TV assembly. b) Motorcycle assembly. c) PCB assembly
Figure 3 indicates that the Motorcycle assembly presents the lowest variation in costs between the two systems and reaches only 7% of the overall variation, including direct labor cost. The TV assembly follows this variation with 23% of cost reduction, and the PCB assembly presents the highest difference of 60%. Therefore, the assembly with a manual type of production and with the low technological use turned out to have fewer cost differences between TDABC and the traditional costing system.
Figure 3. Cost variation in percentage terms
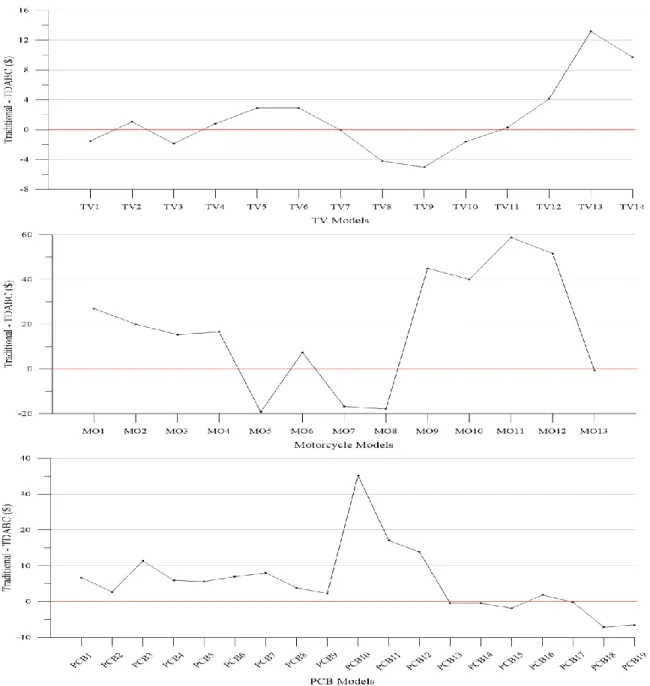
This research also found the variations in unit costs of the products under the TDABC costing system, shown in Figure 4. In this regard, the unit production costs of motorcycles decreased, on average a 2% and in PCB an 8%, compared to the values reported by the traditional costing system (Figure 7b and 7c). However, in the case of televisions, the difference is close to zero, since the raw material represents 95% of the production costs (Figure 7a).
Nevertheless, the television models TV1, TV3, TV8, and TV9 have increased 1% in the average unit production costs. A similar situation is observed in motorcycles, MO5, MO7, and MO8, which raised 3%. The difference indicates that under the traditional system estimation, these models might be underestimated by the arbitrary apportionment of the costs based on the raw material, and because of not taking into account the time necessary for their production. Regarding PCBs, the difference is even more noticeable, especially in the models PCB15, PCB18, and PCB19, which have increased, on average, 6%, 29%, and 27%, respectively. These results are due to the use of manual activities during their assembly process, which requires more time. Consequently, these models have a higher cost burden on the TDABC system. That varies from the traditional approach, where the models with automatic production process subsidize the costs of the PCB, which also require manual processes for their production.
Figure 4. Variation in unit costs
Although the substantial differences in unit costs of the products with the TDABC were not observed in TV assembly and Motorcycle assembly due to the predominance of the main element, the raw material in the total cost, the benefits of this costing system extend beyond the unit cost determination. Therefore, it can offer the information that the traditional costing system cannot provide. Its approach towards processes allows an understanding of the business's dynamics. In this context, the comprehensive methodological framework proposed allowed establishing the cost of three processes, 20 sub-processes, and 98 activities in the first case study; the cost of two processes, eight sub-processes, and 30 activities in the second case study; and the cost of three processes, 12 sub-processes, and 19 activities in the third case study.
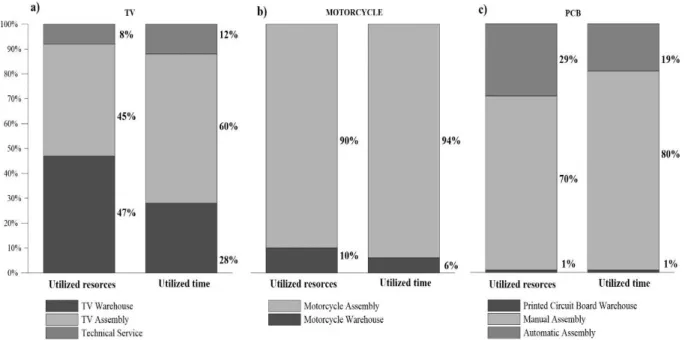
Findings indicate that in the first case study, the processes which absorb most resources were the TV warehouse with 47% and the TV assembly with 45%, representing 28% and 60% of
the total utilized time, respectively (Figure 5a). In the second case study, the process that employed most of the resources is the Motorcycle assembly, with 90% of the cost and 94% of the total time utilized (Figure 5b). In the third case study, the Manual assembly representing 70%, followed by the Automatic assembly with 29%, since they consume most of the time, i.e., 80% and 19%, respectively (Figure 5c).
Figure 5. Resources and time utilized by processes. a) TV assembly. b) Motorcycle assembly. c) PCB assembly
The existence of variations in cost analysis between the two costing systems indicates that not all the supplied resources were used at its maximum capacity due to inefficiencies in the assembly processes. The TDABC allowed establishing the values of these inefficiencies. They represent the difference between the supplied resources and the used resources during production. It should be mentioned that the traditional costing system does not provide this information.
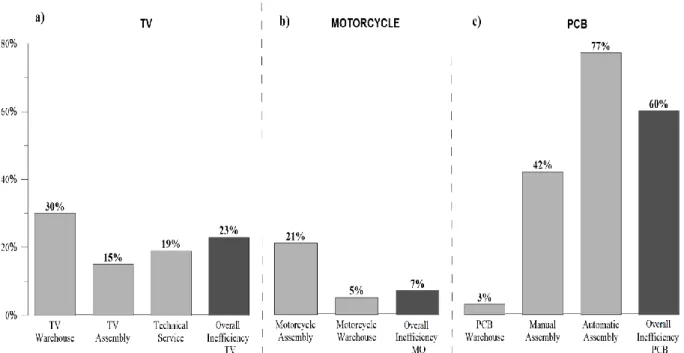
In Figure 6a, corresponding to the first case study, the process with the highest percentage of inefficiencies in the use of resources is the TV Warehouse process by 30%. In the second case study, the most inefficient process is the Motorcycle warehouse, with 21% (Figure 6b). Notably, the inefficiencies of these processes are higher than the overall inefficiency, which reaches 23% and 7%, respectively, representing 1% of the total production costs in each case study. The Automatic assembly process is the most inefficient, with 77% in the third case study (Figure 6c). Therefore, it is higher than the overall inefficiency, which reached 60%, representing 13% of total production costs in this case study. As a result, television and motorcycle assembly with a manual type of production is more efficient than the PCB assembly that has semi-automated manufacturing. Therefore, in the scenario of low production and high levels of idle capacity, automation might be counterproductive due to the high costs of indirect manufacturing cost.
Figure 6. Inefficiencies of processes. a) TV assembly. b) Motorcycle assembly. c) PCB assembly
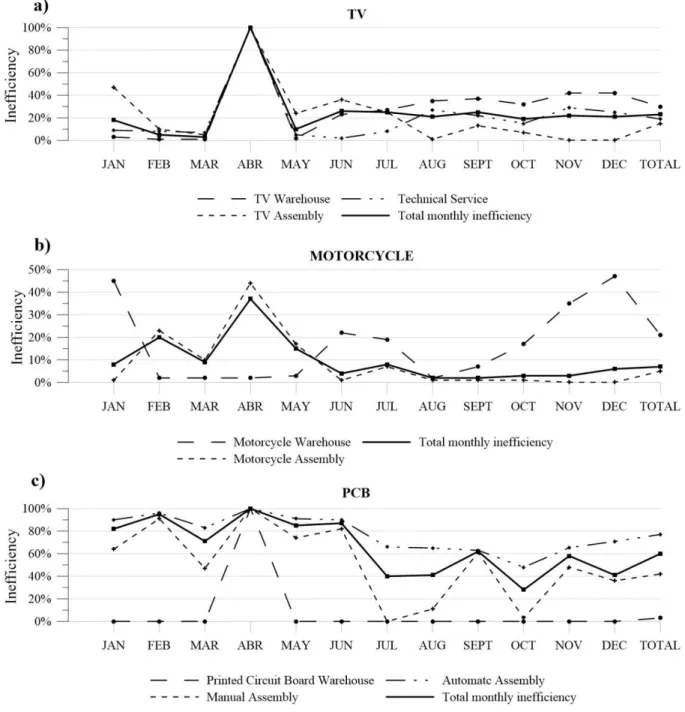
Figure 7 shows the trends corresponding to the inefficiencies of operating processes as a result of uniting the maximum points of discrete behavior of this variable monthly. In this case, April has the highest inefficiency by 100% in the TV assembly and PCB assembly. The cause is that the production was stopped due to the resettlement of the manufacturing plants. By November and December, in the assembly processes, the inefficiencies level dropped below 1% in the first and second case studies since production increased and better use of the supplied resources was applied (Figure 7a and 7b). In PCB, a similar situation took place in the Manual assembly process in October, when the inefficiency level decreased to 3% (Figure 7c).
Another advantage of TDABC that derives from the current analysis of inefficiencies is the opportunity of planning practical capacity and the demand for the products. Findings indicate that with production levels above those registered in November and December (Figure 7a and 7b), the TV assembly and Motorcycle assembly case studies may not have sufficient practical capacity to meet market requirements due to the low capacity of assembly processes. Therefore, TDABC costing also facilitates budget planning in new marketing scenarios.
Figure 7. Monthly inefficiencies. a) TV assembly. b) Motorcycle assembly. c) PCB assembly
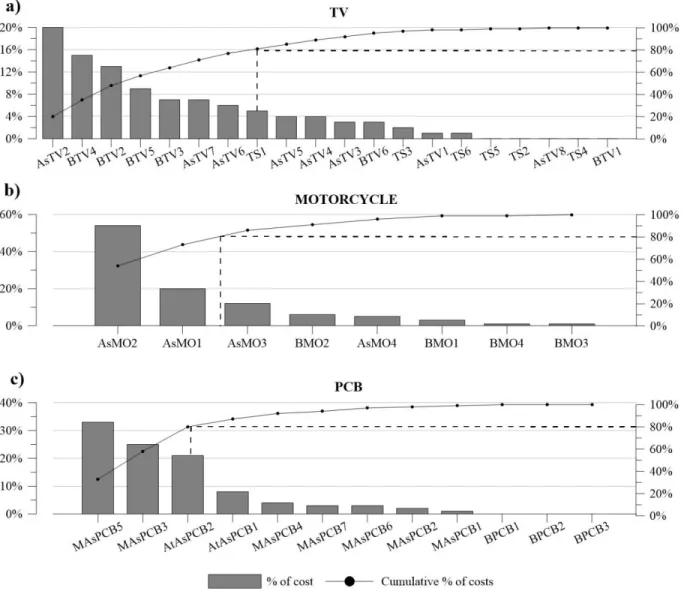
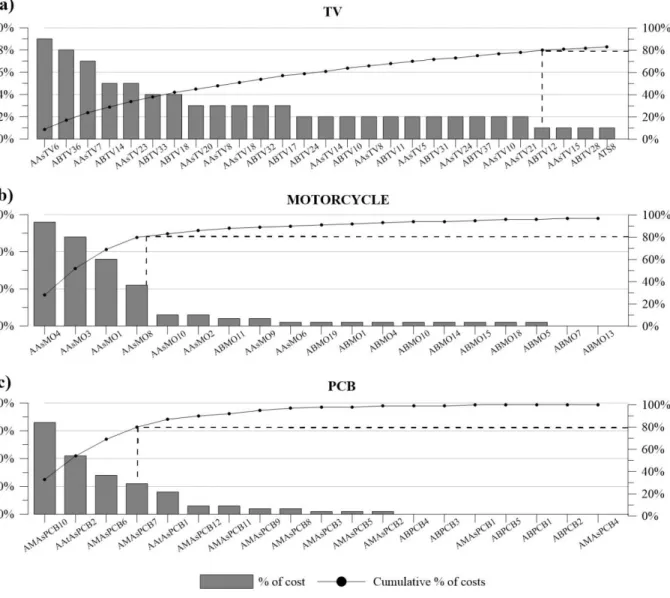
One more benefit of the applied TDABC methodology is the cost determination of the level of sub-processes and activities that the traditional cost system cannot provide. In Figure 8a, the Pareto Chart shows that 80% of total costs in the first case study corresponds to eight sub-processes, being the Assembly of televisions AsTV2 (20%) the most representative. Meanwhile, in the second case study, this percentage corresponds to only two sub-processes: Motorcycle assembly AsMO2 (54%) and Setup motorcycle AsMO1 (20%) (Figure 8b), since they used most of the time, i.e., 27%, 56%, and 20%, respectively. In the third case study, the Quality control MAsPCB5 (33%), Manual assembly of printed circuit boards MAsPCB3 (25%) and Topside assembly AtAsPCB2
(21%) are the most expensive and account 80% of the total costs, given that they use 38%, 29%, and 14% of the used capacity (Figure 8c).
Figure 8. Resources utilized by sub-processes. a) TV assembly. b) Motorcycle assembly. c) PCB assembly
It is also important to determine the cost at the level of activities to have more detailed information for better decision making. Results indicate that in the first case study, 80% of costs belong to 24 activities (Figure 9a). The most representative activities were: Joining TV parts AAsTV6 (9%), Starting orders ABTV36 (8%), and Put TV accessories AAsTV7 (7%). The second case study has only four activities (Figure 9b): Joining motorcycle accessories AAsMO4 (28%), Joining motorcycle parts AAsMO3 (24%), Unpack motorcycle supplies AAsMO1 (18%), and Product inspection AAsMO8 (11%). This is because of the considerable use of time during their execution: 11%, 5%, 9%, 29%, 25%, 18, and 11%, respectively. In the third case study (Figure 9c), the most expensive activities that represent 80% of the total costs were: Testing functions and specifications AMAsPCB10 (33%), Assembling side top AAtAsPCB2 (21%), Joining electronic components
AMAsPCB6 (14%), and Welding components AMAsPCB7 (11%). This percentage results in a greater time demand: 38%, 14%, 16%, and 12%, respectively.
Figure 9. Resources utilized by activities a) TV assembly. b) Motorcycle assembly. c) PCB assembly
With these data, TDABC allows realizing the reengineering of most inefficient processes to optimize the use of resources, starting by analyzing the most expensive activities. For example, in the TV assembly, the TV Warehouse process consumes large amounts of resources (47%) and presenting the highest level of inefficiencies (30%). Therefore, the following activities could be taken into account: Activating orders ABTV36 (8%) (Figure 9a). Also, in the Motorcycle assembly, the activity, Loads the boxes of parts in the hydraulic ABMO11 (2%), might be appropriate to be analyzed to improve the efficiency of the process Motorcycle Warehouse (Figure 9b). Regarding the PCB assembly, activities that can be considered are: Testing functions and specifications AMAsPCB10 (33%), Joining electronic components AMAsPCB6 (14%), and Welding components AMAsPCB7 (11%) of the Manual assembly process; as well as, Assembling top side AAtAsPCB2 (21%) of the Automatic assembly process. All these activities can be analyzed, without affecting the efficiency of the production plant as a whole.
The research also had some shortcomings. One of them is the formulation of time equations for Warehouse and Technical Service processes. The reason is that not all activities belonging to the processes mentioned above can be directly related to a specific product. An example is the activities by downloading a truck or auditing of replacement parts. The process costs were assigned to each product based on the time percentage spent in the corresponding assembly processes, as explained above.
On the other hand, the particularity of both investigated companies is that they belong to the same business group in Ecuador with a complex functional organic structure and manner of operating through the parent company, which is in charge of most of the strategic and support processes. Therefore, the financial balances partially reflect the items of administrative expenses and sales, making it difficult to estimate the resources allocated to these processes correctly.
In addition, TDABC costing is applicable only in cases when the practical capacity can be expressed by time measurement (Öker and Adigüzel, 2010). In this sense, the estimation of the practical capacity of the processes based on hourly load was not possible because the staff works for several companies, and their workload depends on the circumstances that arise.
Collecting data for TDABC is not an easy task. Especially when companies do not have an ERP system to identify the number of repetitions of activities both monthly and annually (Ganorkar et al., 2018a). This was the case for analyzing assembles. The frequencies of the activities and the time of their execution obtained during the interviews for strategic, support, and sales processes in some cases resulted in a used daily capacity of more than 24 hours per person. Therefore, a domino effect occurred, affecting the data quality. These inconsistencies added to the low standardization and the irregularity of the processes mentioned above limited the application of costing TDABC only to operating processes.
Conclusions
The aim of this study is the analysis of TDABC application in the assembly industry through comparison with traditional volume-based costing by focusing on manual and semi-automatized production. Findings indicate the existence of overhead and direct labor cost variances between two cost accounting systems. In three case studies, this cost has been decreased under TDABC; however, the assembly with a manual type of production and with the lowest technological use turned out to have fewer cost differences between TDABC and the traditional costing system.
These case studies have also conducted a comparison in unit costs of the products, which also declined by using the TDABC system. The existence of variations in cost analysis between two costing systems indicates that not all the supplied resources were used at its maximum capacity due to inefficiencies in the assembly processes. Nevertheless, some products presented the increase in their unit cost with TDABC that point to possible underestimations under the traditional cost system by the arbitrary apportionment of the costs based on the raw material. This difference is also a result of using manual activities during their assembly, which requires more time. Consequently, these products have a higher cost burden on the TDABC system. That varies from the traditional approach, where the models with automatic production process subsidize the costs of the products, which also require manual processes for their production. These findings extend knowledge about the behavior of TDABC within the assembly industry.
The research also highlights that the benefits of TDABC extend beyond the unit cost determination in the assembly industries. Its approach towards processes allows understanding
business dynamics in a more in-depth and more detailed manner threw consideration of sub-processes and activities. This system could also provide data to support the reengineering of most inefficient processes, process optimization, cost reduction, and facilitate budget planning in new marketing scenarios.
However, TDABC has certain shortcomings in the analysis of the strategic and support processes due to its low standardization and irregularity. The complex functional organic structure within a business group also restricted the application of TDABC methodology to all organizations' processes in the three case studies. This fact confirms that the successful application of the TDABC requires the existence of ERP systems that provide more detailed and accurate information.
This paper also provides significant implications to formulate time equations. Some processes may contain activities that cannot be directly related to a specific product. In this instance, the cost of these processes can be assigned to each product based on the time percentage used in the corresponding assembly processes.
Further studies may investigate the use of benchmarking to compare the process efficiencies of the assembly sector with a similar product portfolio. This, to improve its productivity based on the optimization of industrial processes and the transfer of the best assembly practices. In this sense, Industry 4.0 brings new opportunities in implementing the TDABC costing with highly automated environments besides continuous and instantaneous intercommunication through a regular flow of information to determine the cost dynamically.
Acknowledgments
This study is part of the research project "Management model for the optimization of processes and costs in the Assembly Industry," supported by the Research Department of the University of Cuenca (DIUC). The authors gratefully acknowledge the contributions and feedback provided by the IMAGINE Project team and the enterprises utilized as case studies.
References
Adkins, T. (2008), "Activity Based Costing Under Fire. Five Myths about Time-Driven Activity Based Costing.", Beye NETWORK, available at: http://www.b-eye-network.com/view/7050 (accessed 20 December 2018).
Areena, S.N. and Abu, M.Y. (2019), "A Review on Time-Driven Activity-Based Costing System in Various Sectors", Journal of Modern Manufacturing Systems and Technology, Vol. 2 No. 1, pp. 15–22.
Chansaad, A., Rattanamanee, W., Chaiprapat, S. and Yenradee, P. (2012), "A fuzzy time-driven activity-based costing model in an uncertain manufacturing environment", presented at the Asia Pacific Industrial Engineering and Management Systems Conference, Phuket, Thailand, pp. 1949–1959.
Cooper, D.J. and Morgan, W. (2008), "Case Study Research in Accounting", Accounting Horizons, Vol. 22 No. 2, pp. 159–178. https://doi.org/10.2308/acch.2008.22.2.159.
Cooper, R. and Kaplan, R.S. (1988), "How cost accounting distorts product costs", Management Accounting, Vol. 69 (10), p. 20.
Dejnega, O. (2011), "Method Time Driven Activity Based Costing", Journal of Applied Economic Sciences (JAES), Vol. VI No. 15, pp. 9–15.
Everaert, P., Bruggeman, W., Anderson, S.R., Levant, Y. and Sarens, G. (2008), "Cost modeling in logistics using time‐driven ABC: Experiences from a wholesaler", International Journal of Physical Distribution & Logistics Management, Vol. 38 No. 3, pp. 172–191.
https://doi.org/10.1108/09600030810866977.
Ganorkar, A.B., Lakhe, R.R. and Agrawal, K.N. (2018a), "Implementation of TDABC in SME: A Case Study", Journal of Corporate Accounting & Finance, Vol. 29 No. 2, pp. 87–113.
https://doi.org/10.1002/jcaf.22327.
Ganorkar, A.B., Lakhe, R.R. and Agrawal, K.N. (2018b), "Time driven activity based costing (TDABC) model for cost estimation of welding process for a SSI", Industrial Engineering Journal, Vol. 10 No. 9, available at: https://doi.org/10.26488/IEJ.10.9.62.
Gervais, M., Levant, Y. and Ducrocq, C. (2010), "Time-Driven Activity-Based Costing (TDABC): An Initial Appraisal through a Longitudinal Case Study", JAMAR, Vol. 8 No. 2.
Kaplan, R.S. and Anderson, S.R. (2003), Time-Driven Activity-Based Costing, SSRN Scholarly Paper No. ID 485443, Social Science Research Network, Rochester, NY, available at: https://papers.ssrn.com/abstract=485443 (accessed 4 September 2017).
https://doi.org/10.2139/ssrn.485443.
Kaplan, R.S. and Anderson, S.R. (2007), Time-Driven Activity-Based Costing: A Simpler and More Powerful Path to Higher Profits, Harvard Business School Press, Boston, USA. Medeiros, H.D.S., Santana, A.F.B. and Guimarães, L.D.S. (2017), “The use of costing methods in
lean manufacturing industries: a literature review”, Gestão & Produção, Vol. 24 No. 2, pp. 395–406. https://doi.org/10.1590/0104-530x2183-16.
Meric, E. and Gersil, M. (2018), "Usability of Time Driven Activity Based Costing Methods in the Budgeting Process of SMEs", Business and Economics Research Journal, Vol. 9 No. 4, pp. 961–978. https://doi.org/10.20409/berj.2018.134.
Mortaji, S.T.H., Bagherpour, M. and Mazdeh, M.M. (2013), "Fuzzy Time-Driven Activity-Based Costing", Engineering Management Journal, Vol. 25 No. 3, pp. 63–73.
https://doi.org/10.1080/10429247.2013.11431983.
Namazi, M. (2016), "Time Driven Activity Based Costing : Theory, Applications and Limitations", Iranian Journal of Management Studies, Vol. 9 No. 3, pp. 457–482.
Öker, F. and Adigüzel, H. (2010), "Time-driven activity-based costing: An implementation in a manufacturing company", Journal of Corporate Accounting & Finance, Vol. 22 No. 1, pp. 75–92. https://doi.org/10.1002/jcaf.20646.
Pawłyszyn, I. (2017), "Time-driven activity based costing as a basis for undertaking lean activities", LogForum, Vol. Vol. 13, no. 2, available at: https://doi.org/DOI: 10.17270/J.LOG.2017.2.2. https://doi.org/10.17270/J.LOG.2017.2.2.
Rahman, A., Islam, M.M. and Hossain, /M. L. (2018), "Determination of Total Labor Cost Based on Time Driven Activities", Global Science and Technology Journal, Vol. 6(2), pp. 85– 106.
Ramida, P. and Rungchat, C.I. (2015), "Analysis of Wooden Toy Manufacturing Costs Through the Application of a Time-Driven Activity-Based Costing System", Vol. 65, presented at the Symposium on Mechanical Engineering, Industrial Engineering, and Robotics 2015 (MIER2015), Memoirs of the Muroran Institte of Technology, pp. 7–14.
Reynolds, A., Fourie, H. and Erasmus, L. (2018), "A framework for time-driven activity-based costing implementation at small and medium enterprises", The Southern African Journal of Entrepreneurship and Small Business Management, Vol. 10 No. 1, p. 11.
Ruiz de Arbulo, P., Fortuny, J., García, J., Díaz de Basurto, P. and Zarrabeitia, E. (2012), "Innovation in Cost Management. A Comparison Between Time-Driven Activity-Based Costing (TDABC) and Value Stream Costing (VSC) in an Auto-Parts Factory", in Sethi, S.P., Bogataj, M. and Ros-McDonnell, L. (Eds.), Industrial Engineering: Innovative Networks, Springer London, London, pp. 121–128. https://doi.org/10.1007/978-1-4471-2321-7_14.
Santana, A., Afonso, P., Zanin, A. and Wernke, R. (2017), "Costing models for capacity optimization in Industry 4.0: Trade-off between used capacity and operational efficiency",
Procedia Manufacturing, Vol. 13, pp. 1183–1190.
https://doi.org/10.1016/j.promfg.2017.09.193.
Siguenza-Guzman, L., Van den Abbeele, A., Vandewalle, J., Verhaaren, H. and Cattrysse, D. (2013), "Recent evolutions in costing systems: A literature review of Time-Driven Activity-Based Costing", Review of Business and Economic Literature, Vol. 58 No. 1, pp. 34–64.
Soekardan, D. (2016), "An Analysis Of Activity Based Costing: Between Benefit And Cost For Its Implementation", International Journal of Scientific & Technology Research, Vol. 5(6), pp. 334–339.
Stout, D. and Propri, J. (2011), "Implementing Time-Driven Activity-Based Costing at a Medium-Sized Electronics Company", Management Accounting Quarterly, Vol. 12(3), pp. 1–11. Szychta, A. (2010), "Time-Driven Activity-Based Costing in Service Industries", Social Sciences,
Vol. 1(67).
Tse, S.C. and Gong, M. (2009), "Recognition of idle resources in time-driven activity-based costing and resource consumption accounting models", Journal of Applied Management Accounting Research, Vol. 7 No. 2, pp. 41–54.
Wouters, M. and Stecher, J. (2017), "Development of real-time product cost measurement: A case study in a medium-sized manufacturing company", International Journal of Production Economics, Vol. 183, pp. 235–244. https://doi.org/10.1016/j.ijpe.2016.10.018.