1 Corresponding author: Email: [email protected]
CoST AND BENEfIT ANALYSIS of RSPo CERTIfICATIoN
(CASE STUDY IN PT BCA oIL PALM PLANTATIoN IN PAPUA)
faris Salman
*)1, Mukhamad Najib
**), and Setiadi Djohar
***) *) School of Business, Bogor Agricultural UniversityPajajaran Road, Bogor 16151
**) Department of Management, Faculty of Economics and Management, Bogor Agricultural University Kamper Road, Wing 4 Level 5, Campus IPB Darmaga, Bogor 16680
***) PPM School of Management Menteng Raya Road No 9 Road, Jakarta 10340
Abstract: RSPO is sustainable. It is one of many certification labels to justify a sustainable palm oil practice. The objective of this study is to identify monetary benefit and cost with the existing operating scenario of the company, or if the company is registered as the RSPO member. To identify the benefit or cost that might occur, this research compared the NPV, IRR, and benefit-cost ratio among the alternative scenarios. An ex-ante projective cash flow is simulated using the company’s historical financial report from year 2012-2016 to obtain monetary perspective of the amount of money required by the plantation to proceed with certification. Certification should cost the plantation around 466 billion rupiahs with only 66 billion rupiahs of additional income from CPO premium if the company is able to complete its certification by 2019. Total benefit of income obtained from selling the certified products of CPO and PKO may cover the certification expense which does not exceed the cost paid with the discrepancy of 331 billion rupiahs. This amount can be used to establish another palm oil plantation, create jobs and contribute to domestic products. However, the net monetary loss is close to the value obtained from timber upon land clearing, which was at 286 billion rupiahs. Being sustainable is probably never about monetary value but more about the responsibility of managing the sustainable oil palm plantation and the environment that must be taken care of.
Keywords: RSPO, oil palm plantation, cost and benefit analysis, oil palm in Papua, RSPO finansial benefit
Abstrak: RSPO merupakan salah satu label sertifikasi yang digunakan untuk menjamin praktik kelapa sawit berkelanjutan. Penelitian ini ingin mengidentifikasi manfaat dan biaya atas skenario operasi perkebunan kelapa sawit saat ini atau jika perusahaan mendaftar sebagai anggota RSPO. Untuk mengidentifikasi manfaat atau biaya yang dapat timbul, penelitian ini membandingkan arus kas, NPV, IRR, dan rasio keuntungan dan manfaat dari keadaan saat ini dengan skenario-skenario alternatif. Simulasi proyeksi arus kas secara ex-ante dilakukan berdasarkan laporan keuangan perusahaan dari tahun 2012-2016 untuk memperoleh gambaran kebutuhan uang yang dibutuhkan oleh perusahaan untuk melakukan sertifikasi. Biaya kegiatan sertifikasi yang dibutuhkan sekitar 466 milyar rupiah namun dengan hanya tambahan pendapatan sebesar 66 milyar rupiah dari premium CSPO jika perusahaan dapat menyelesaikan sertifikasi di tahun 2019. Manfaat finansial keseluruhan yang diperoleh dari penjualan CPO dan PKO bersertifikasi tidak lebih besar dari biaya yang dikeluarkan dengan selisih sebesar 331 milyar rupiah. Jumlah ini dapat digunakan sebagai modal awal untuk membuat sebuah perkebunan kelapa sawit baru yang menciptakan lapangan pekerjaan. Terlebih, selisih pengeluaran tersebut setara dengan pendapatan dari penjualan kayu hasil pembukaan lahan, yaitu 286 milyar rupiah. Mengejar sertifikasi RSPO tidak dapat dilakukan dengan tujuan perolehan harga premium, tetapi harus didasarkan pada keinginan melakukan pengelolaan kebun kelapa sawit yang lebih baik untuk
keberlanjutan industri dan lingkungan.
Kata kunci: RSPO, kebun kelapa sawit, analisis biaya dan manfaat, kebun kelapa sawit di Papua, manfaat finansial RSPO
INTRoDUCTIoN
Indonesia has produced an increasing amount of palm oil in the last 10 years. It was increased by 170.9% (FAO, 2015) and probably will steadily hike since palm oil industry is a good profitable industry (Svatoňová et al. 2015; Prafitri et al. 2017). However, the average Indonesian palm oil productivity has been stagnant since 2004. This concludes a growing area of oil palm plantation. Vijay et al. (2016) showed the existence of a developing oil palm plantation area for 91.7% since 1989 where half of it comes from converted forest areas.
The expanding palm oil industry also creates threats to environments and social community around the forest as well as threats to biodiversity (Moreno-Peñaranda et al. 2015) especially when oil palm practices in most plantations have not run well. Wisena et al. (2014) and Wisena (2015) wrote that palm oil plantation practices in Indonesia were leaning more toward economic benefits rather than preserving environment or maintaining social aspect of the social community around the forest. Ideally, the balance among the aspects of economy, social, and environment should be good and correlated among each other (Keraf, 2002).
As the main agriculture product originated from Indonesia, palm oil commodity has a strategic position in national income. On the other hand, the land oil palm plantation required also creates questionable sustainable practice and environment biodiversity. Vijay et al. (2016) added that a portion of Indonesian forests has been threatened for conversion to oil palm i.e. 30% of the total current area of the entire oil palm plantation area. A similar concern also came from NGOs especially from Europe who are aware of the environment. Indonesia is the 2nd largest palm oil importer (Rifin, 2010). In 2020, Europe has target to source 100% of their vegetable oil only from sustainably certified products and that includes palm oil. Europe is not alone in this. Malaysia and Indonesia have a target of 50%, India of 30% and China of 10% (Newswire, 2015). Having a credible sustainability certification can support further market penetration of palm oil in international market (Novelli, 2016).
A sustainable production and environment are two from triangle sustainable development principles from
be able to adapt with industrial dynamics. Wisena et al. (2014) and Wisena (2015) wrote a structure of system element of change for sustainable palm oil management with oil palm certification, ISPO and RSPO, as the initiative action.
Companies go sustainable for various reasons. Bansal & Roth (2000) said that there are three main reasons for companies to be aware of sustainability issues of staying competitive, rule and law compliance, and environmental awareness. For these reasons, especially to stay competitive in the global palm oil market, a RSPO certification is has to be done. RSPO is currently the best system available for sustainability (Nikoloyuk et al. 2010; Paoli et al. 2010; Obidzinski et al. 2013). To become RSPO member and to have a RSPO certificate enable an oil palm company to claim for having a sustainable oil palm plantation practice. RSPO guarantees this through series of principles and criteria that are in line with sustainable development. The application of RSPO principles and criteria regardless of the prior intent for certification should promote a better oil palm plantation practice. Moreover, to become RSPO member requires administrative and financial readiness from the oil palm plantation owners. Foul practice of oil palm plantation management in the past may not be sustainable, while the change to become sustainable in an oil palm plantation is started by how they produce the fresh fruit bunch (FFB) (Indriantoro et al. 2012).
Sustainability research for palm oil has been increasing since 2004 with the majority research related to palm oil residue and lacks of other aspects, such as economic benefit (Hansen et al. 2015). In previous researches, benefits of RSPO certification rather vary between smallholders and private companies. Smallholders perceive increasing amount of income due to better price, production (Kurniawati et al. 2015), and indicate savings and income securities within smallholders’ farmers (Abazue et al. 2015). On the other hand, private palm oil plantations have no significant differences in FFB production before and after RSPO certification (Nasution, 2013) or have economic advantage after joining the RSPO membership (Febrini et al. 2015; Basiron and Foong-Keong, 2016), potentially due to low premium value (Ruysschaert and Salles, 2014). The previous research established the advantages for RSPO membership in Malaysia (Basiron and Foong-Keong,
and the plan to develop Eastern Indonesia for Food and Energy State (Obidzinski et al. 2013), it is important to understand how the benefits of RSPO might affect the palm oil industry with more marginal suitability. This research aims to analyse the cost and benefit of a RSPO certification in PT BCA oil palm plantation as a point of view of financial readiness for certification. We will view the benefit and cost expense by the organization through cash flow projection with two scenarios, business as usual and RSPO certification. The net cost and benefit between scenarios were compared to glimpse the opportunity from CSPO and to give PT BCA a perspective from certification activity. The scope of discussion is limited to financial benefit and cost simulation spent by PT BCA upon preparing the certification. PT BCA is an entity that owns plantation and mill operation. The mill operation is supplied with fresh fruit bunch (FFB) from its own plantation. PT BCA believes that obtaining certification is costly and will not bring any financial benefits.
METhoDS
The research was conducted in oil palm plantation owned by PT BCA, Papua Province, from October 2016 to April 2017. The data used for cash flow projection and benefit cost analysis were secondary data sourced from the company financial report. Cost related to certification was obtained from Basiron and Foong-Keong (2016). Palm oil premium for certified palm oil products (CPO and PKO) was referring to information from GreenPalm (2017).
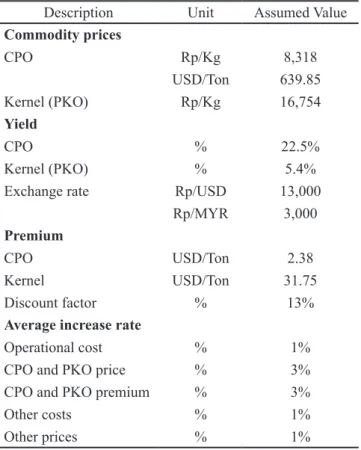
The prices of commodities of CPO and PKO were sourced from the average of past palm oil prices (World Bank, 2017) while the exchange rate for US Dollar and Malaysian Ringgit was based on the average exchange rate in 2016 (Bank Indonesia, 2017). The productivity of oil palm was based on the research from Sutarta dan Rahutomo (2013) with land suitability rate of S3. Cash flow projection assumption for simulation in the year of 2017–2040 in Table 1.
The scenarios for cost benefit analysis in this research are that the company chooses to certify by 2019 or not to certify (Figure 1). Scenario in cost benefit analysis
is one of many aspects from cost and benefit analysis conceptual steps (Boardman et al. 2014). The duration for cost-benefit analysis was determined up to 2040 based on the end of concession license. This study projected the required cost for RSPO certification, recurrence activities to keep certified and benefits that come from premium of certified palm oil products. Net present value (NPV) and Internal rate of return (IRR) were used to compare the general condition of the oil palm plantation between scenarios.
NPV was calculated from discounted annual cash flows using i for T years. The IRR is the value of discount factor when the NPV equals to 0 (zero).
Table 1. Cash flow projection assumption for simulation in the year of 2017–2040
Description Unit Assumed Value Commodity prices CPO Rp/Kg 8,318 USD/Ton 639.85 Kernel (PKO) Rp/Kg 16,754 Yield CPO % 22.5% Kernel (PKO) % 5.4%
Exchange rate Rp/USD 13,000
Rp/MYR 3,000
Premium
CPO USD/Ton 2.38
Kernel USD/Ton 31.75
Discount factor % 13%
Average increase rate
Operational cost % 1%
CPO and PKO price % 3%
CPO and PKO premium % 3%
Other costs % 1%
Other prices % 1%
RESULTS
Cost and Benefit for Establishment Period
PT BCA started the operational activity to build oil palm plantation in 2011 with land clearing and plantation arrangement. Planting activity started in 2012 and finished in 2015 with total of 11,821 ha area. Palm oil plants are divided based on its age; therefore, based on the planting activity there are four age-classes of palm oil plants. Based on the planting report, as wide as 3,000 ha areas of palm oil were planted in 2012, 2013, and 2014, while 2,821 ha areas were planted in 2015. Different age-class produces different amount of fresh fruit bunch (FFB) and has different rate of CPO yield. First harvest was carried out in 2015 with total production at about 3,900 ton CPO and increased to
11.750 ton in 2016. During this year, the company was still in the establishment period and had no RSPO certification yet.
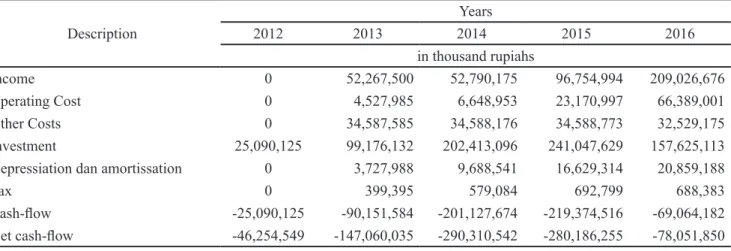
The oil palm plantation spent 962 million rupiahs in the first five year, not including tax and depreciation. It was allocated as investment cost, operational cost for plantation and mill, and other costs related to oil palm laws and regulation. Earnings from 2011 to 2016 came from two main sources; the timber resulted from land clearing and from CPOs and PKOs. The price of timber was regulated in Regulation of Ministry of Trade Republic Indonesia No. 12/M-DAG/PER/3/2012 for Rp1,150,000/m3. The average volume extracted, based on the plantation record, was 15 m3/ha. The detail of cost and earnings within the period of 2012–2016 is given in Table 2.
Table 2. Operational cost and earnings of PT BCA in the establishment period Description Years 2012 2013 2014 2015 2016 in thousand rupiahs Income 0 52,267,500 52,790,175 96,754,994 209,026,676 Operating Cost 0 4,527,985 6,648,953 23,170,997 66,389,001 Other Costs 0 34,587,585 34,588,176 34,588,773 32,529,175 Investment 25,090,125 99,176,132 202,413,096 241,047,629 157,625,113
Depressiation dan amortissation 0 3,727,988 9,688,541 16,629,314 20,859,188
Tax 0 399,395 579,084 692,799 688,383
Cash-flow -25,090,125 -90,151,584 -201,127,674 -219,374,516 -69,064,182 Net cash-flow -46,254,549 -147,060,035 -290,310,542 -280,186,255 -78,051,850 Source: PT BCA (2017)
help for oil palm farmers to be certified, and product segregation. Meanwhile, the benefits of successful RSPO certification come from reduced social conflicts, better oil palm plantation operation, reduced worker turn-over, increased moral of workers, access to certified sustainable palm oil (CSPO) markets, and better access of monetary capital.
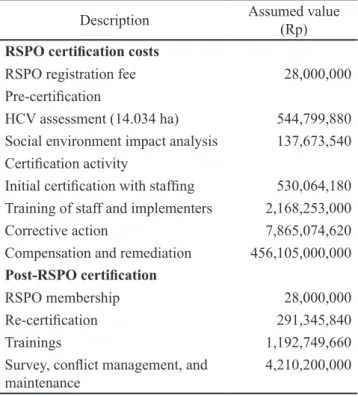
There are two main categories of costs of RSPO (Tabel 4) used to project the costs of certification and post-certification. Certification cost is spent once in the certification year while the post-certification cost is spent annually after the oil palm plantations obtain the sustainability certificate. Human resource training cost is planned to be spent in two years and corrective action is projected to be spent in three years. The price of CPO for projection after RSPO certification is assumed to be similar with previous scenario considering the fact that the CPO prices are not driven by certification status, but significantly by stocks (Abdullah, 2013). However, the increased price of CPO due to CSPO premium price is applied to the simulation.
After obtaining RSPO certificate, PT BCA can sell their certified sustainable palm oil products with added premium. Total of discounted earnings from the added premium was 66,921 billion rupiahs, and total discounted earnings up to year 2040 were calculated at 8,303 trillion rupiahs. The oil palm plantation spent 3,875 trillion rupiahs in the same duration. With certification scenario in place, the NPV of PT BCA was estimated at 3,531 trillion rupiahs with IRR at 32.41% (Table 5).
Cost and Benefit Projection without RSPO Certification
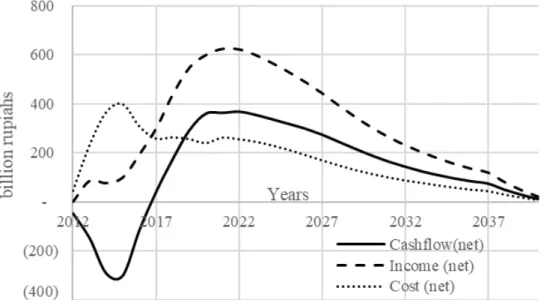
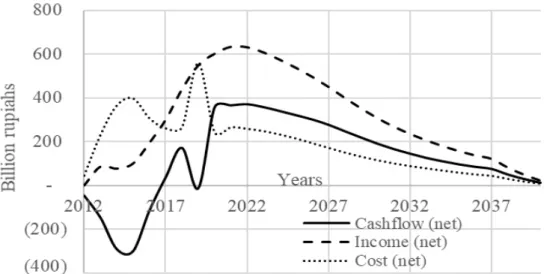
Without conducting the certification, the oil palm plantation is projected to be 8,236 trillion rupiahs and spends approximately 3,525 trillion rupiahs. NPV calculated from oil palm plantation activities from 2012 to 2040 projects the value of 3.814 trillion rupiahs with IRR at 34.86% (Table 3). The cash flow movement for non-certification scenario is illustrated in Figure 2. Table 3. Financial feasibility index of PT BCA oil
palm plantation activity for 2012–2040 without RSPO certification.
Description Value
IRR 34.86%
NPV Rp3,814,544,646,853
B/C 2.33
Cost and Benefit Projection with RSPO Certification
Levin et al. (2012) conducted a research to identify the additional costs and benefits for companies or oil palm plantation owners after they obtain RSPO certificate. WWF (World Wildlife Fund), FMO (The Netherlands Development Finance Company), and CDC (The UK’s Development Finance Institution) studied eight oil palm plantations in Indonesia, Malaysia, and Western Africa with different kinds of sizes and ownerships. This research concluded that the costs in RSPO certification are needed for various purposes such as: identification and management for high conservation value (HCV) area, audit and certification, hiring and
Table 4. Certification and post-certification cost for RSPO
Description Assumed value (Rp)
RSPO certification costs
RSPO registration fee 28,000,000
Pre-certification
HCV assessment (14.034 ha) 544,799,880 Social environment impact analysis 137,673,540 Certification activity
Initial certification with staffing 530,064,180 Training of staff and implementers 2,168,253,000
Corrective action 7,865,074,620
Compensation and remediation 456,105,000,000
Post-RSPO certification
RSPO membership 28,000,000
Re-certification 291,345,840
Trainings 1,192,749,660
Survey, conflict management, and
maintenance 4,210,200,000
Source: Basiron and Foong-Keong (2016) ( 1 EUR = Rp14.000; 1 MYR = 3.000)
Total calculated cost that should be spent for certification and re-certification in this scenario up to year 2040 is at 398.87 billion rupiahs. The cashflow movement is illustrated at Figure 3.
Cost and Benefit Projection with Delayed RSPO Certification
Generally, oil palm produces an increasing amount of FFB annually until the age of 12 or 13 years before then decreasing until the end of plantation age at 25 years (Sutarta and Rahutomo, 2013). Based on this estimation, the highest peak of palm oil production will happen in 2027. Assuming the preparation for RSPO starts in 2025, and certification is conducted in 2027, with every other cost unchanged, the NPV analysis of the oil palm company is calculated at 3.749 trillion
The company is projected to earn 26.06 billion rupiahs from RSPO premium with total discounted earnings at 8,262 trillion rupiahs. Expenditure wise, the company is projected to expense 3.647 trillion rupiahs up to year 2040 (Table 6).
Other possibility is to delay the certification by 5 years. By doing this, the calculated NPV decreased to 3,640 trillion rupiahs with IRR at 33.93% (Table 7). Total discounted earnings from premium with this scenario are 53,76 billion rupiahs with total discounted earnings up to year 2040 at 8.29 trillion rupiahs and discounted total expenditure is at 3,753 trillion rupiahs.
Benefit-Cost Analysis of RSPO Certification
Based on the cashflow projection before and after RSPO certification, the oil palm financial condition in general will decline in the year of certification. There is cash-out projected to happen by 715.54 billion rupiahs with projected income at 699.46 billion rupiahs. 65.82% of the total expensed money that year is to be spent for certification in which much of certification expense will be posted for remediation and compensation because PT BCA cleared the area for oil palm plantation after year 2005 without conducting HCV assessment. This liability is valued for 2.500 USD/ha cleared area by RSPO (RSPO 2015).
The difference between net income from certification scenario and without certification scenario was 66.92 billion rupiahs or 1.9% of the total NPV. This amount is an insignificant impact to the oil palm plantation income especially when the difference of net expenditure between the two scenarios is at 350.16 billion rupiahs. Although, the difference of net expenditure is somewhat near to the total income from land clearing the oil palm plantation earns by selling its timber. The total net value of harvested timber from land clearing is at 286.78 billion rupiahs. This value amount to a direct value of forest (Phelps et al. 2014), considering to the exploitation nature. Other values, such as indirect values and non-use values might have made the cleared forest value similar or higher than the compensation cost. The absence of certification benefit is in line with the previous researches by Nasution (2013), Febrini et al. (2015), and Basiron and Foong-Keong (2016). The minor benefit from CSPO premium is also confirmed by the research of Ruysschaert and Salles (2014). Table 5. Financial feasibility index of PT BCA
for the period of 2012–2040 with RSPO certification
Description Value
IRR 32.41%
NPV Rp3,531,309,509,650
Figure 3. Historical and projected cash flow for the period of 2014–2040 with certification
Figure 4. Historical and projected cash flows for the year of 2014–2040 with certification postponed for 10 years (a) and 5 years (b)
(a)
Postponing the certification also will affect the company much. The change in the financial indicator shows that the difference between having certification as planned (2019), 5-year delay (2022) or 10-year delay (2027) only gives minor bump to the NPV and IRR. By delaying the certification to year 22, the NPV will increase by 109.12 billion with IRR going up to 1.52%. A 10-year certification lag will increase NPV as much as 187.36 billion and IRR 2.24%. Total income which actually drops as delaying the certification is equal to the setback of the extra income from the premium. However, since the addition from premium is insignificant, the setback from decreasing amount of premium is also minor. The possible non-monetary benefits will take effects few years after certification takes place. The corrective action to create better human resource management and better agriculture practice should be able to improve the overall practice in PT BCA. Annual or biennial internal audit before routine RSPO check-ups ensures that better application of operational aspect takes place and is permanently installed. Meanwhile, the yield of palm oil will not increase much due to the limitation of land suitability, and the general practice may be better and improve moral of the workers.
Managerial Implication
The major expense for the company in certifying their palm oil products was for the compensation and remediation which cover the new planting procedures required by the RSPO. Prior to adjusting the company
a detailed New Planting Procedure analysis from any eligible body to figure out the real compensation, remediation, and protected areas in palm oil plantation management area. By the principal of benefit-cost analysis, the chosen scenario should be the one with the least cost or most benefit from other alternatives. With the amount of cost incurred by the certification, the company and its group may consider not to certify PT BCA and establish a new palm oil plantation specifically built to be certified instead.
CoNCLUSIoNS AND RECoMMENDATIoNS
Conclusions
This research may give insight on RSPO certification effects for PT BCA and other private palm oil plantations, especially from the financial point of view. However, it is best for PT BCA to conduct the RSPO certification for competitive advantage and market defence in the future, especially when supply drives the price of CPO.
The difference between NPV in both scenarios is at 283.24 billion rupiahs with no-certification scenario giving the higher monetary value than certification scenario. This is caused by the fact that the amount of money spent in certification cannot be covered by the premium alone. The total premium obtained from selling certified palm oil product only results in an additional income amounting to 66.29 billion rupiahs. This makes the certification scenario is not appealing financially. However, the corrective action resulting from certification and the annual assessment may bring non-financial benefits to the oil palm plantation such as better agriculture practice and better human resource organization. Postponing the certification does not give any significant benefits financially.
Recommendations
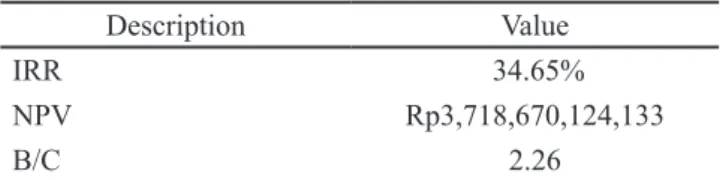
It is known that voluntary action towards sustainability such RSPO is created with sustainability in mind. Nonetheless, the argument of benefit obtained by the private palm oil plantation is leaning towards next to none. An objective study with larger samples contrasting the benefit and cost differences between certified and not-certified private palm oil plantations is encouraged Table 6. Financial feasibility index of PT BCA oil
palm plantation activity for 2012–2040 with 10 years delayed RSPO certification
Description Value
IRR 34.65%
NPV Rp3,718,670,124,133
B/C 2.26
Table 7. Financial feasibility index of PT BCA oil palm plantation activity for the period of 2012–2040 with 5 years delayed RSPO certification
Description Value
IRR 33.93%
NPV Rp3,640,429,983,767
The decreasing financial net benefit after certification can be further studied with additional consideration to other environmental value other than the direct value. These values can be used as the vocal argument to persuade oil palm plantation or farmers to conduct better practice to pursue sustainability with additional benefit from premium, not the other way around.
REfERENCES
Abazue CM, Er AC, Ferdous Alam ASA, Begum H. 2015. Oil palm smallholders and its sustainability practices in Malaysia. Mediterranean Journal of Social Sciences 6:482–488. https://doi. org/10.5901/mjss.2015.v6n6s4p482.
Abdullah R. 2013. An analysis on trends of vegetable oil prices and some factors affecting. Oil Palm Indonesia Economic Journal 13:1–14.
Bank Indonesia. 2017. Kurs transaksi Bank Indonesia. http://www.bi.go.id/id/moneter/informasi-kurs/ transaksi-bi/Default.aspx [13 April 2017]. Bansal P, Roth K. 2000. Why companies go green: a
model of ecological responsiveness. Academy of Management Journal 43:717–736. https://doi. org/10.2307/1556363.
Basiron Y, Foong-Keong Y. 2016. The Burden of RSPO certification cost on malaysian palm oil industry and national economy. Journal of Oil Palm, Environment and Health 7:19–27.
Boardman AE, Greenberg DH, Vining AR, Weimer D. 2014. Cost-Benefit Analysis: Concept and Practice. 4th ed. New Jersey: Pearson.
FAO. 2015. FAOSTAT. Food Agric. Organ. United Nation.
Febrini N, Lubis SN, Kusuma SI. 2015. Dampak penterapan RSPO terhadap pendapatan di PT. Bakrie Sumatera Plantation, Tbk. Journal on Social Economic of Agriculture and Agribusiness
4:1–8.
Fritz M, Schiefer G. 2008. Sustainability in Food Networks. In: Agriculture. Bonn: GEWISOLA. GreenPalm. 2017. Market Overview. http://greenpalm.
org/the-market/market-overview [13 April 2017].
Hansen SB, Padfield R, Syayuti K, Evers S, Zakariah Z, Mastura S. 2015. Trends in global palm oil sustainability research. Journal of
Cleaner Production 100:140–149. https://doi.
org/10.1016/j.jclepro.2015.03.051.
Indriantoro FW, Sa’id EG, Guritno P. 2012. Rantai nilai
produksi minyak sawit berkelanjutan. Jurnal Manajemen & Agribisnis 9(2):108–116.
Keraf AS. 2002. Etika Lingkungan. Jakarta: Penerbit Buku Kompas.
Kurniawati N, Glasbergen P, Offermans A. 2015. Sustainability certification and palm oil smallholders ’livelihood : a comparison between scheme smallholders and independent smallholders in Indonesia. International Food and Agribusiness Management Review 18(3):25– 48.
Levin J, Ng G, Fortes D, Garcia S, Lacey S, Grubba D. 2012. Profitability and Sustainability In Palm Oil Production: Analysis of Incremental Financial Costs and Benefits of RSPO Compliance. Swiss: World Wildlife Fund (WWF).
Moreno-Peñaranda R, Gasparatos A, Stromberg P, Suwa A, Pandyaswargo AH, Puppim de Oliveira JA. 2015. Sustainable production and consumption of palm oil in Indonesia: What can stakeholder perceptions offer to the debate? Sustainable
Production and Consumption 4:16–35. https://
doi.org/10.1016/j.spc.2015.10.002.
Nasution MR. 2013. Analisis biaya dan manfaat pada sertifikasi RSPO bagi perusahaan kelapa sawit [tesis]. Medan: Universitas Sumatera Utara. Nikoloyuk J, Burns TR, de Man R. 2010. The
promise and limitations of partnered governance: the case of sustainable palm oil.
Corporate Governance 10:59–72. https://doi. org/10.1108/14720701011021111.
Novelli E. 2016. Sustainability as a success factor for palm oil producers supplying the European vegetable oil markets. Oil Palm Industry Economic Journal 16:8–17.
Obidzinski K, Takahashi I, Dermawan A, Komarudin H, Andrianto A. 2013. Land Use Policy Can large scale land acquisition for agro-development in Indonesia be managed sustainably ? Land use
Policy 30:952–965. https://doi.org/10.1016/j.
landusepol.2012.06.018.
Paoli GD, Yaap B, Wells PL, Sileuw A. 2010. CSR, Oil Palm and the RSPO: Translating Boardroom Philosophy into Conservation Action on the Ground. Tropical Conservation
Science 3(4):438–446. https://doi.
org/10.1177/194008291000300408.
Phelps J, Hariyanti B, Sinaga AC, Dermawan A. 2014. Valuasi lingkungan di Indonesia. Brief 32 Oktober 2014.
of working capital on the profitability of palm oil plantation companies. Indonesian Journal Of Business And Entrepreneurship (IJBE)
3(2): 111–120. doi:http://dx.doi.org/10.17358/ ijbe.3.2.111.
PR Newswire. 2015. European Palm Oil Industry Sets Course for 100% Certified Sustainable Palm Oil by 2020. http://search.proquest.com/docview/16 88705924/2098A706443D40BFPQ/2?accounti d=32819 [7 September 2016].
Rifin A. 2010. Export competitiveness of Indonesia’s palm oil product. Trends in Agricultural Economics 3: 1–18. https://doi.org/10.3923/ tae.2010.1.18.
Ruysschaert D, Salles D. 2014. Towards global voluntary standards: Questioning the effectiveness in attaining conservation goals. The case of the Roundtable on Sustainable Palm Oil (RSPO).
Ecological Economics 107:438–446. https://doi. org/10.1016/j.ecolecon.2014.09.016.
Sutarta E, Rahutomo S. 2013. New Standard for FFB Yield of IOPRI’s Planting Materials Based on Land Suitability Class. Medan.
Svatoňová T, Herák D, Kabutey A. 2015. Financial profitability and sensitivity analysis of palm oil plantation in indonesia. Acta Universitatis Agriculturae et Silviculturae Mendelianae
Brunensis 63:1365–1373. https://doi.
org/10.11118/actaun201563041365.
Vijay V, Pimm SL, Jenkins CN, Smith SJ. 2016. The Impacts of Oil Palm on Recent Deforestation and Biodiversity Loss. PLoS ONE 11(7): 1–19. https://doi.org/10.1371/journal.pone.0159668. Wisena BA. 2015. Analisis strategi daya saing industri
kelapa sawit yang berkelanjutan [disertasi]. Bogor: Institut Pertanian Bogor
Wisena BA, Daryanto A, Arifin B, Oktaviani R. 2014. Sustainable development strategy for improving the competitiveness of oil palm industry.
International Research Journal of Business Studies 7(1):13–37. https://doi.org/10.21632/ irjbs.7.1.13-37.
World Bank. 2017. Global Economic Monitor (GEM) commodities. http://databank.worldbank.org/ data/reports.aspx?source=global-economic-monitor-(gem)-commodities# [13 Apr 2017].