University of Nebraska - Lincoln
DigitalCommons@University of Nebraska - Lincoln
USDA National Wildlife Research Center - Staff
Publications
U.S. Department of Agriculture: Animal and Plant
Health Inspection Service
2014
Fitting outbreak models to data from many small
norovirus outbreaks
Eamon B. O'Dea
University of Texas at Austin
Kim M. Pepin
Colorado State University
, [email protected]
Ben A. Lopman
Health Protection Agency
Claus O. Wilke
University of Texas at Austin
Follow this and additional works at:
https://digitalcommons.unl.edu/icwdm_usdanwrc
Part of the
Life Sciences Commons
This Article is brought to you for free and open access by the U.S. Department of Agriculture: Animal and Plant Health Inspection Service at DigitalCommons@University of Nebraska - Lincoln. It has been accepted for inclusion in USDA National Wildlife Research Center - Staff Publications by an authorized administrator of DigitalCommons@University of Nebraska - Lincoln.
O'Dea, Eamon B.; Pepin, Kim M.; Lopman, Ben A.; and Wilke, Claus O., "Fitting outbreak models to data from many small norovirus
outbreaks" (2014).
USDA National Wildlife Research Center - Staff Publications
. 1939.
ContentslistsavailableatScienceDirect
Epidemics
jo u rn al h om ep age : w w w . e l s e v i e r . c o m / l o c a t e / e p i d e m i c s
Fitting
outbreak
models
to
data
from
many
small
norovirus
outbreaks
Eamon
B.
O’Dea
a,∗,
Kim
M.
Pepin
b,c,
Ben
A.
Lopman
d,1,
Claus
O.
Wilke
a,eaSectionofIntegrativeBiology,UniversityofTexasatAustin,1UniversityStationC0930,Austin,TX78712,USA bFogartyInternationalCenter,NIH,Bethesda,MD20892,USA
cDepartmentofBiology,ColoradoStateUniversity,FortCollins,CO80523,USA
dGastrointestinal,EmergingandZoonoticInfectionsDepartment,CentreforInfections,HealthProtectionAgency,LondonNW95EQ,UK
eCenterforComputationalBiologyandBioinformaticsandInstituteforCellandMolecularBiology,UniversityofTexasatAustin,Austin,TX78712,USA
a
r
t
i
c
l
e
i
n
f
o
Articlehistory:
Received11June2012
Receivedinrevisedform23October2013 Accepted23December2013
Availableonline8January2014
Keywords:
Stochasticepidemicmodel Parameterestimation Norovirus
Health-care-associatedinfection Generalizedlinearmodel
a
b
s
t
r
a
c
t
Infectiousdiseaseoftenoccursinsmall,independentoutbreaksinpopulationswithvarying
character-istics.Eachoutbreakbyitselfmayprovidetoolittleinformationforaccurateestimationofepidemic
modelparameters.Hereweshowthatusingstandardstochasticepidemicmodelsforeachoutbreakand
allowingparameterstovarybetweenoutbreaksaccordingtoalinearpredictorleadstoageneralized
lin-earmodelthataccuratelyestimatesparametersfrommanysmallanddiverseoutbreaks.Byestimating
initialgrowthratesinadditiontotransmissionrates,weareabletocharacterizevariationinnumbers
ofinitiallysusceptibleindividualsorcontactpatternsbetweenoutbreaks.Withsimulation,wefindthat
theestimatesarefairlyrobusttothedatabeingcollectedatdiscreteintervalsandimputationofabout
halfofallinfectiousperiods.Weapplythemethodbyfittingdatafrom75norovirusoutbreaksin
health-caresettings.Ourbaselineregressionestimatesare0.0037transmissionsperinfective-susceptibleday,
aninitialgrowthrateof0.27transmissionsperinfectiveday,andasymptomaticperiodof3.35days.
Outbreaksinlong-term-carefacilitieshadsignificantlyhighertransmissionandinitialgrowthratesthan
outbreaksinhospitals.
©2014TheAuthors.PublishedbyElsevierB.V.
Introduction
Acommonanddifficultprobleminepidemiologyistoestimate ratesofdiseasespread.Accurateestimatesoftheseandother pop-ulationparametersarecrucialintheevaluationofdiseasecontrol measures(AndersonandMay,1992;Keeling,2005;Halloranetal., 2009)orbiologicalhypotheses(Lively,2010).Heterogeneity com-plicatestheproblemofobtainingsuchestimates.Forexample,a person’sriskofinfectiondependsoncontactratesandacquired immunity,andthesequantitiescanvarywidelybetweenpeople andoutbreaks.
Norovirus(NoV)epidemiologyprovidesafinecaseinpointof theneedformodelstoaccommodateheterogeneity.Noroviruses arethe mostcommoncause ofdiarrheal diseasein theUnited
∗Correspondingauthor.Tel.:+12027847182.
1 Presentaddress:DivisionofViralDiseases,NationalCenterforImmunization
andRespiratoryDiseases,CentersforDiseaseControlandPrevention,Atlanta,GA 30030,USA.
States,causinganestimated21millioncases(Scallanetal.,2011) and 71,000 hospitalizations per year (Lopman et al., 2011). A geneticallydiversegroupofstrainsisoftencirculatingwithina population.New strainsof thepredominantgenogroup2 geno-type4(GII.4)taxonappearregularlyovertime(Glassetal.,2009), and a person’sriskof infection,given exposure, likely depends onboththeantigenicityofthevirusandthetype-specific immu-nitydevelopedfromtheperson’spreviousexposure(Cannonetal., 2009).Otherimportantheterogeneitiesinclude innate suscepti-bility(whichdepends onaperson’shisto-bloodgroupantigens and secretor status) and age-specific risks of exposure. Out-break investigations (Evans et al., 2002; Thornley et al., 2011; Wikswoetal.,2011)haveprovidedconvincingevidencethat sin-glevomitingincidentsincrowdedsettingscanleadtoscoresof secondarycases.Modelsthataccountforbothbetween-individual andbetween-populationheterogeneityareneededtoobtainthe accurate parameter estimates required for predicting outbreak dynamicsand implementingeffectivecontrols.Atpresent, con-trolmeasures arebased ongeneral infection-controlprinciples (Centers forDiseaseControlandPrevention,2011)andthusare likelytobesomewhatinefficient.
A further complicationfor modeling norovirus transmission isthat itoftenoccursin smalloutbreaks.Thetransmissionand
1755-4365©2014TheAuthors.PublishedbyElsevierB.V.
http://dx.doi.org/10.1016/j.epidem.2013.12.002
Open access under the CC BY-NC-SA license.
recoverytimesofcasesin smalloutbreaksarecorrelated(Rida, 1991),whichmakesestimationdifficultwhenusingdatafroma singleoutbreak.Anobvioussolutiontoreducingtheinaccuracy causedbywithin-outbreakcorrelationsindataistobaseestimates ondatafrommultipleoutbreaks.
Methods forestimating parameters frommultipleoutbreaks havebeendescribed before, butoften havebeendeveloped for smallerdatasetsandcomputingresourcesthanwhatarenow avail-able.Forexample,thepreviousapproachesofBecker(1979)and
Becker(1991)assumedonlytheobservationofthefinalstateof eachoutbreak wasavailable,usedmoments estimators,didnot formulategeneral a regression model to allowfor variation in parameters betweenoutbreaks,and may beimplemented with penciland paper.Our norovirus outbreak datasetincludesthe fullobservationofalargenumberofoutbreaksandanumberof covariatesthatarelikelytoaffectparameters.Wethushereemploy adifferentmethodthatoperates onthefullobservationof out-breaks,uses maximum-likelihoodestimators,models theeffect ofcovariatesonoutbreakparameterswithinageneralregression framework,and exploitsmoderncomputingpowertofind esti-matesandtheirconfidenceintervals.
Weproposeageneralapproachtofittingdatafrommanysmall outbreaks.Usingsimulateddata,weassessedtheperformanceof theproposedmethodasa functionofthenumberofoutbreaks inthedata,theroundingofmeasurementstoregularintervalsof observation,thenumberofmissingobservations,andthe imputa-tionofmissingobservations.Whenthenumberofoutbreakswas large,wefoundtheperformancetobesatisfactoryfordatasetswith realisticlevelsofallofthesechallengingfeatures.Fittingourmodel todatafromalargenumberofrealnorovirusoutbreaksin health-carefacilities, wefounda distinctincrease in transmissionand initialgrowthratesinlong-term-carefacilitiesrelativetohospitals. Weexaminedthefitofthemodelandfoundthemostnoticeable defecttobelower-than-observedpredictionoftheinitialgrowth oftheoutbreaks.However,thepredicteddynamicsbecamemore accurateovertime suchthatpredictionsnever deviatedwidely fromobservations.
Methods
Wedeveloped themethodsdescribed inthis sectiontofit a modeloftheoutbreakdynamicsofnorovirusbasedondatafroma largesurveyofgastroenteritisinhealth-carefacilitiesintheformer Countyof Avon, England.In this study,theeventsof symptom onsetandrecoverywererecordedonadailybasisforcasesof gas-troenteritisinbothcarestaffandpatientsin15hospitalsand135 long-term-carefacilitiesoverayear-longperiodin2002–2003,and theseeventswereclassifiedintoatotalof271separateoutbreaks (Lopman etal.,2004b).Theseoutbreakswereforthemostpart small;therangeintotalcasesspansfrom2to90casesandthe medianis13cases.
We begin by presenting our estimation methods. With the methoddefined,we thendescribe assumptionsand imputation proceduresusedtoprepareourdataforapplicationofthemethod. Tocompletethemodelspecificationforourapplication,wenext describethevariablesofthedatachosentobepredictorsofhow parametersvaryamongoutbreaks.Finally,weprovidedetailsabout methods of simulation, calculation of confidence intervals, and choiceofsoftware.
Model
Althoughouraimistointroduceageneralapproach,weaimto dosobywayofexample.Thuswedescribeourmethodsintermsof aspecificmodelchoicemadeforthenorovirusdata.However,we
doprovidereferencestorelevantresultsintheregressionliterature toindicatethefullscopeofthisapproach.
The states and transition rules for the model we adopt for individualoutbreaksareasfollows.Thepopulationconsistsofa fixednumberofpeopleofoneormoretypes.Thetermtypehere identifiespeoplebytherulesgoverningtheirmovementbetween differentstateswithrespecttonorovirusinfection.Atthe begin-ningofanoutbreak,thereissomepositivenumberofpeoplein anexposed,orlatent,stateforatleastoneofthetypes.Thisstate representspeoplewhohavebeenexposedtoaninfectionsource andhavealatentinfectionbutarenotcontagious.Theymoveto aninfectivestateafteranincubationperiodoffixedduration.The infectivestaterepresentscontagiouspeople,andforsimplicitywe assumethatallcontagiouspeoplearesymptomatic.Asusceptible
staterepresentspeoplewhoaresusceptibletoinfection.Thuseach susceptibleoftypeimovestothelatentstateatthefirstpointofa PoissonprocesswithrateˇiY(t),whereˇiisthetransmissionrate
fortype-isusceptiblesandY(t)isthenumberofinfectivesattimet. Allinfectivetypeshavethesamelevelofcontagiousnessandhave gamma-distributedsymptomaticperiodswiththesamedispersion parameter,butthemeansymptomaticperiodmaydifferbetween types.Further,typesthatrepresentcarestaffaremovedintoan
infective-but-removedstatewhenthetimetheyhavespentinthe infectivestateexceedsathresholdoffixedduration.Thistransition rulerepresentstheeffectofinfection-controlpoliciesthatprevent stafffromworkingwhencontagious. Attheend oftheir symp-tomaticperiods,infectiveand infective-but-removedpeopleare movedintoarecoveredstate.Therecoveredstaterepresents indi-vidualsthatgainimmunityoverthecourseoftheoutbreak.The outbreakendswhenthenumberofinfectedpeoplereacheszero.
In summary, our outbreak model is the widely studied susceptible-exposed-infective-recovered(SEIR) model with four customizationsforourapplication.First,weallowpeopletovaryin susceptibilityandexpecteddurationofinfectiousness.Second,we donotmakeourtransmissionratedependonthetotalnumberof peopleinthepopulation.Thisdeparturepreventstheneedforthe totalnumberofpeopletobeestimated,anditisappropriateinsmall populationswhenaninfectivepersonmaybeabletoinfectevery susceptiblepersoninthepopulationwithapproximatelythesame probability.Forexample,ForresterandPettitt(2005)didnotfind thatinclusionofthetotalpopulationsizesignificantlyimproved thefit of a modelof methicillin-resistant Staphylococcusaureus
(MRSA)outbreakswithinanintensive-careunit.Third,wedonot assumethatlatentperiodsandinfectiousperiodsareexponentially distributed.Ourapproachismorerealisticbecauseitallowsthe probabilityofapersonleavingalatentorinfectiousstatetodepend onhowlongshehasbeeninthatstate.Fourth,weshuntsomeof theinfectivesintoaninfective-but-removedstatetorepresentthe isolationofcontagiousstafffromthepopulation.
Asindicatedinouroutbreakmodeldescription,therateatwhich asusceptibleacquiresinfectionfromaninfectivemayvaryamong membersofapopulation,andweusethewordtypeinageneral sensetorefertosubsetsofthepopulationthatareassumedtobethe samewithrespecttosuchvariation.Withmultiple-outbreakdata, wefurtherdefinetypesasuniquetoindividualoutbreaks.Inother words,wemakenogeneralassumptionthatpeopleindifferent outbreaksmaybemodeledwiththesameparameters.Weshall laterchooseaparticularlinearmodelthatcontrolstheextentto whichparametersmayvaryamongtypes,butmanyotherchoices forsuchmodelsarepossiblewithinthisframework.Typesthus representthefundamentalunitofvariationinthisframework,and thelikelihoodfunctionnaturallybreaksapartintofactorsforeach type.
Foreachtype,therecovery-timeandtransmission-timepartsof thelikelihoodsfurtherfactorapartintocommondensityfunctions. Thesimplicityofthesefunctionsbeliesaninvolvedconstruction,
availableinKalbfleischandPrentice(2002),astheproductintegral ofthelikelihoodofeventsininfinitesimaltimesteps,wherethe likelihoodofeachtime stepisconditionalonthehistoryofthe modelupuntilthattimestep.Weshallintroducethefulllikelihood byintroducingeachofthesefunctionsinturn.
Fortype-ipeople,therecovery-timepartofthelikelihoodis
lrec(i,)= ki
j=1 1 (1/)(i)1/ I1/−1 i,j exp −Ii,j i, (1)wherekiisthenumberoftype-ipeopleinfectedoverthecourse
ofanoutbreak,Ii,jdenotesthelengthofthesymptomaticperiodof
thejthtype-iinfection,iisthemeanofthesymptomaticperiodof type-iinfections,andisthedispersionparameter,whichwetake tobethesameforalltypesofinfections.Eq.(1)representsthe likeli-hoodfunctionforajointdistributionofgamma-distributedrandom variables.Recallthatperourmodeldefinition,thesymptomatic periodsIi,jaregammadistributed.
Thetransmission-timepartofthelikelihoodfortype-ipeopleis
ltr(ˇi,X(0)i )=X (0) i !/(X (0) i −ki)!exp[−ˇii(Xi(0)−ki)] × ki
j=1ˇiYi,jexp(−ˇihi,j), (2)
whereXi(0)isthenumberofinitialsusceptibles,iisthecumulative exposureofsuchpeopleattheendofanoutbreak(i.e.,thetotalarea underY(t)),Yi,jisthenumberofinfectivespresentwhenthejthsuch
personbecomesinfected,hi,jisthecumulativeexposureofthejth
suchpersonwheninfected.Furtherdiscussionofthis likelihood functionisprovidedintheAppendix.
Inmanycases,convertingthedatatoaminimallysufficientform maybedesirableforthepreservationofpatientprivacy.An exam-pleofsuchaformwouldbetosummarizethedataas
jhi,j, jIi,j,ki,andiforeachtypei.Suchaformwouldstillallowfor
calcula-tionofmaximum-likelihoodestimatesandHessian-based(Wald) confidenceintervals.
Thisminimallysufficientformofthedataalsoillustratesthe robustnessofestimatestosomeimperfectionsofthedata.Thehi,j
andIi,jonlyaffectthelikelihoodthroughthesums
jhi,jand
jIi,j.
Thussomeerrorinourcalculationofhi,jandIi,jshouldnotbiasour
estimatestoomuchaslongastheaverageerrorisclosetozero,and thusgreatcertaintyaboutY(t)isnotnecessary.Forexample,ifwe underestimatedY(t)atsomepointsasaresultofasymptomatic infectivesbeingpresentin realityandwe overestimatedY(t)at someotherpointsasaresultofmisdiagnoses,thoseerrorsmay canceleachothertosomeextent.Also,sometimesthedata con-sistofonlythetimesatwhichpeoplestopbeinginfectious—for example,whenpeopleareisolatedafterbeingidentifiedas infec-tive.Insuchcasestotalexposurecouldstillbeestimatedbyusing akernel-smoothingmethod(LauandYip,2008).
Thelikelihood(2)canbeparameterizeddifferentlyas
ltr(ˇi,ri)=(ri/ˇi)!/(ri/ˇi−ki)!exp[i(ˇiki−ri)] ×
ki
j=1
ˇiYi,jexp(−ˇihi,j), (3)
whereri=ˇiXi(0) istheinitialper-infectiveincidencerate.Inour application,wechoosetoestimateriinsteadofXi(0)becauseriis
easiertointerpretinthecontextofourdata.Forbrevity,werefer toriastheinitialgrowthrate.
Thefulllikelihoodfunctionthatweuseforann-outbreakdata setisthen
l(ˇ,r,,)=
iltr(ˇi,ri)lrec(i,), (4)
whereweuseboldfacetodenotevectorswithelementsequalto theparametersforeachtypei.
Tomakeuseofpreviousresultsfromstatisticaltheoryaswell astouseconventionallanguagewhenwritingaboutourmodel,we shallnextpresentourmodelasageneralizedlinearmodel(GLM). GLMsareabroadclassofstatisticalmodelsthatincludesmany commonlyusedregressionmodels.AGLMconsistsofthree com-ponents:(i)adensityfunctionfromtheexponentialfamily,(ii)a linearmodelthatmapspredictivevariablestoapredictor,and(iii) alinkfunctionthatmapsthepredictortothemeanofthedensity function.
Ourlikelihoodfunctions,(1)and(3),fitthedefinitionof expo-nentialfamilydensities.Thatisnottosaythatthetransmission andrecoverytimesfromasmalloutbreakareindependentrandom variableswiththosedensities.Infact,theymaybehighlycorrelated (Rida,1991).ButthesituationisanalogoustothatofGLMsfor longi-tudinaldata,whereignoringwithin-subjectcorrelationsincreases thevarianceofestimatesbutstillleadstoaccurateestimatesinthe limitofdatafromalargenumberofindependentsubjects(Liang andZeger,1986).
Weobtainalinearmodelbyassociatingeachtypeofpersonin themodelwithasetofpredictivevariables.Intheapplicationto noroviruswedescribehere,suchpredictivevariablesare,for exam-ple,thetypeoffacilityinwhichanoutbreakoccurred(e.g.,hospital orlong-term-carefacility).Wecombinethesepredictivevariables intoadesignmatrixZ,whichhasarowforeachtypeianda col-umnforeachpredictivevariable.Thelinearmappingfrommultiple predictivevariablestoalinearpredictorisachievedbymultiplying thedesignmatrixwithavectorofregressionparametersc.
Aslink function,we chosethenatural log, which tendedto performbetterthanotherpotentiallinkfunctionsinour appli-cation. For example, for transmission-rate estimates ˇi, we let logˇi=Zi,*cˇ,whereZi,* isrowiofthedesign matrixandcˇare
ourregressionparametersforthetransmissionrates.
The conditions for consistency and asymptoticnormality of parameterestimatesforGLMshavebeengivenbyFahrmeir(1985). Foroutbreak data,thevaluesofpredictivevariablesin thedata arelikelytobesomewhatrandomlydetermined,inwhichcasethe conditionsgivenbyDingandChen(2006a,b)apply.
Onestandardconditionforconsistencyisthatthetruevalueof theparameterdoesnotlieontheboundaryofparameterspace. Thatconditionwouldseemtobeviolatedfordatasetsinwhichthe numberofcasesinanoutbreakkiisequaltothenumberof
suscep-tiblesX(0)
i becausethetransmission-timepartofthelikelihood,(2),
isdefinedonlywhenX(0)
i ≥ki.However,giventhatweapproximate
thediscretequantityXi(0)withacontinuousoneforthepurpose offittingthemodel,itseemsreasonabletoconsiderki−0.5asthe
lowerboundofX(0)
i andtosaythat
ltr(ˇi,Xi(0))=Xi(0)!/0!exp(0)× ki
j=1 ˇiYijexp(−ˇihi,j), whenX(0)i isin(ki−0.5,ki].ThenthetruevalueofXi(0)isguaranteed
nottobeontheboundaryandstandardconsistencyresultsapply. IntheAppendix,weprovideanalternativeproofofconsistencyfor ourmodel inthesimplecasethat alloutbreakssharethesame parameters.
Evidencethatthemodelperforms wellin realisticsituations appears in the Results section. We were able to recover from
simulateddatatheparametersforthenon-trivialmodelthatwe fittedinourapplication.
Weestimatedthetransmissionrateandinitialgrowthrateby maximizingthetransmission-timefactorsin(4)giventheoutbreak data,usingtheNewton–RaphsonmethodasimplementedintheAD ModelBuilder(Fournieretal.,2011).TokeeptheNewton–Raphson searchformaximum-likelihoodestimatesinthefeasible parame-terspace,weaddedapenaltytotheloglikelihoodwheneverthe impliedfinalnumberofsusceptiblesx=X(0)
i −kiforanoutbreak
wastooclosetozero,x<
.ThepenaltywasoftheformC(x−)2,whereCisanarbitrarynumericconstantwhichwesettoC=0.01. Likewise,wheneverx<
,wereplacedxby/(2−x/).Throughout thiswork,weused=0.001.Weestimatedthemeaninfectiousperiodandthedispersionof theinfectiousperiodbyusingtheglmfunctioninR(RDevelopment CoreTeam,2010).Bydefault,thedispersionparameterforgamma GLMsisestimatedviathemomentsestimatefor thecoefficient of variation, perhaps because estimates based on the residual deviancearesensitivetosmallvaluesin thedata(Venable and Ripley,2002,p.9).Consistently,wetypicallyfounddefault esti-matestobemoreaccuratethanMLestimateswhenfittingsmall, simulateddatasetsandwefoundthemtobeverysimilartoML esti-mateswhenfittinglargedatasets.Tobeconsistentinourtreatment ofbothsmallandlargedatasets,weusedthedefaultestimateof thedispersionparameterthroughoutthiswork.
Data
The norovirus (NoV) data we analyze here originated in a prospectivesurveillanceprograminhospitalsandlong-term-care facilities in England (Lopman et al., 2004a,b).We analyzedthe dynamicsof75outbreakslaboratory-confirmedtobecausedby NoV in which a total of 1523cases of gastroenteritis occurred amongpatientsandstaff.Weselectedthesedatafromthelarger datasetproducedbythesurveillanceprogramasfollows.
Mostrecordsofinfectionsthatwereattributedinwholeorin parttonorovirusincludedthedatesofboththeonsetofandthe recoveryfromsymptoms.However,inmanyrecordsboth dates weremissing,andinmostoutbreakssomerecordslackedatleast onedate.
Wediscardedallrecordsfromoutbreaksinwhichmorethan55% ofthedatesofrecoveryweremissing.Intheremainingoutbreaks, we replaced missing dates of recoverywith thecorresponding onsetdateplus themediansymptomaticperiod fromcomplete recordsinthatoutbreak.Thesereplacementsweredoneasa prepa-rationfortheestimationofthetransmissionratesandwerenot includedwhenestimatingsymptomaticperiods.
Wediscardedallrecordswheretheonsetdatewasmissing.This practiceisunlikelytointroducealargebiasaslongasarelatively smallnumberofonsetdatesarediscarded.Wemadesurethatthis numberwasrelativelysmallbyusingdataonlyfromoutbreaksin whichthenumberofrecordsthatweremissingonsetdateswas lessthan7%ofthenumberofrecordsthatwerenotmissingonset dates.
Wemadeseveralsimplifyingassumptions.Weassumeda per-sonisinfectiveonlywhensymptomatic, whichissupportedby
Sukhrie et al. (2012). We further assumed that staff move to theinfective-but-removed state after one dayof symptoms, in accordancewithaninfectioncontrolpolicy.Ofcourse,staffwith norovirussymptomsarelikelytostopworkingsoonerthanthatin manycases.Butitseemslikelythatallinfectivestaffhavesome smallprobabilityoftransmittingthediseasetoothersbeforethey leave.Zelneretal.(2013)foundthathouseholdoutbreakdata sup-ported a modelin which infectiousness is highest at theonset of symptoms,which is oftenwhen vomitingoccurs. Aone-day
Table1
Distributionofnorovirusoutbreaksoverthelevelsofthepredictivevariablesinour regressionmodel.
Facility Season Sizeclass #outbreaks
LTCF Fall–winter Small 1
Large 3
Spring–summer Small 4
Large 4
Hospital Fall–winter Small 18
Large 23
Spring–summer Small 11
Large 11
infectiousperiodisasimplewayofmodelingtheeffectofpeople whomay,infact,onlybepresentforshorterperiodswithhigher infectiousness.
Wealsoassumedthatthelatentperiodisfixedat24h,which fallswellwithinthereportedrangeof12–48h(CentersforDisease ControlandPrevention,2011).Tokeepthetransmission-timepart ofthelikelihoodpositive,weassumedasmall,background haz-ardofinfection(10−8thatofaninfective)triggeredillnessincases
whennoinfectiveswerepresent.Wealsoassumedthatthe num-berofinitialinfectivepeoplewasequaltothenumberofpeople reportingsymptomsonthefirstdayoftheoutbreak.Finally,we assumedthatanychangesinstatehappenatthesametimeeach day.
Predictivevariables
Thepredictivevariablesthatdeterminedourdesignmatrices wereasfollows.Thedatawerecollectedoverthecourseofa one-yearperiodbeginninginApril2002,andwecategorizedthedata intotwogroupsbytheperiodinwhichtheybegan:spring–summer referstooutbreaksthatstartedbetweenApril1andOctober1of thestudyyear;fall–winterreferstooutbreaksthatbeganinthe remainderofthestudyyear.Theperiodvariableallowsforvariation intransmissionrateasaresultofseasonalityofNoV.
Asanadditionalpredictivevariable,weincludewhattypeof facilitytheoutbreakoccurredin,hospitalorlong-term-carefacility (LTCF).
Thethirdpredictivevariableweuseissizeclass.We classify unitsin which thenumberof bedsisless thanor equal tothe mediannumberofbedsassmall.We classifytheotherunitsas large.ThisclassificationwasdoneseparatelyforhospitalandLTCF unitsbecauseLTCFunitsareusuallylargerthanhospitalunits.For thehospitals,thesmallunitshave6–22bedsandthelargeunits have24–33beds.FortheLTCFunits,thesmallunitshave 6–34 bedsandthelargeunitshave36–66beds.Thesizeclassvariable allowsthenumberofinitialsusceptiblestodependonthe approx-imatetotalnumberofpeopleineachunit.Thevariablealsoallows populationsizestoaffectcontactrates.
Thefourthpredictivevariableweuseiscasetype,thetwotypes beingpatientandstaff.Casetypeistheonlypredictivevariablethat variedwithinoutbreaks.
We use a facility–size-class–period–case-type combination with a relatively largeamount of data as the reference group. Specifically,thereferencegroupcomprisesoutbreaksthatoccurred amongpatientsinlargecare-unitsofhospitalsthatbeganbetween October2002and April2003.Theestimatedrateparameterfor thereferencegroupservesasthecoefficientoftheinterceptof thelinearmodel.Estimatesforothercoefficientstheninformus ofhowmovingawayfromthereferencegroupchangesrate esti-mates.Table1containsthedistributionofoutbreaksamongthe levelsofthepredictivevariables.
We do not consider interaction terms in this work. So in summary, Wilkinson and Rogers(1973) notation for thelinear
predictors for all our parameters is: 1 +isLTCF +isSmall +isSpringSummer +isStaff.
Confidenceintervals
Toobtainconfidenceintervalsfortheestimates,weperformed a parametric bootstrap. Data were simulated according to our outbreakmodelwiththeestimatedparameters.Eachsimulation produced datafroma setof outbreaksequal in size totheset thatwefit,witheachoutbreakinthesimulationmatchingan out-breakinthefitteddatainterms ofinitialnumber ofinfectives, predictivevariables, fractionof caserecordswithmissing onset andrecoverytimes,andfractionofcaseswithmissingrecovery times.Percentileconfidence intervalsfor regression coefficients wereestimatedfrom10,000simulationreplicates.
Simulation
Weusedsimulationtoinvestigatehowthebiasandvariance ofourestimatesdependonthenumberofoutbreaksthattheyare basedonaswellastheamountofmissinginformation.Wealso usedsimulationtogeneratebootstrapconfidenceintervals.
SimulationsbeganwithsomeinitialnumbersX(0)
i oftype-i
sus-ceptibles of one or more types. To initiate theoutbreak, some additionalsusceptibleswereaddedandmovedintoalatentstate. Allpeopleenteringthelatentstatemovedtotheinfectivestate afterafixedtimeperiod.Type-ipeopleenteringtheinfectivestate movedontotherecoveredstateafteragamma-distributedtime periodwith meani and dispersionparameter .For types of infectivesrepresentingcaresstaff,movementtothe infective-but-removedstateprecededmovementtotherecoveredstateifand whentimespentintheinfectivestateexceededapredetermined threshold. Every time the number of infectives or susceptibles changed,thetimeofapotentialtransmissioneventwascalculated bydrawingfromanexponentialdistributionwithrateY
iˇiXi,whereYisthenumberof(non-removed)infectivesandˇiisthe transmissionrateforsusceptiblesoftypei.Ifthepotential trans-missionwassoonerthanthenextchangeinY,atypeofsusceptible waschosenwithprobabilityproportionaltoˇiXiandmovedinto
thelatentstate.Simulationsstoppedwhenthenumberoflatent, infective,andinfective-but-removedpeoplereachedzero.The out-putofthesimulationswasarecordforeachpersoninfectedgiving transitiontimes.
Oursimulationexperimenthadafullfactorialdesign,withthe numberofoutbreaksnbeing1,10,or100;thefractionof recov-erytimesimputedbeingeitherzeroorapproximatelythehighest suchfractioninourrealdata(0.53);thefractionofrecordsmissing bothonsetandrecoverytimesbeingeitherzeroorapproximately thehighest suchfractioninourrealdata(0.05);andonset and recoverytimesbeingeitherroundedtodaysorexact.Foreach com-binationoffactorlevels,wesimulateddataandattemptedtofitit 10,000times.Thesesimulationshadjustonetype,justoneinitially infectedperson,atransmissionrateˇof0.0037,aninitialgrowth raterof0.2664,alatentperiodof24h,andinfectiousperiodswith ameanof3.32daysandadispersionparameterof0.58,and nothresholdtimebeyondwhichtheinfectivesweremovedintoan infective-but-removedstate.
Thedetailsofthesimulationofmissingdatawereasfollows. First,anoutbreakwassimulatedasusual.Second,thenumberof caserecordstoremovewascalculatedasthelargestintegerless thanthetotalnumberofcaserecordstimestheparametervalue forthefractionofrecordsmissingonsetandrecoverytimes.This numberofrecordswereselectedatrandomandremoved.Then thenumberofcase recordsforwhich toimputerecoverytimes wascalculatedasthelargestintegerlessthanthetotalnumberof
remainingcaserecordstimestheparametervalueforthefractionof recordsimputed.Thisnumberofrecordswereselectedatrandom andgivenimputedrecoverytimes.
Once-dailyobservationoftheoutbreakwassimulatedby round-ingtransitiontimesdowntothenearestwholeday.Outbreakswere startedatrandomtimesinthefirstdaytopreventtherounding fromhavingartificialeffectsonthedatafromsmalloutbreaks.
Ourgradient-basedoptimizationcodeformodelfitting,which workedwellatestimatingtransmissionrateparameterswhenthe numberofoutbreakswaslarge,didnotworkwellwhenthenumber ofoutbreakswassmall.Soweusedspecializedcodetofitthe mod-elsofthesimulationstudy,whichweremoreanalyticallytractable byvirtueofnothavinglinearpredictors.TheAppendixdescribes thebasisforthiscode,whichalwaysfindsthemaximum-likelihood estimateifitexistsandidentifiescasesinwhichnosuchestimate exists.
Software
OuroutbreaksimulationcodemadeuseoftheSimPy(Vignaux etal.,2012)pythonmodule.TheRngStreamsClibrary(L’Ecuyer etal.,2002)allowedforthesimulationstoruninparallel.Weused theADModelBuilder(Fournieretal.,2011)andR2admb(Bolker andSkaug,2011),anR(RDevelopmentCoreTeam,2010)interface forit,tooptimizetheloglikelihood.Wepreparedgraphicswiththe Rpackageggplot2(Wickham,2009).Codecapableofreproducing theresultsisavailablefromtheauthorsonrequest.
Results
Wefirstpresentasimulationstudythatillustratestheaccuracy ofourmethodsonalargenumberofsmalloutbreaksthatwere simulatedfromourmodel.Withthatself-consistencytestpassed, wethenpresentestimatesfromtheapplicationofourmethodto thenorovirusdata.Toshowtheextenttowhichourmodelwas appropriateforthenorovirusdata,wethenpresentdiagnosticsof thefit.
Simulation
Weusedsimulationtoseehowmanyoutbreakdatasetsmay berequiredforestimatestobeapproximatelynormallydistributed aroundthetrueparametervalues.Thesimulationsalsoallowedus togaugetheeffectsoftheimputationandroundingnecessaryfor ourapplication.
Muchpreviousworkhasshownthatestimationwithdatafroma single,smalloutbreakisunreliable(Shao,1999,andrefs.therein). Thusonebenefitofaggregatingdatafrommultipleoutbreaksis thatitallowsfordatafromminoroutbreakstoproducereliable estimates.However,usingdatafromminoroutbreaksdoes repre-sentaworst-casescenariointhesensethateach suchoutbreak contributesonlyasmallamountofinformation.Forthosetwo rea-sons,andtokeepthesimulationstudyatamanageablesize,we restrictedoursimulationstoonesetofparametersthatis guaran-teedtoresultinsmalloutbreaks.Toallowforcomparisonwithour fitstothenorovirusdata,weusedtheparametersestimatedforour baselineregressiongroup.
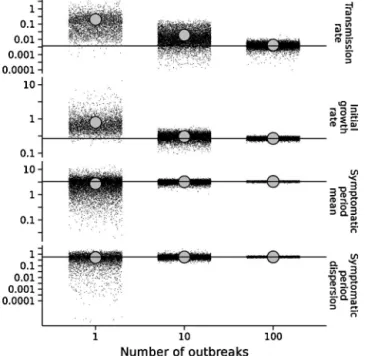
Asexpected,theestimateswerenotverygoodwhenusingdata fromsingleoutbreaks(Fig.1).Inabout49%ofthesesimulations, theinitialinfectivefailedtoinfectanyone,limitingestimationto thelengthofthesymptomaticperiod.Inabout13%ofthese simu-lations,onlyonetransmissionoccurredandthetransmissionand growthrateparameterswereunidentifiable.Inabout21%ofthese outbreaks,theestimateofrwasonthelowerboundof parame-terspace,preventingcalculationofWaldconfidenceintervals.In theremaining17% ofreplicates,thecoverageprobabilityofthe
Table2
Simulationresultsfortransmissionrateˇandinitialgrowthrater.ndenotesthenumberofoutbreakssimulatedforanestimate.Imputedreferstothefractionofrecovery timesdeletedandthenimputedasdescribedintheMethodssection.Missingreferstothefractionofcaserecordsdeletedbeforefittingthedata.Roundedindicateswhether theonsetandrecoverytimeswereroundedtowholedays.Inthesimulations,ˇwassetto0.0037transmissionsperinfective-susceptibledayandtherwassetto0.2664 transmissionsperinfectiveday.
n Imputed Missing Rounded Bias( ˆˇ) Av.s.e.( ˆˇ) ˇcover.(%) Bias(ˆr) Av.s.e.(ˆr) rcover.(%)
1 0.00 0.00 0 0.198 0.131 82 0.52 0.834 87 1 0.196 0.129 82 0.52 0.830 88 0.05 0 0.21 0.130 81 0.55 0.84 87 1 0.206 0.127 83 0.53 0.83 90 0.53 0.00 0 0.251 0.132 80 0.67 0.958 81 1 0.234 0.137 80 0.65 0.966 81 0.05 0 0.231 0.149 83 0.63 0.98 84 1 0.214 0.134 81 0.61 0.96 84 10 0.00 0.00 0 0.0154 0.0456 89 0.0389 0.2882 95 1 0.0155 0.0457 90 0.0378 0.2888 95 0.05 0 0.0160 0.0471 90 0.0370 0.2932 96 1 0.0160 0.0470 89 0.0373 0.2919 96 0.53 0.00 0 0.0158 0.0525 93 0.0602 0.3116 91 1 0.0162 0.0533 93 0.0608 0.3134 91 0.05 0 0.0168 0.0558 92 0.0583 0.319 92 1 0.0170 0.0562 93 0.0587 0.319 92 100 0.00 0.00 0 0.00055 0.00571 94 0.0027 0.07380 95 1 0.00053 0.00569 94 0.0025 0.07370 95 0.05 0 0.00066 0.00614 94 −0.0001 0.07533 95 1 0.00067 0.00617 93 −0.0004 0.07535 95 0.53 0.00 0 −0.00033 0.00668 96 0.0195 0.08036 82 1 −0.00034 0.00653 96 0.0131 0.07844 86 0.05 0 −0.00018 0.00724 97 0.0174 0.08222 85 1 −0.00024 0.00707 97 0.0103 0.08018 87
95%Waldconfidence intervalsrangedfrom80to90%(Table2) andthebiasandaveragestandarderrorforthetransmissionrate wasalmost100timesthetruevalueoftheparameter.The aver-agecorrelationbetweenthetransmissionrateandinitialgrowth rateestimates was94%. Estimates for thesymptomatic period, althoughobtainedforallreplicates,werealsonotaccurate(Fig.1
andTable3).
Rounding,deleting 5% ofcase records,and imputing53% of recoverytimesallgenerallyincreasedtheaveragestandarderror ofestimates,witheffectsinthatorder.Effectsonthebiaswere somewhatmorevariable,buttheasymptoticeffectsofthese pro-cedureson the bias appears tobe zero. However, even in the 100-outbreakscenariotheimputationcausedcoverage probabil-ities forr todeviate byas manyas 13 percentage pointsfrom 95%(Table2),whichrecommendstheuseofconfidenceintervals thataccountfortheimputation,suchastheonesweusedinour application.
Onthewhole,theestimatesweremuchmoreaccurateinthe 10-and100-outbreakscenarios(Fig.1,Tables2and3).Theywerealso morerobust.Estimatesforrwereonthelowerbound5%ofthetime inthe10-outbreakscenarioandneveronthelowerboundinthe
100-outbreakscenario.Thelikelihoodwasdivergentabout7–10% ofthetimeinthe10-outbreakscenarioversus0.1–2%ofthetime inthe100-outbreakscenario.Theaveragecorrelationbetweenthe estimatedtransmissionrateandgrowthratewasabout0.83and 0.74forreplicatesinthe10-and100-outbreakscenarios, respec-tively.
Insum,themethodworkswellwithasufficientlylargedata set.Moderateamountsofimputation,missingdata,androunding willhavemostlymodesteffectsonestimates.Simulation,aspart ofaparametricbootstrapprocedure,canprovideanindicationof theaccuracyofestimatesforaparticulardatasetofinterest.We demonstratesuchaprocedureinourapplication.
Estimatesfornorovirusinhealth-caresettings
We fitted our generalized linear model to data from a largeprospectivestudyofgastroenteritisinhealth-caresettings (Lopmanetal.,2004b).Inthisone-yearstudy,patientsandthecare staffassignedtoanyofabout4500bedsinhealth-carefacilities intheformerCountyofAvon,England,wereunderactive surveil-lance.Trainedstaffmembersrecordedthedatesoverwhichpeople
Table3
Simulationresultsforsymptomaticperiodmeananddispersionparameter.ndenotesthenumberofoutbreakssimulatedforanestimate.Missingreferstothefraction ofcaserecordsdeletedbeforefittingthedata.Roundedindicateswhethertheonsetandrecoverytimeswereroundedtowholedays.Cover.referstothecoverageprobability ofWaldconfidenceintervals.Lowerˆandupperˆrefertotheboundsofabootstrapconfidenceinterval.Inthesimulations,wassetto3.32daysandthewassetto0.58.
n Missing Rounded Bias(ˆ) Av.s.e.(ˆ) Cover.(%) Bias(ˆ) Lowerˆ Upperˆ
1 0.00 0 −0.60 3.76 83 −0.067 0.01 1.46 1 −0.59 3.75 84 −0.037 0.00 2.00 0.53 0 −0.65 4.13 80 −0.096 0.01 1.47 1 −0.59 4.26 80 −0.027 0.00 2.00 10 0.00 0 −0.104 1.511 91 −0.005 0.31 0.98 1 −0.106 1.534 91 0.008 0.32 0.98 0.53 0 −0.108 2.123 90 −0.016 0.23 1.12 1 −0.106 2.161 90 0.002 0.24 1.15 100 0.00 0 −0.010 0.4703 94 −0.0006 0.49 0.68 1 −0.010 0.4772 95 0.0157 0.50 0.70 0.53 0 −0.007 0.6853 94 −0.0012 0.46 0.73 1 −0.010 0.6928 94 0.0132 0.47 0.76
Fig.1.Estimatesversusnumberofoutbreaks.Therownamesindicateparameters. Eachsmallblackpointrepresentsanestimate.Thelargergraypointsrepresentthe meansoftheestimates.Thehorizontallinesrepresentthevaluesoftheparameters usedtosimulatethedata.
weresymptomaticandtooksamplesthatallowedforlaboratory confirmationofthecausesofoutbreaks.Fig.2showsthecase his-toriesthatwereusedtofitourmodel.
Thepredictorsinourmodelwerefacilitytype,whichindicated whetheranoutbreaktookplaceinalong-term-carefacility(LTCF) orahospital;sizeclass,whichindicatedthenumberofpatientsand staffintheunit;period,whichindicatedthetimeofthestudyyear whentheoutbreakbegan;andcasetype,whichindicatedwhether acasewasapatientoramemberofthecarestaff.SeetheMethods
sectionformoredetails.
Forourbaselineregressiongroupofpatientsinlargehospitalsin thefallandwinter,theestimate(95%bootstrapconfidenceinterval) ofthetransmissionratewas0.0037(0.0026–0.0052)transmissions perinfective-susceptibleday,thatoftheinitialgrowthratewas 0.27(0.23–0.30)transmissionsperinfectiveday,thatofthe symp-tomaticperiodwas3.35(3.09–3.57)days,andthatofthedispersion parameter for the symptomatic period was0.57 (0.54–0.65). Thoseparameterestimateshavebeentransformedfromthelog scaleforeaseofinterpretation.Thefullsetofuntransformed esti-matesisgiveninTable4.
The basic reproduction number R0 is the expected
num-ber of new infections that a single infection will cause at the beginning of an outbreak. Table 5 contains values of R0
calculated from the regression coefficients using the formula
R0=(rpatient+rstaff)patient.
0 0 0 10 0 10 −10 0 10 −10 0 10 20 0 10 20 0 10 20 30 0 10 20 30 40 50 60 70 0 0 20 20 2 0 2 0 2 4 0 2 4 0 2 4 6 8 0 2 4 6 8 10 Time (weeks) Case ID n umber
Fig.2. Casehistories.Eachhorizontalbarrepresentsthehistoryofaperson.The symptomaticperiodisfilledin.CaseIDswereassignedbysortingthecasesfirstby onsettime,thenbyrecoverytime,andthenbyarandomordering.Initialinfectives weregivennegativecaseIDs.Thepanelsarearrangedsothattheoutbreaksize increasesfromtoptobottomandtheoutbreaklengthincreasesfromlefttoright. Casehistoriesfromlong-term-carefacilities(LTCFs)areinlightgray.Someofthe timesofrecoveryfromsymptomswereimputedasdescribedintheMethodssection.
Fig. 3 shows estimates for the effect on model parameters ofan outbreakbeingdifferent fromtheoutbreaksin the refer-encegroupwithrespecttooneof ourpredictivevariables.The largesteffectsaretheincreaseintransmissionandgrowthsrates in long-term-care facilities (LTCFs) and the reduction in these ratesinstaff.Itappearsthattransmissionratesarehigherinthe smallerunits.Symptomaticperiodswereestimatedtobeabout 25%shorterforoutbreaksinLTCFsand20%shorterforcasesamong staff.
Diagnostics
Asa general test of modelfit for the transmissionrate and growthratelikelihoods,wecalculatedthepercentileofthelog like-lihoodofthefittotherealdatainthedistributionofloglikelihoods generatedbybootstrapping.Outof10,000bootstrapreplicates,our optimizationcodefoundestimatesin9809cases.Theloglikelihood ofthefittotherealdatawasinthe25thpercentileofthelog like-lihoodsfromtheseestimates.Thus,thelog-likelihoodofourfitto therealdataisnotextreme,consistentwithagoodmodelfit.
Ouruseofthemomentsestimatorforthedispersion param-eterin(1)precludedasimilarassessmentofmodelfitforthe
Table4
Regressioncoefficients(95%bootstrapconfidenceinterval)forthenaturallogoftheoutbreak-modelparameters.
Transmissionrate Initialgrowthrate Symptomaticperiod
(Intercept) −5.60 (−5.96,−5.25) −1.31 (−1.45,−1.20) 1.21 (1.13,1.27) LTCF 1.98 (1.61,2.35) 1.06 (0.87,1.20) −0.28 (−0.37,−0.18) Small 0.45 (0.34,0.70) −0.03 (−0.15,0.11) 0.08 (0.00,0.16) Spring–summer −0.06 (−0.29,0.14) 0.04 (−0.09,0.17) 0.00 (−0.08,0.09) Staff −1.03 (−1.43,−0.74) −0.87 (−1.00,0.73) −0.23 (−0.31,−0.14) Dispersion 0.57 (0.54,0.65) Num.obs. 1523 1412 Loglikelihood -1625 -2896
Table5
Predicted R0 values (95% bootstrap confidence interval) based on regression coefficients.
Facility Season Sizeclass R0
LTCF Fall–winter Small 2.78 (2.55,3.23)
Large 2.62 (2.40,2.98) Spring–summer Small 2.90 (2.69,3.29) Large 2.74 (2.53,3.04) Hospital Fall–winter Small 1.27 (1.22,1.43) Large 1.20 (1.14,1.33) Spring–summer Small 1.33 (1.26,1.53) Large 1.25 (1.19,1.41)
symptomaticperiods.However,inspectionofthedefaultdiagnostic plotsforglmobjectsinRdidnotindicateanyproblems.
Theestimatedvalueofthelogoftheinitialnumbersof suscep-tibles(calculatedaslog ˆX(0)
i =log( ˆri/ˇˆi))providedameansfora
sanitycheckofourestimates.AsdescribedintheMethodssection, oursize-classpredictivevariablewasdeterminedfromthe num-berofbedsorstaffassignedtoaunit.Wechosenottodirectlyuse thenumbersofbedsorstaffastheinitialnumberofsusceptiblesin ourmodelbecausetheyarelikelynoisymeasurementsofthetrue value.However,itisworthnoticinginFig.4thatourestimates areonapproximatelythesamescaleasthenumbersofbedsand staff.Furthermore,ourestimatesreplicatetwoqualitative differ-encesseeninthebed-numberandstaff-sizedata.First,unitsinthe smallsizeclassdoindeedhavesmallerlog ˆX(0)
i thandounitsin
thelargesizeclass.Second,log ˆX(0)
i forstaffarelargerthanthose
forpatients.Ontheotherhand,log ˆX(0)
i islargerforhospitalsthan
forLTCFswhileLTCFshavemorebedsandlargerstaffs.This differ-encemightbereducedbyincreasingthecomplexityofourmodel, butsuchanexerciseinmodelselectionisbeyondthescopeofthis paper.
LTCF Small summerSpring− Staff
0.25 0.5 1 2 4 8 16 0.25 0.5 1 2 4 8 16 0.25 0.5 1 2 4 8 16 Tr ansmission rate Initial gr o wth rate Symptomatic pe riod 0 2000 0 2000 0 2000 0 2000 Count Multiplicati v e ef fect
Fig.3.Regressioneffectestimates.Thecolumnnamesindicatelevelsofthe cate-goricalpredictivevariablesbywhichoutbreaksdifferedfromthereferencegroup. Thereferencegroupwasmadeupofallcasesofnorovirusamongpatientsinlarge hospitalsinthefallandwinter.Therownamesindicateparameters.Thehistograms displaythedistributionsofestimatesobtainedinaparametricbootstrap.Gray rec-tanglesindicatea95%confidenceintervalbasedonthepercentilesofbootstrap estimates.ThewhitehorizontallineinsideeachrectangleindicatestheMLestimate. LTCFstandsforlong-term-carefacility.
Small Large 10 100 10 100 LTCF Hospita l
Patient Staff Patient Staff Case type
Initial susceptib
les
Fig.4. Estimatedinitialsusceptiblesandmeasuresofcare-unitsize.Thecolumn names,rownames,andx-axismarksindicatethelevelsofthepredictivevariables thatdeterminedtheestimateofinitialsusceptiblesrepresentedbythegraybars. Themiddle95%ofestimatesfromtheparametricbootstrapwereusedtodetermine theupperandlowerboundsofthegraybars.Eachpointcorrespondstoanobserved outbreakofNoVandindicateseitherthenumberofbedsforpatientsinthecare unitorthenumberofstaffassignedtoaunit.LTCFstandsforlong-term-carefacility. Estimatesofinitialsusceptiblesdidnotvarymuchbytheperiodpredictivevariable, soestimatesanddatafrombothperiodsaregroupedtogetherinthisplot.
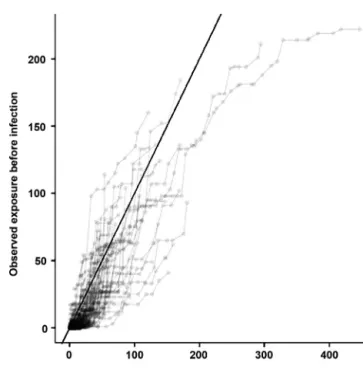
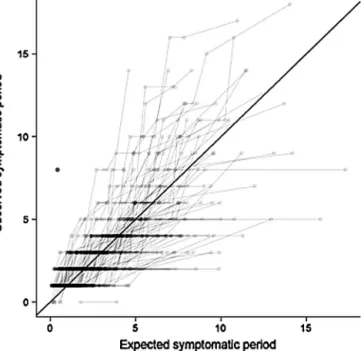
Tographicallyevaluatethefitofourmodel,weplottedobserved values of cumulative exposure before infection, symptomatic periodduration,andcumulativeincidenceagainstthoseexpected fromthefittedmodel(Figs.5,6,and7).
Fig.5.Quantile–quantileplotsofthecumulativeexposureofpeopleatthetime ofinfection.Thesemi-transparentlinesconnectdatapointsfromthesame out-break.Theopaquediagonallineisareferencelinethatindicateswherepointsfrom perfectlymatchingdistributionswouldfall.
Fig.6.Quantile–quantileplotsofthesymptomaticperiods.Thesemi-transparent linesconnectdatapointsfromthesameoutbreak.Theopaquediagonallineisa referencelinethatindicateswherepointsfromperfectlymatchingdistributions wouldfall.
FromFig.5,itseemsthatthemodelfitsbestforintermediate valuesofcumulativeexposureintherangeof50–200 infective-persondays.Inthisrange,thelinesconnectingdatapointsfrom individualoutbreaksareroughlyparalleltoandcenteredaboutthe referenceline,whichshowsthatinthisrangetheobserved distri-butionsaresimilarinshapetotheexpecteddistributionsbutwith probabilitydensitiesshiftedtotheleftorright.Forlowvaluesof cumulativeexposure,theobserveddistributionshavemuchhigher densitiesthanthefittedmodelwouldpredict.Thisdisagreement
Fig.7.Observedversusexpectedcumulativecasecounts.Thesemi-transparent linesconnectdatapointsfromthesameoutbreak.Theopaquediagonallineisa referencelinethatindicateswherepointsfromperfectlymatchingfunctionswould fall.
isvisibleasthehighdensityofpointsbelowthereferenceline. Forhighvaluesofcumulativeexposure,theobserveddistributions seemtobetruncatedataround220infective-persondays,whereas thefittedmodelassumesanexponentialdistributionthatpredicts muchlargervalues.
InFig.6,observedsymptomaticperiodsaregenerallycloseto predictedsymptomaticperiods.However,thereseemstobea ten-dencyforsymptomaticperiodsinsomeoutbreakstobelessvaried thanthemodelpredicts.Thistendencyisvisibleaslinesthatstart abovethereferencelineontheleftsideoftheplotandthenbend totherightquicklyenoughtobeunderthereferencelinebythe timetheyend.
InFig.7,cumulativeincidenceishigherthanexpectedearlyin outbreaksasaconsequenceofthelarger-than-predictednumberof caseswithsmallexposure(Fig.5).Thedifferencebetweenobserved andexpectedcumulativeincidencetendstobecomelesspositive orslightlynegativebytheendofoutbreaks,andtheabsolute dif-ferenceisusuallylessthan10throughout.
Discussion
We haveshown thatreliable estimationof parametersfrom manysmalloutbreaksispossibleusingageneralizedlinearmodel basedonstandardstochasticepidemicmodels.Asimulationstudy demonstratedthatweareabletoaccuratelyestimateparameters whenthedatastemfromsmalloutbreaksevenwhensomedataare missingandabouthalfofrecoverytimesareimputed.Fittingthe modeltoalargenumberofoutbreaksofnorovirus,wefoundthat facilitytype,facilitysize,andcasetypeseemtohavesignificant effectsonoutbreakdynamics.
Höhle(2009)describedahighlygeneralformulationof stochas-ticepidemicmodelswithinaregressionframework,andourmodel isalmostaspecialcaseofthatgeneralformulation.However,that formulationdidnotinclude regressionsforthemeaninfectious periodortheinitialgrowthrate,whichweincludehere.Modeling detailsaside,ourworkherediffersfromHöhle(2009)andrelated regressionapproaches (Forresterand Pettitt,2005; Voirinetal., 2011;Meyeretal.,2012)indemonstratingtheparticularvalueof amultiple-outbreakregressionwhenfittingdatafromsmall out-breaks,whicharequitecommoninhealth-caresettings.
Themost striking resultof ourregression estimates(Fig.3) aretheapproximately7-foldincreaseintransmissionratesand 3-foldincreaseininitialgrowthratesinthelong-term-carefacilities (LTCFs)relativetohospitals.Fig.2showsthatLTCFoutbreaksdo indeedincludemanyofthelargerandfastergrowingoutbreaksin thedataset.
ThehighertransmissionratesforoccupantsofLTCFsmaybe aconsequenceofoccupantshavingmoreopportunitytosocialize inlargegroups.Alternatively,wemaybeseeingtheeffectsofour assumptionsofaclosedpopulationandhomogeneousmixingbeing violated.Hospitalshavemorerapidturnoverofpatients,andthe exposureofpeoplewhoarrivedinthecareunitaftertheoutbreak startedwillbeoverestimatedinourmodel.OccupantsofLTCFsmay varymoreincontactratesbyvirtueofbehavioraldifferences,and suchvariationinexposurecouldleadtoahigherinitialgrowthrate (Becker,1989,pp.133–138).
Our model is agnostic about the particular pathways of transmission in the outbreaks, and thus the estimates repre-sent rates of transmission by all routes including transmission byperson-to-person, environmentally-mediated, and foodborne routes.Outbreakinvestigationsoftenassociatefoodborne trans-missionwithanabruptincreaseininfections(e.g.,Isakbaevaetal., 2005),andthusdifferenceinthefrequencyofthismodeof trans-missionbetweensettingscouldcausedifferencesinourestimates. Thatbeingsaid,wedidnotincludeinfectiontermscorresponding
tofoodbornetransmissionbecausemostreportednorovirus out-breaksareattributedprimarilytoperson-to-persontransmission (Yenetal.,2011),andwebelievedthatalltheoutbreakswe ana-lyzedinvolvedprimarilyacombinationofperson-to-personand environmentally-mediatedtransmission.Incrowdedsettingssuch ashealthcare-facilities,itisoftendifficulttodeterminethe rela-tivefrequencyoftheseroutesoftransmission(Kuusietal.,2002; Isakbaevaetal.,2005;CentersforDiseaseControlandPrevention, 2008).
Althoughouraimwasnottofitthedatatoahighlyrealistic model,wedidtakeasignificantsteptowardsrealismbymodeling variationintheinitialgrowthrateoftheoutbreak.The transmis-sionrateinourmodeldetermineshowtheexpectednumberof newcasesincreasesastheproductofthenumbersofinfectives andsusceptiblesincreases.Thusestimatesofthetransmissionrate willbehighlysensitivetothoseoftheinitialnumberof suscepti-bles,whichdeterminesthenumberofsusceptiblesthroughoutthe outbreak.Butinthecaseofnorovirus,thenumberofsusceptibles isdifficulttoknowasthereisnoserologicalcorrelateof protec-tion.Recentworkonjointestimationof transmissionrates and theinitialnumberofsusceptibleswithdatafromasingleoutbreak (Hayakawaetal.,2003;Hugginsetal.,2004;LauandYip,2008; Kypraios,2009)hasshownthatestimatesoftheinitialnumberof susceptiblestendtobelowwhendatasetsaresmall.Aswehave seeninoursimulationresults(Fig.1),thisbiasdecreasesasthe numberofoutbreaksinthedatasetincreases,evenifalloutbreaks aresmall.
Theestimates for NoVtransmission dynamicswe calculated complementresultsfrompreviousepidemiologicalanalysesofNoV inhealth-caresettings.Previousanalysesofourdataset(Lopman etal.,2004a,b)hadexaminedhowriskofNoVinfectionor particu-larsymptomsofNoVinfectionvariedwithageandotherpersonal characteristics.Thecurrentanalysisaddstotheseresultsby quan-tifyingeffects that couldbeusedtopredictnorovirus outbreak dynamics.
Analysisofa2003–2006studyofNoVoutbreaksin long-term-carefacilities(LTCFs)inOregon(Rosenthaletal.,2011)suggested thatlargerfacilitiesmayhaveahigherriskofexperiencing out-breaks. Our result that transmission rates are lower in larger facilitiessuggeststhatanyincreasedriskthatlargerfacilitieshave isnotcausedbyincreasedtransmissionrates.However,ourresult mustbeinterpretedwithcautionbecausewehavenotbeenable toaccountformanyfactorsthatmayaffectcontactrates,suchas numberofbedsperroom.Whetherthecauseofthelower trans-missionratesisreallyfacilitysizeoracorrelationoffacilitysize withsomeomittedvariableisunclear.
Afewpreviousstudieshaveestimatedindividual-level param-etersfor NoV thatare comparabletoourestimates. Usingdata froma NoV outbreak in a primary schooland nursery in Der-byshire, England, O’Neill and Marks(2005) estimated that the probability of a susceptible person avoiding infection from an infectivepersonintheschoolforadaywas0.998.Usingthe for-mulaPr(avoidance)=exp(−ˇ×1susceptible×1infective×1day), ourestimatesyieldPr(avoidance)thatrangesfromabout0.959for patientsinsmallLTCFsto0.999forstaffinlargehospitals.
Heijneetal.(2009)estimatedthebasicreproductionnumberof NoVinboy-scoutcampstobeabout14and7,respectively,under twodifferentsets ofassumptions. Our highestR0 was
approxi-matelyequalto3(Table5).TherelativelownessofourR0smight
reflectcontactratesbeinghigherinthecampsetting,anditmay alsoreflect theeffectof betterhygiene in thehealth-care sett-ings. Heijne etal. (2009)estimatedthat theimplementationof an enhanced hygiene protocol drove the reproduction number in the camps down toabout 2 and 1, values on par with our ownestimates.Likewise,Heijneetal.(2012)estimated reproduc-tionnumbersforanoutbreakwithinthewardsofapsychiatric
institutiontobeclosetooneandthusclosetoourhospitalR0s.
Actually,thoseestimatestendtobelowerthanours,buttheyare reproductionnumbersaveragedoverthefullcourseofanoutbreak andthusshouldexpectedtobelowerduetothedepletionof sus-ceptiblesovertime.Ourestimatesmaybemoregeneralizablethan theboththepsychiatric-wardandboy-scoutestimatesbecauseour datasetwaslargerandincludeddatafrombothlargeandsmall outbreaks.
Zelneretal.(2010)useddatafromaStockholmoutbreakto esti-matethattheaverageinfectiousperiodwas1.2days.Thesettingof theseoutbreakswashouseholdsthatincludedchildrenindaycare centers.Thus,theinfectiousperiodmayhavebeenshorterinthese outbreaksbecausemanyoftheinfectiveswerelikelyhealthy peo-plebetweentheagesof5and70,whereaspeoplebelowtheageof5 and,toanevengreaterdegree,peopleovertheageof70were over-representedinourdata(Lopmanetal.,2004b).Inourdata,people intheseextremeagegroupshadaveragesymptomaticperiodsof 3days(Lopmanetal.,2004b).Moreover,theStockholmestimate isbasedonimputedinfectiousperiodsratherthansymptomatic periods,whichwerenotreported.Asaresult,iftheassumedinitial numberofsusceptiblesfortheStockholmanalysiswastoohigh, theinfectiousperiodwouldhavebeenunderestimated.
Althoughourestimatesofthesymptomaticperiodmaybe rela-tivelylong,itispossiblethatsomeofthepatientsweredischarged intothecommunitybeforetheybecameasymptomatic.Thus,for patients,ourestimatesmostaccuratelydescribetheperiodofbeing symptomaticwhilesimultaneouslybeinginahealth-carefacility.
ThedailytransmissionratesestimatedfromtheStockholmdata, 0.14transmissionsperinfective-susceptibleday,aremorethan 3-foldhigherthanourhighestestimatedtransmissionrate,which was0.04transmissionsperinfective-susceptibledayforpatients insmallLTCFs.Thejointestimationapproach weusedcouldbe appliedtotheStockholmdatatodeterminewhetherthehigher transmission-rateestimatesmayhaveresultedfrom underestima-tionofhouseholdsizes.
However,thetransmissionratesmaywellbedifferentbecause ofdifferencesinhygienemeasures,contactrates,ordifferent lev-elsofbaselineimmunity.Nursesforexamplemaybefrequently exposed andthereforehighlyimmune. Additionally,time-series analysisofoutbreakincidence(Lopmanetal.,2009)hassuggested thattransmissionratesgenerallymayvarywithhost,weather,and virusfactors.Takentogether,thesedifferencesmayexplain the largediscrepancyinestimatedtransmissionrates.Thecompilation andanalysisofalarge,multiple-outbreakdatasetthat includes predictivevariablesindicativeofhygiene,contactrates,and base-lineimmunitycouldshedlightonwhichoftheseelementshasthe greatesteffectontransmissionrates.
Inourapplication,wemadethesimplifyingassumptionthatthe latentperiodwasfixedatitsmean,whichallowedustodirectly calculateinfectiontimesfromthereportedonset ofsymptoms. Theinfectiontimesdeterminethecumulativeexposureshi,jin(3).
Becausethecumulativeexposureisanon-linearfunctionoftime andthemeanofanon-linearfunctionofarandomvariabledoes notalwaysequalthefunctionevaluatedattherandomvariable’s mean,theextenttowhich latentperiodsvariedinrealitylikely introducedbiasintoourcalculatedcumulativeexposuresandthe estimatesbasedonthem.Thebiascouldbeeitherpositiveor nega-tivedependingonwhethercumulativeexposureusuallyincreases morequicklybeforeoraftertheassumedtransmissiontimes.
Another simplifying assumption we made was that people wereonlyinfectiouswhentheyweresymptomatic.Insupportof this assumption,Sukhrieet al.(2012) haveshown that asymp-tomaticpeoplearemuchlessinfectiousthansymptomaticpeople in health-care settings. To quantify the effect of this and the fixed latent period assumption, we could make the infectious period a latent variablethat we integrate over toevaluate the
likelihood,asinHohleetal.(2005).Alternatively,wecoulduse a kernel-smoothing method to estimate unobserved latent or infectiousperiods,asinLauandYip(2008).However,even with-outsuchcalculationsit isclearthat if,in reality,theinfectious periodextendsbeyondthesymptomaticperiod,ourestimatesof transmissionrateshavebeeninflatedbyourunderestimationof exposure.
Fromthenumerical resultsdisplayed inTables 2 and 3, we seethat highly reliableestimation depends on collectionof an extensivedataset.TheCenters forDiseaseControland Preven-tion(CDC)hasrecentlyestablishedaNationalOutbreakReporting Systemthat,withthecontributionsofstatehealthdepartments, will provide more comprehensive surveillance for all U.S. gas-troenteritisoutbreaks(CentersforDiseaseControlandPrevention, 2011).However,thedatawehaveanalyzedhereismoredetailed thanwhatisroutinelycollectedinoutbreakinvestigations.More detailedoutbreakinvestigationsareneededtocollectsuchdata and further characterize modes of transmission. The collection ofNoV genomic datamayalsobe ofgreat value (Teuniset al., 2013).
Regardingthegeneralsubjectofoutbreaksofhospital-acquired infectionsinindividualhospitals,wesuspectthatinsome hospi-talsalargepartofthenecessarydatacollectionisalreadytaking placeasapartofexistingsurveillanceprograms.A2008–2009 sur-veyestimatedthatapproximatelyonethirdofCaliforniahospitals used automated surveillance technology to monitor hospital-acquired infections (Halpin et al., 2011). Similarly, a survey of hospitals in the Northeastern United States found that one thirdofhospitalshadanelectronicsurveillancesysteminplace (Grotaetal.,2010).Suchsystemswereusedtodetectoutbreaks, analyze data, and generate reports of hospital-acquired infec-tions(Grota et al., 2010). As several states mandate reporting infectionrates of MRSA and many more require someform of reportingof hospital-acquiredinfections (CommitteetoReduce Infection Deaths,2011), many hospitals may have data onthe totalnumberofcasesinmanyoutbreaksforseveralpathogensof concern.
Our analysis,based ona robustdata set,demonstrates that parameterestimates are substantially less biasedwhen a large numberofoutbreaksarefitted.Wesubmitthat,fornorovirusand manyotherpathogens,thereareseveralusesforaccurateestimates oftransmissionrates,initialgrowthrates,andinfectiousperiods. Policy-makerscanusesuchestimatestocomparetheefficacyof differentcontrol strategies suchas hygiene protocols, isolation measures,prophylactictreatments,andvaccinationpolicies.Those monitoringthesmalloutbreaksofzoonoticdiseasesmaybeable tousesuchestimatestoidentifyvariablesthatmaketransmission morelikely.
Roleofthefundingsource
ThisworkwassupportedbyNSFGrant EF-0742373and NIH GrantR01GM088344.E.B.O.wasalsosupportedbyBEACONGrant 61-2075UT.K.M.P. wasalso supportedbytheRAPIDD program of the Scienceand Technology Directorate,U.S. Department of HomelandSecurity,andtheFogartyInternationalCenter,NIH.Our fundingsourceshadnoroleinthisstudy’sdesign;inthecollection, analysis,and interpretationoftheanalyzeddata;inthewriting ofthispaper;orinthedecisiontosubmitthispaperfor publica-tion.
Acknowledgments
TheTexasAdvancedComputingCenteratUTprovided comput-ingresources.
AppendixA. Supplementarydata
Supplementary data associated with this article can be found,intheonlineversion,athttp://dx.doi.org/10.1016/j.epidem. 2013.12.002.
References
Anderson,R.M.,May,R.M.,1992.InfectiousDiseasesofHumans:Dynamicsand
Control.OxfordUniversityPress,USA.
Becker,N.,1979.Anestimationprocedureforhouseholddiseasedata.Biometrika
66,271–277.
Becker,N.G.,1989.AnalysisofInfectiousDiseaseData.ChapmanandHall/CRC.
Becker,N.G.,1991.Analysisofinfectiousdiseasedatafromasampleofhouseholds.
LectureNotes-MonographSeries18,27–40.
Bolker,B.,Skaug,H.,2011.R2admb:ADMBtoRinterfacefunctions.Rpackageversion 0.7.5.1.
Cannon,J.L.,Lindesmith,L.C.,Donaldson,E.F.,Saxe,L.,Baric,R.S.,Vinjé,J.,2009.Herd
immunitytoGII.4norovirusesissupportedbyoutbreakpatientsera.Journalof
Virology83,5363–5374.
CentersforDiseaseControlandPrevention,2008.Norovirusoutbreakinan
elemen-taryschool-DistrictofColumbia,February2007.MMWR56,1340–1343.
CentersforDiseaseControlandPrevention,2011.Updatednorovirusoutbreak
man-agementanddiseasepreventionguidelines.MMWR60,1–18.
Committee to Reduce Infection Deaths, 2011. State laws on reporting HAIs.
http://www.hospitalinfection.org/legislation.shtml
Ding,J.L.,Chen,X.R.,2006a.Asymptoticpropertiesofthemaximumlikelihood
esti-mateingeneralizedlinearmodelswithstochasticregressors.ActaMathematica
Sinica,EnglishSeries22,1679–1686.
Ding,J.L.,Chen,X.R.,2006b.Large-sampletheoryforgeneralizedlinearmodelswith
non-naturallinkandrandomvariates.ActaMathematicaeApplicataeSinica,
EnglishSeries22,115–126.
Evans,M.R.,Meldrum,R.,Lane,W.,Gardner,D.,Ribeiro,C.D.,Gallimore,C.I., West-moreland,D.,2002.Anoutbreakofviralgastroenteritisfollowingenvironmental
contaminationataconcerthall.EpidemiologyandInfection129,355–360.
Fahrmeir,L.,1985.Consistencyandasymptoticnormalityofthemaximum
like-lihoodestimatoringeneralizedlinear models.TheAnnalsofStatistics13,
342–368.
Forrester,M.,Pettitt,A.N.,2005.Useofstochasticepidemicmodelingto
quan-tifytransmissionratesofcolonizationwithMethicillin-ResistantStaphylococcus
aureusinanintensivecareunit.InfectionControlandHospitalEpidemiology26, 598–606.
Fournier,D.A.,Skaug,H.J.,Ancheta,J.,Ianelli,J.,Magnusson,A.,Maunder,M.N., Nielsen,A.,Sibert,J.,2011.ADModelBuilder:usingautomaticdifferentiationfor
statisticalinferenceofhighlyparameterizedcomplexnonlinearmodels.
Opti-mizationMethodsandSoftware27,233–249.
Glass,R.I.,Parashar,U.D.,Estes,M.K.,2009.Norovirusgastroenteritis.NewEngland
JournalofMedicine361,1776–1785.
Grota,P.G.,Stone,P.W.,Jordan,S.,Pogorzelska,M.,Larson,E.,2010.Electronic
surveillancesystemsininfectionprevention:organizationalsupport,program
characteristics,andusersatisfaction.AmericanJournalofInfectionControl38,
509–514.
Halloran,M.E.,Longini,I.M.,Struchiner,C.J.,2009.DesignandAnalysisofVaccine
Studies.Springer.
Halpin,H.,Shortell,S.M.,Milstein,A.,Vanneman,M.,2011.Hospitaladoptionof
auto-matedsurveillancetechnologyandtheimplementationofinfectionprevention
andcontrolprograms.AmericanJournalofInfectionControl39,270–276.
Hayakawa,Y.,O’Neill,P.D.,Upton,D.,Yip,P.S.,2003.Bayesianinferencefora
stochas-ticepidemicmodelwithuncertainnumbersofsusceptiblesofseveraltypes.
AustralianandNewZealandJournalofStatistics45,491–502.
Heijne,J.C.M.,Rondy,M.,Verhoef,L.,Wallinga,J.,Kretzschmar,M.,Low,N., Koop-mans,M.,Teunis,P.F.M.,2012.Quantifyingtransmissionofnorovirusduringan
outbreak.Epidemiology23,277–284.
Heijne,J.C.M.,Teunis,P.,Morroy,G.,Wijkmans,C.,Oostveen,S.,Duizer,E., Kretz-schmar,M.,Wallinga, J.,2009.Enhancedhygiene measuresandnorovirus
transmissionduringanoutbreak.EmergingInfectiousDiseases15,24–30.
Höhle,M.,2009.Additive-multiplicativeregressionmodelsforspatio-temporal
epi-demics.BiometricalJournal51,961–978.
Hohle,M.,Jorgensen,E.,O’Neill,P.D.,2005.Inferenceindiseasetransmission
exper-imentsbyusingstochasticepidemicmodels.JournaloftheRoyalStatistical
Society:SeriesC(AppliedStatistics)54,349–366.
Huggins,R.M.,Yip,P.S.F.,Lau,E.H.Y.,2004.Anoteontheestimationoftheinitial
numberofsusceptibleindividualsinthegeneralepidemicmodel.Statistics&
ProbabilityLetters67,321–330.
Isakbaeva,E.T.,Widdowson,M.A.,Beard,R.S.,Bulens,S.N.,Mullins,J.,Monroe,S.S., Bresee,J.,Sassano,P.,Cramer,E.H.,Glass,R.I.,2005.Norovirustransmissionon
cruiseship.EmergingInfectiousDiseases11,154–158.
Kalbfleisch,J.D.,Prentice,R.L.,2002.TheStatisticalAnalysisofFailureTimeData,
2ndedition.Wiley.
Keeling,M.J.,2005.Modelsoffoot-and-mouthdisease.Proceedings.Biological
Sci-ences272,1195–1202.
Kuusi,M.,Nuorti,J.P.,Maunula,L.,MinhTran,N.N.,Ratia,M.,Karlsson,J.,von Bonsdorff,C.H.,2002.AprolongedoutbreakofNorwalk-likecalicivirus(NLV)
gastroenteritisinarehabilitationcentreduetoenvironmentalcontamination.
EpidemiologyandInfection129,133–138.
Kypraios,T.,2009.Anoteonmaximumlikelihoodestimationoftheinitialnumber
ofsusceptiblesinthegeneralstochasticepidemicmodel.Statistics&Probability
Letters79,1972–1976.
Lau,E.H.Y.,Yip,P.S.F.,2008.Estimatingthebasicreproductivenumberinthegeneral
epidemicmodelwithanunknowninitialnumberofsusceptibleindividuals.
ScandinavianJournalofStatistics35,650–663.
L’Ecuyer,P.,Simard,R.,Chen,E.,Kelton,W.,2002.Anobject-oriented
random-numberpackagewithmanylongstreamsandsubstreams.OperationsResearch
50,1073–1075.
Liang,K.Y.,Zeger,S.L.,1986.Longitudinaldataanalysisusinggeneralizedlinear
models.Biometrika73,13–22.
Lively,C.M.,2010.Anepidemiologicalmodelofhost–parasitecoevolutionandsex.
JournalofEvolutionaryBiology23,1490–1497.
Lopman,B.,Armstrong,B.,Atchison,C.,Gray,J.J.,2009.Host,weatherand
viro-logicalfactorsdrivenorovirusepidemiology:time-seriesanalysisoflaboratory
surveillancedatainEnglandandWales.PLoSOne4,e6671.
Lopman,B.A.,Hall,A.J.,Curns,A.T.,Parashar,U.D.,2011.Increasingratesof
gas-troenteritishospitaldischargesinUSadultsandthecontributionofnorovirus,
1996–2007.ClinicalInfectiousDiseases52,466–474.
Lopman,B.A.,Reacher,M.H.,Vipond,I.B.,Hill,D.,Perry,C.,Halladay,T.,Brown,D.W., Edmunds,W.J.,Sarangi,J.,2004a.Epidemiologyandcostofnosocomial
gastroen-teritis,Avon,England,2002–2003.EmergingInfectiousDiseases10,1827–1834.
Lopman,B.A.,Reacher,M.H.,Vipond,I.B.,Sarangi,J.,Brown,D.W.G.,2004b.
Clin-icalmanifestationofnorovirusgastroenteritisinhealthcaresettings.Clinical
InfectiousDiseases39,318–324.
Meyer,S.,Elias,J.,Höhle,M.,2012.Aspace-timeconditionalintensitymodelfor
invasivemeningococcaldiseaseoccurrence.Biometrics68,607–616.
O’Neill,P.D.,Marks,P.J.,2005.Bayesianmodelchoiceandinfectionroutemodelling
inanoutbreakofNorovirus.StatisticsinMedicine24,2011–2024.
RDevelopmentCoreTeam,2010.R:ALanguageandEnvironmentforStatistical
Computing.RFoundationforStatisticalComputing,Vienna,Austria,ISBN
3-900051-07-0.
Rida,W.N.,1991.Asymptoticpropertiesofsomeestimatorsfortheinfectionratein
thegeneralstochasticepidemicmodel.JournaloftheRoyalStatisticalSociety.
SeriesB(Methodological)53,269–283.
Rosenthal,N.A.,Lee,L.E.,Vermeulen,B.A.J.,Hedberg,K.,Keene,W.E.,Widdowson, M.,Cieslak,P.R.,Vinjé,J.,2011.Epidemiologicalandgeneticcharacteristicsof
norovirusoutbreaksinlong-termcarefacilities,2003–2006.Epidemiologyand
Infection139,286–294.
Scallan,E.,Hoekstra,R.M.,Angulo,F.J.,Tauxe,R.V.,Widdowson,M.,Roy,S.L.,Jones, J.L.,Griffin,P.M.,2011.FoodborneillnessacquiredintheUnitedStates—major
pathogens.EmergingInfectiousDiseases17,7–15.
Shao, Q.X., 1999. Some properties of an estimator for the basic
reproduc-tionnumberofthegeneralepidemicmodel.MathematicalBiosciences159,
79–96.
Sukhrie,F.H.A.,Teunis,P.,Vennema,H.,Copra,C.,ThijsBeersma,M.F.C.,Bogerman, J.,Koopmans,M.,2012.Nosocomialtransmissionofnorovirusismainlycaused
bysymptomaticcases.ClinicalInfectiousDiseases54,931–937.
Teunis,P.,Heijne,J.C.M.,Sukhrie,F.,vanEijkeren,J.,Koopmans,M.,Kretzschmar, M.,2013.Infectiousdiseasetransmissionasaforensicproblem:whoinfected
whom?JournaloftheRoyalSocietyInterface10,20120955.
Thornley,C.N.,Emslie,N.A.,Sprott,T.W.,Greening,G.E.,Rapana,J.P.,2011.
Recur-ringnorovirustransmissiononanairplane.ClinicalInfectiousDiseases53,
515–520.
Vignaux, T., Muller, K., Helmbold, B., 2012. SimPy Manual, Available at
http://simpy.sourceforge.net
Venable,W.N.,Ripley,B.D.,2002.StatisticsComplementstoModernApplied Statis-ticswithS,4thedition,Availableathttp://www.stats.ox.ac.uk/pub/MASS4/
Voirin,N.,Roche,S.,Vanhems,P.,Giard,M.,David-Tchouda,S.,Barret,B.,Ecochard, R.,2011.Amultiplicativehazardregressionmodeltoassesstheriskofdisease
transmissionathospitalduringcommunityepidemics.BMCMedicalResearch
Methodology11,53.
Wickham,H.,2009.ggplot2:ElegantGraphicsforDataAnalysis.Springer,NewYork.
Wikswo,M.E.,Cortes,J.,Hall,A.J.,Vaughan,G.,Howard,C.,Gregoricus,N.,Cramer, E.H.,2011.Diseasetransmissionandpassengerbehaviorsduringahigh
morbid-ityNorovirusoutbreakonacruiseship,January2009.ClinicalInfectiousDiseases
52,1116–1122.
Wilkinson,G.N.,Rogers,C.E.,1973.Symbolicdescriptionoffactorialmodelsfor
analysisofvariance.AppliedStatistics22,392–399.
Yen,C.,Wikswo,M.E.,Lopman,B.A.,Vinje,J.,Parashar,U.D.,Hall,A.J.,2011.Impact
ofanemergentnorovirusvariantin2009onnorovirusoutbreakactivityinthe
UnitedStates.ClinicalInfectiousDiseases53,568–571.
Zelner,J.L.,King,A.A.,Moe,C.L.,Eisenberg,J.N.S.,2010.Howinfectionspropagate
afterpoint-sourceoutbreaks:ananalysisofsecondarynorovirustransmission.
Epidemiology21,711–718.
Zelner,J.L.,Lopman,B.A.,Hall,A.J.,Ballesteros,S.,Grenfell,B.T.,2013.Linking
time-varyingsymptomatologyandintensityofinfectiousnesstopatternsofnorovirus