An Zhang a b, Qingwen Qi a* a
Institute of Geographical Science and Natural Resource Research, CAS, Beijing 100101, China –(zhanga.05b,
qiqw)@igsnrr.ac.cn
b
Graduate University of the Chinese Academy of Sciences, Beijing 100039, China
KEY WORDS: Symbology, Symbols, Forest Fire, Emergency Map, Disaster, Rapid Response
ABSTRACT:
Many hazards happen in our daily life. They cause damages of property, loss of human life and environment problems. The emergency management plays a very important role when we face to these events. Spatial information plays a very important role in these emergency responses. Map is the most direct representation of spatial information. Symbology is the most intuitional and visual language in the map. In our paper forest fire emergency map is choosing as an example. Forest fire is one kind of emergency natural disasters which happened almost every day on the earth. Rapid response can avoid damages when detecting a forest fire. In order to show the forest fire information rapidly and easily understanding on the map. We try to design a suit of mapping symbols for the forest fire. According to forest fire special content, we can use four kinds of emergency map symbols: the basic geographical map symbols, the emergency events symbols, the emergency facilities related information symbols and the emergency command map symbols. At last we get a forest fire emergency map symbols. At last, four kinds of maps can be made to test these symbols, such as the forest fire risk evaluating map, the forest spreading map, the forest fire rapid response command map and the forest fire lost estimation map. The emergency symbols work very well in the forest fire rapid response. A lot of symbols are well-designed. But some of them need to re-design. In future we will provide a whole symbol library which can be used in the GIS software for emergency mapping.
* Corresponding author. Qingwen Qi Tel: 86-10-64889078, FAX 86-10-64851844, Email: qiqw@igsnrr.ac.cn.
1. INTRODUCTION
1.1 Emergency map symbology
Today is a risk world. As the increasing of the population, the relationship between human being and environment is worse and worse. Many hazards happen in our daily life. They cause damages of property, loss of human life and environment problems. The emergency management plays a very important role when we face to these events.
Spatial information plays a very important role in these emergency responses. Map is the most direct representation of spatial information. Symbology is the most intuitional and visual language in the map. But because of lacking emergency map symbology standard, emergency symbology information was not readily available. The disaster and emergency management information was hidden on the text and map. People find it is very hard to use map in the emergency command.
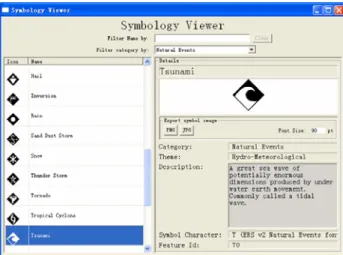
Dr. Dymon works closely with the FGDC Homeland Security Working Group to develop and promote symbology standards (Dymon, 2001; Dymon, 2003). Dymon analysed existing emergency map symbology found in various forms, including software packages, and proposes a theoretical framework for the design of emergency mapping symbology. Dymon designed a Point Symbols Symbology Viewer (Figure 1). Symbols and their definitions have been developed for Incidents, Natural Events, Operations, and Infrastructures at a level to provide immediate and general understanding of the situation.
Fitrianie try to use icon to communicate in the emergency environment instead of human language such as voice and
words (Fitrianie, 2007). Fitrianie also developed as an icon label system to send message in the rapid response.
Figure 1. Symbology Viewer designed by Dymon
1.2 Symbols in forest fire
In our paper forest fire emergency map is choosing as an example. Forest fire is one kind of emergency natural disasters which happened almost every day on the earth. Forest fire can be catch in many ways: land-use fires, carelessness, arson, or natural wildfire.
In China forest resources are abundant but also extremely precious. But forest fire occurred frequently every year and caused large damages. From 1950~2000 years, forest fire happened 13,600 times average a year in China. The yearly
average area of the forest suffers damage is amount to 758,000 hectares according to the official report from China forestry bureau. In the recent years, forest fire protection situation is at the stern condition continuously. In the year 2006, China’s forest fire happened from south to north unceasingly. In the year 2006, the nation has forest fire 7946 cases altogether; include 7 significant forest fires, especially 5 big forest fires. The total area of forest fire is 560379 hectares. And the forest suffered damage area is 407624 hectares. The casualties are 103 people include 18 people minor wounded, 44 people severely wounded, 41 people died (Zhang, 2007a).
Rapid response can avoid damages when detecting a forest fire. In order to show the forest fire information rapidly and easily understanding on the map. We try to design a suit of symbols for the forest fire emergency mapping.
2. METHODS
2.1 Visual variables of Emergency map
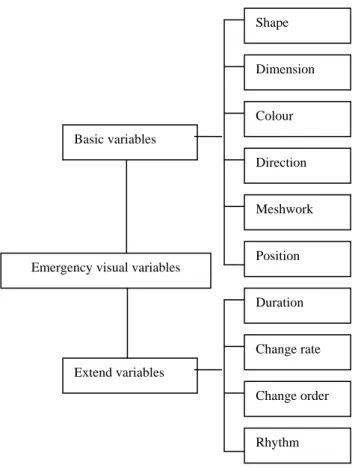
When we try to design a suit of symbols for the Emergency map, we should to know the visual variables of them. Visual variables are talked by J.Bertin in 1967. Visual variables can be defined as the graphics and color facts which can cause the differences in a map. Usually visual variables include six variables which are shape, dimension, color, direction, meshwork and position.
Figure 2. Visual variables of Emergency map
The six visual variables are the basic parameters in a printed map. But as the development of the electronic map, the screen electronic map has some new features. The electronic map can use movies and cartoons to show the dynamic information. So
we call the six visual variables as the basic variables. And there are four new visual variables which called extend visual variables (Ai, 1998). The four dynamic visual variables which are duration, change rate, change order and rhythm have been added to Bertin’s basic symbol system.
2.2 Requirement analysis
Well-designed symbols for the forest fire can be designed by adjust the visual variables. The symbols can be divided into tow types: Pictogram symbols and Semantic symbols. Many pubic information symbols are pictogram, such as the trees to represent forest and the flame to represent fire. Another type is the semantic symbols. We use H represent the hospital and F represent the forest. There are usually three kinds of symbols used in the emergency map: point, line and polygon. Different types, different shapes different colors symbols and even the size standard different information. According to forest fire special content, we can use four kinds of emergency map symbols: the basic geographical map symbols, the emergency events symbols, the emergency facilities related information symbols and the emergency command map symbols.
We should to know the requirement of the forest fire emergency map. Different kind of emergency map need different kinds of symbols. For example, we use different color to show the risk level of a forest fire. The USA government declare five colors as the Threat Advisory System level. From high level to low level there are green, blue, yellow, orange and red. In china there are four colours to represent the risk level which are blue, yellow, orange and red. But when we make the fighting command map, we use many symbols to represent the emergency resource and units.
Shape
Dimension
2.3 Process
In order to design the best representational emergency map symbols, we firstly choose symbols from exist symbols such as the ISO standards and the Chinese national symbol standards. We also referenced the popular commercial software symbol library such as ARCGIS, MapInfo, AUTOCAD and soon. After the investigation, we collect a mass of symbols. Then we divided these symbols into four kinds in different contents. Colour
Basic variables
The first is the basic geographical map symbol, such as boundary lines, roads, rivers, lakes, hills, resident places and so on. We use the ISO and national standards.
The second one is the emergency events symbol, such as the forest fire symbol, the forest fire spreading lines and so on. The third type is the emergency related facilities, such as the hospitals the fire control cars, fire brigades, fire watch towers and so on.
The fourth type is the emergency command map symbol, such as the rapid repose power command arrows, the forest fire break lines and so on.
We adopt the public accepted map symbols and give each an index. The homonymy and uncertain map symbols are collected. We do some questionnaire investigations and decide reserve which symbols. If people think all the symbols are all not suitable, we will design some new ones. At last we get a forest fire emergency map symbols.
Emergency visual variables
Extend variables Direction Meshwork Position Duration Change rate Change order Rhythm
3. DESIGN SYMBOLS
3.1 Symbol design tools
In order to design a well symbol, we can use three kinds of software tools.
Firstly, we can use graphic design software tools, such as Photoshop, CorelDraw and so on. The symbol can be output as a picture.
Secondly, we can use GIS software tools, such as ARCGIS, MapInfo and so on. Usually this kind of symbols can only be used by the GIS software tools themselves.
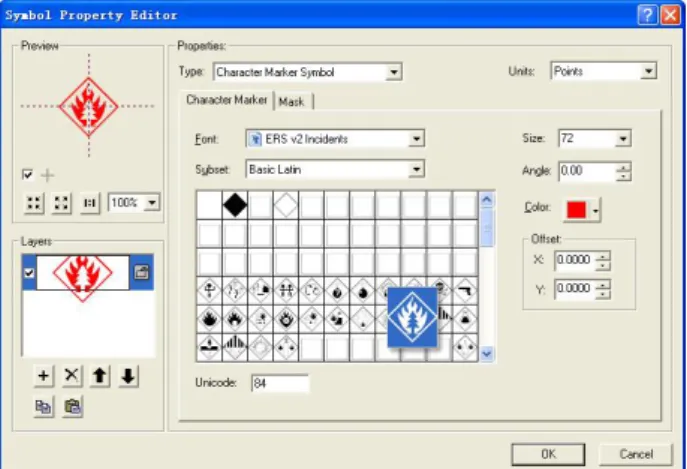
Thirdly we can use font software tools, Such as Font Creator. A lot of GIS software and graphic design software support the font as symbols. So the font symbols can be use currency. We designed a symbol in the Font Creator as Figure 3.
Figure 3. Symbol design tools
3.2 How to use
After design, we can use symbols in the mapping software tools. Take the ArcGIS as an example.
First, copy the TTF type font to the windows font folder. The font will be installed automatically.
Then, we can load the font symbols which created Font Creator by using the symbol property editor as Figure 4.
After load the font symbols, the symbols’ size, colour and offset can be set. Then they can be saved in a style. Next time, when you want to use these symbols, you can symbolize the point by using the font.
The using of font symbols in other software such as MapInfo is same to this process.
Figure 4. Symbol property editor
3.3 Dynamic Symbol design
Usually, the emergency is changing as the time changing. In order to show the dynamic map, we can change the four dynamic visual variables which are duration, change rate, change order and rhythm.
Take the ArcGIS as an example. First we should prepare as time serial data, such a fire spreading area. Then we create several key frames as Figure 5
Figure 5. Creating key frames
At last we can use the animation controls to play the key frames continuously. And you can set the duration, change rate, change order and rhythm. After adjust, the dynamic map will be created and can be output as a movie.
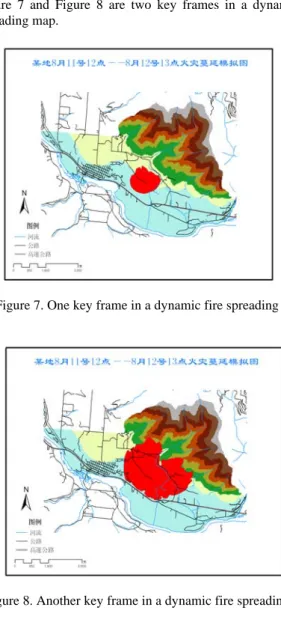
So the dynamic map is makeup by key frames. And as the dynamic visual variables change, the map will be dynamic. Figure 7 and Figure 8 are two key frames in a dynamic fire spreading map.
Figure 7. One key frame in a dynamic fire spreading map
Figure 8. Another key frame in a dynamic fire spreading map
4. CASE STUDY
In order to test these symbols in the forest fire maps, we develop a forest fire automatic monitoring system. Jinggang Mountain which locates in Jinggangshan city in Jiangxi province of China is taken as an example.
Figure 9. Example of fire fighting command map
Four kinds of maps have been made to test these symbols, such as the forest fire risk evaluating map, the forest spreading map, the forest fire rapid response command map and the forest fire lost estimation map. Figure 9 is an example of fire fighting command map.
5. CONCLUSIONS
The emergency symbols work very well in the forest fire rapid response. A lot of symbols are well-designed. But some of them need to re-design. Our work is just started. Nowadays only the point symbols are designed. The symbology of polygon and line symbols is still in processing. The dynamic symbol technology is also developing. In future we will provide a whole symbol library which can be used in the GIS software for emergency mapping.
REFERENCES
Ai TH,1998. Dynamic Symbol and Dynamic Map. Journal of Wuhan Technical University of Surveying and Mapping. Vol.23 (1):47-51.
Brewer, Cynthia A., Geoffrey W. Hatchard and Mark A. Harrower, 2003.ColorBrewer in Print: A Catalog of Color Schemes for Maps, Cartography and Geographic Information Science, 30(1): 5-32.
Cova, T.J, 1999.GIS in emergency management. In: Geographical Information Systems: Principles, Techniques, Applications, and Management, P.A. Longley, M.F. Goodchild, D.J. Maguire, D.W. Rhind (eds.), John Wiley & Sons, New York: 845-858.
Cova, T.J., Dennison, P.E., Kim, T.H., Moritz, M.A, 2005. Setting wildfire evacuation trigger-points using fire spread modelling and GIS. Transactions in GIS, 9(4): 603-617.
Dymon U.J., N.L. Winter, 1991. Emergency mapping in grassroots America: a derailment evacuation case study. Geoforum, 22(4): 377-389.
Dymon U.J, 2001. A standardized framework for hazards management mapping, Proceedings 20th International Cartographic Conference, Beijing, China, 4: 2760-2764.
Dymon U.J, 2003. An analysis of emergency map symbology, Int. J. Emergency Management, 1(3): 227-237.
Fitrianie S, Poppe R, Bui T.H., Chitu A.G., Datcu D., Dor R., Hofs D.H.W., Wiggers P., Willems D.J.M., Poel M., Rothkrantz L.J.M., Vuurpijl L.G., Zwiers J., 2007. A Multimodal Human-Computer Interaction Framework for Research into Crisis Management. ISCRAM 2007, 5:149-158.
Zhang A, Qi QW, Jiang LL, 2007a. Research about the Location Technologies of Forest Fire Detecting Based on GIS. Proceedings of SPIE -- Volume 6754 Geoinformatics 2007: Geospatial Information Technology and Applications, Peng Gong, Yongxue Liu, Editors: 67541N
Zhang A, Qi QW, Jiang LL, 2007b. Study on Emergency Mapping Technology in Rapid Response. Proceedings of the First International Conference on Risk Analysis and Crisis Response: 873-877
ACKNOWLEDGEMENTS
This research was supported by the National 973 program from China (No. 2003CB415105-02), National 863 program from China (No. 2006AA06Z418) and High-Tech Research and Development Plan of China’s project: CNGI form National Development and Reform Commission.