Surveillance
of
antimicrobial
resistance
in
Lebanese
hospitals:
retrospective
nationwide
compiled
data
Kamal
Chamoun
a,
Maya
Farah
a,
Georges
Araj
b,
Ziad
Daoud
c,
Rima
Moghnieh
s,
Pascale
Salameh
d,
Danielle
Saade
e,
Jacques
Mokhbat
f,
Emme
Abboud
g,
Monzer
Hamze
h,
Edmond
Abboud
i,
Tamima
Jisr
j,
Antoine
Haddad
k,
Rita
Feghali
l,
Nadim
Azar
m,
Mohammad
El-Zaatari
n,
Marwan
Chedid
o,
Christian
Haddad
p,
Mireille
Zouain
Dib
Nehme
q,
Angelique
Barakat
r,
Rola
Husni
f,*
Lebanese
Society
of
Infectious
Diseases
Study
Group
(LSID
study
group)
a
DepartmentofInternalMedicine,LebaneseAmericanUniversityMedicalCenter-RizkHospital,Beirut,Lebanon b
DepartmentofMicrobiology,AmericanUniversityofBeirutMedicalCenter,Beirut,Lebanon
cDepartmentofMicrobiology,FacultyofMedicine,UniversityofBalamandandCentreHospitalierdunordHospital,Beirut,Lebanon dSchoolofPharmacy,PharmacyPracticeDepartment,LebaneseAmericanUniversity,Byblos,Lebanon
e
EpidemiologicalSurveillanceUnit,MinistryofPublicHealth,Beirut,Lebanon f
DepartmentofInternalMedicine,DivisionofInfectiousDiseases,LebaneseAmericanUniversity-RizkHospital,Beirut,Lebanon g
DepartmentofMicrobiology,MountLebanonHospital,Beirut,Lebanon h
DepartmentofMicrobiology,NINIHospital,Tripoli,Lebanon i
DepartmentofMicrobiology,MiddleEastInstituteofHealth,MountLebanon,Lebanon jDepartmentofMicrobiology,MakassedHospital,Beirut,Lebanon
k
DepartmentofMicrobiology,Sacre´ CoeurHospital,MountLebanon,Lebanon l
DepartmentofMicrobiology,RafikHaririUniversityHospital,Beirut,Lebanon m
DepartmentofMicrobiology,HotelDieudeFranceHospital,Beirut,Lebanon n
DepartmentofMicrobiology,HammoudHospital,Saida,Lebanon o
DepartmentofMicrobiology,MazloumHospital,Tripoli,Lebanon p
DepartmentofMicrobiology,NotreDamedesSecoursHospital,Byblos,Lebanon qDepartmentofMicrobiology,AbouJaoudeHospital,MountLebanon,Lebanon r
DepartmentofMicrobiology,BellevueHospital,MountLebanon,Lebanon s
DepartmentofInfectiousDiseases,MakassedHospital,Beirut,Lebanon
ARTICLE INFO
Articlehistory:
Received17January2016
Receivedinrevisedform9March2016 Accepted12March2016
CorrespondingEditor:EskildPetersen,
Aarhus,Denmark. Keywords: Gram-negativebacteria Gram-positivebacteria Susceptibility Resistance Lebanon SUMMARY
Antimicrobialresistanceiscloselylinkedtoantimicrobialuseandisagrowingconcernworldwide. Antimicrobial resistance increases healthcare costs substantially in many countries, including Lebanon. National data from Lebanonhave, in the most part, been limited to afew academic hospitals.TheLebanese Societyof Infectious Diseasesconducted aretrospectivestudy tobetter describetheantimicrobialsusceptibilitypatternsofbacterialisolatesinLebanon.Datawerebasedon recordsretrieved from the bacteriologylaboratoriesof 16different Lebanese hospitalsbetween January2011andDecember2013.Thesusceptibility resultsofatotal20684Gram-positiveand 55594 Gram-negative bacteria were analyzed. The prevalence rate of methicillin-resistant Staphylococcusaureuswas27.6%andofvancomycin-resistantEnterococcussppwas1%.Streptococcus pneumoniaehadsusceptibilitiesof46%tooxacillin,63%toerythromycin,and98%tolevofloxacin. Streptococcuspyogeneshadsusceptibilitiesof94%toerythromycinand95%toclindamycin.Themean ampicillinsusceptibilityofHaemophilusinfluenzae,Salmonellaspp,andShigellasppisolateswas79%, 81.3%, and 62.2%, respectively. The extended-spectrum beta-lactamase production rate for Escherichiacoliwas32.3%andforKlebsiellasppwas29.2%.Acinetobactersppshowedhighresistance tomostantimicrobials,withlowresistancetocolistin(17.1%).Pseudomonassppsusceptibilitiesto piperacillin–tazobactamandimipenemwerelowerthan80%(79.7%and72.8%,respectively).This studyprovidespopulation-specificdatathatarevaluableinguidingantimicrobialuseinLebanonand
* Correspondingauthorat:LebaneseAmericanUniversityMedicalCenter-RizkHospital,ZAHARStreet,Beirut,Lebanon.Tel.:961-1200800x6422.
E-mailaddress:roula.samaha@umcrh.com(R.Husni).
ContentslistsavailableatScienceDirect
International
Journal
of
Infectious
Diseases
j o urn a l hom e pa ge : ww w. e l s e v i e r. c om/ l o ca t e / i j i d
http://dx.doi.org/10.1016/j.ijid.2016.03.010
1201-9712/ß2016TheAuthors.PublishedbyElsevierLtdonbehalfofInternationalSocietyforInfectiousDiseases.ThisisanopenaccessarticleundertheCCBY-NC-ND license(http://creativecommons.org/licenses/by-nc-nd/4.0/).
1. Introduction
Antimicrobialresistanceisapublichealthconcernworldwide, particularlyindevelopingnations, andis associatedwithmany socio-culturalfactors.Overthelast70years,bacteriahavebecome resistant to nearly all clinically relevant antibiotic agents. The UnitedStatesCenters forDisease Controland Prevention(CDC) estimates that atleast two million Americans becomeinfected with antibiotic-resistant bacteria each year, with at least 23000peopledyingyearlyasadirectresultoftheseinfections.1 CountriesintheArabianGulfincludingSaudiArabia,theUnited Arab Emirates, Kuwait,Qatar, Oman, and Bahrain share a high prevalenceofinfectionsduetoextended-spectrumbeta-lactamase (ESBL)-andcarbapenemase-producingGram-negativebacilli.2
The single most important factor leading to antimicrobial resistancegloballyistheoveruse/misuseofantimicrobials.1Thisis mainly due to incorrect diagnosis, the irrational use of anti-microbials,andirregularconsumption,thelatterdueeithertoan incorrect prescription or to poor compliance.Up to 50% of all antimicrobialsprescribedforpatientsarenotneededorarenot optimal as prescribed.3 A core action to fight the spread of antimicrobial resistance is their improved use. The lack of implementation of adequate infection control measures has complicatedthisgoal,necessitatingurgentintervention.
Infectionscausedbyantibiotic-resistantorganismscontinueto addconsiderableandavoidablecoststothealreadyoverburdened Lebanesehealthcaresystem.Theinfectionsleadtocomplications that require additional therapeutic interventions, including in-dwelling catheters, sophisticated life support, intravenous fluid therapy,andprostheticdevices.Theycanalsoextendthehospital stay and the useof broad-spectrum antimicrobials appreciably, which in turn can increase the prevalence rate of multidrug-resistantpathogens.
Thepatternofantimicrobialresistancechangeswithtimeand variesfromcountrytocountryandalsobetweenhospitalswithin the same country. Therefore, data on the prevailing regional resistanceandtrendsofclinicallyimportantbacterialisolatesare helpfulforphysiciansmakingdecisionsconcerningthe appropri-ateempiricaltreatmentofvariousinfections.
InLebanon, the resistancetrends of bacterial isolates have been reported in a few hospitals for several years. However, similar information does not exist at the national level. The Lebanese Society of Infectious Diseases (LSID) study group conducted the present study to better describe the national antimicrobial resistance patterns among clinically relevant pathogens.TheLSIDalsointendstoimplementadatabaseinto whichlaboratoriesusingstandardizedtechniquescanentertheir dataona regularbasis. Thiswill allowtheestablishmentof a surveillancesystem in Lebanon,which willhelp incombating antimicrobialresistance.
2. Methods
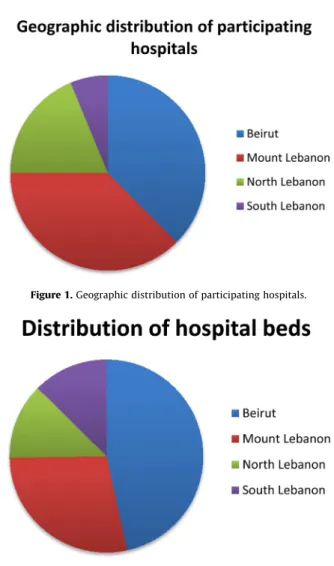
This retrospective study was based on the records of antimicrobialsusceptibilitytestsperformedon bacterialisolates inthebacteriologylaboratoriesof16differenttertiarycarecentres, representing40.7%ofallhospitalbedsinLebanon.Hospitalsand hospitalbeddistributiondataarepresentedinFigures 1and2,
respectively.Theonlygovernoratethatwasnotrepresentedinthis studywasBekaa.
The study team collected data related to tests performed between January 2011 and December2013. The datacollected wereprimarilyqualitative(resistant,intermediate,orsusceptible). Data were then tabulated in Excel spreadsheets. Most of the laboratoriesgeneratedtheirdatausingWHONETsoftware.Inan attempttostandardizetheselectioncriteriaforbacterialisolates and avoid the duplication of isolates, laboratories not using WHONETsoftwareincludedonlythefirstisolatefromeachpatient withdifferentantibioticsusceptibilityprofiles(criteriafor selec-tion setforWHONET). Sixhospitalsprovided datafor theyear 2011, 12 provided data for 2012, and 13 provided data for 2013. Clinical specimensincludedurine, sputum,deep tracheal aspirates, blood, body fluids, central line tips, and others. The characteristicsoftheparticipatinghospitals,aswellasthetesting methodsandguidelinesfollowedateachinstitution,arepresented inTable1.Non-automatedtestswithoxacillinandcefoxitin4anda double-disc synergy test5 were used for the detection of methicillin-resistant Staphylococcus aureus (MRSA) and ESBL-producingbacteria,respectively.
Figure2.Distributionofhospitalbeds.
neighbouringcountriesandwillhelpintheestablishmentofasurveillancesystemforantimicrobial resistancefollowingtheimplementationofanationwidestandardizationoflaboratorymethodsand dataentry.
ß2016TheAuthors.PublishedbyElsevierLtdonbehalfofInternationalSocietyforInfectiousDiseases. ThisisanopenaccessarticleundertheCCBY-NC-NDlicense (http://creativecommons.org/licenses/by-nc-nd/4.0/).
Antimicrobialsusceptibilityresultswerecollected,enteredinto MicrosoftExcelspreadsheets,verified,andanalyzedusing Micro-soft Excel 2007. The rates of susceptibility to individual antimicrobials were calculated for every bacterial isolate by hospital,yearofisolation,and region.Themeanpercentagesof thesusceptibilityofeachisolatetoalltestedantimicrobialswere calculated.Yearlyandregionalcomparisonswereperformedusing theChi-squaretestaftercheckingtheapplicabilityconditions.Ap -value of<0.05 was considered significant. When comparing resultsfromthe three differentyears, p<0.05 was considered statisticallysignificantifatleastonevaluewasdifferentfromthe
others.InthecasewheretheChi-squaretestcouldnotbeapplied becauseofanexpectedcountinacelloflessthan5,thetwo-sided Fisher’sexacttestwasused.
3. Results
The susceptibility results of 20684 Gram-positive and 55594Gram-negativebacteriacollectedfrom16different hospi-talsinLebanon(3950beds)betweenJanuary2011andDecember 2013wereanalyzed.TheisolatesaresummarizedinTable2.The mostcommonGram-negativespeciesisolatedwasEscherichiacoli, followedbyPseudomonasaeruginosaandKlebsiellaspp.
Atotal4890S.aureusisolateswerecollectedinthe16hospitals. The prevalence of MRSA extrapolated based on resistance to oxacillinandcefoxitinwas27.6%. ThesusceptibilityofS.aureus
isolatestoerythromycinandclindamycinwasstable(mean76% and83.2%,respectively).Meansusceptibilitiestothemostrelevant antimicrobials are presented in Table 3. The vancomycin-non-susceptibleisolatesfrom2012werenotindependentlyconfirmed; the data were thus considered as only presumptive, requiring further investigation.Thisfindingsuggeststheneedfor greater vigilanceintheprocessofdetectingandreportingthisimportant typeofresistance.
The mean susceptibility results for the 648 isolates of
Streptococcus pneumoniae and 986 isolates of Streptococcus pyogenesarepresentedinTable3.S.pneumoniaeisolatesdisplayed low susceptibility tooxacillin(46.2%). Astatistically significant decreasingtrendinerythromycinsusceptibilitywasnoted,from 69.4%in2011to58.7%in2013.Highsusceptibilitieswereevident tolevofloxacin(98%)andceftriaxone(95%).
ThesusceptibilityofEnterococcusspptoampicillinwas84.4%, with a decreasing trend, from 91.1% in 2011 to 81.6% in 2013.Vancomycin-resistantenterococci(VRE)werereportedfrom sixcentres,witharateof1%(Table3).Somehospitalsreported
Enterococcus faecalis and Enterococcus faecium separately, while othersmadenodistinctionbetweenEnterococcusspecies.Thedata reportedhereareforallEnterococcusspecies.
The mean susceptibilities of Haemophilus influenzae didnot differfrom2011to2013.Themeansusceptibilitytoampicillinwas 79%.Thesusceptibilitytobothlevofloxacinandciprofloxacinwasa meanof93%(Table4).
Salmonella spp showed a mean susceptibility of 81.3% to ampicillinand95%tociprofloxacin.Thesusceptibilityto trimeth-oprim–sulfamethoxazoledecreasedin2013toabout88%,butthis decreasewasnotstatisticallysignificant.Susceptibilityto ceftri-axoneremainedhighat97.3%(Table4).Nalidixicacid susceptibil-ity,whichwasreportedfromonecentreonly,was75%(n=4)for
SalmonellaTyphiand11%fornon-TyphiSalmonella(n=28).
Shigellasppshowed62.2%susceptibilitytoampicillin,99%to ciprofloxacin, and 28% totrimethoprim–sulfamethoxazole. Sus-ceptibilitytoceftriaxoneremainedhighat89.1%(Table4).
The meansusceptibilities ofE. coliisolates are presentedin
Table5.TheaverageESBLproductionwasfoundtobe32.3%during thestudy period. In theyears 2011,2012, and 2013,theESBL productionrateswere32.0%,30.8%,and33.6%,respectively.E.coli
showedtheleastresistancetoimipenem(meanresistanceof0.7%), and thiswasstable overthe3-yearstudy period.Resistanceto nitrofurantoinandtigecyclinewaslow(4%and1.8%,respectively). Susceptibility to most cephalosporins showed a statistically significant decreasing trend. Susceptibilityto ciprofloxacin also decreased from 2011 to 2013, with mean values of 57.4% in 2011and52.0%in2013.Amongtheaminoglycosides,E.coliwas more susceptible to amikacin than gentamicin, with mean susceptibilitiesof97.2% and71.7%,respectively,andthesewere stableduringthestudyperiod(Table5).
Table1
Demographicsandtestingguidelinesrelatedtotheparticipatinghospitals Hospital Region Type Beds Methoda
Guidelines AbouJaoude MountLebanon Community 110 DD CLSI AUBMC Beirut University 350 DD CLSI BMC MountLebanon University 110 DD SFM CHN NorthLebanon University 200 DD CLSI Hammoud SouthLebanon University 500 Automated CLSI HDF Beirut University 450 Automated EUCAST UMCRH Beirut University 90 DD CLSI Makassed Beirut University 200 DD CLSI Mazloum NorthLebanon Community 180 DD
+automated CLSI +EUCAST MEIH MountLebanon University 200 DD SFM MLH MountLebanon University 240 Automated CLSI NDS MountLebanon University 250 Automated CLSI NINI NorthLebanon Community 120 DD EUCAST RHUH Beirut University 350 Automated CLSI SCH MountLebanon University 200 DD EUCAST SGH Beirut University 400 DD CLSI AUBMC,AmericanUniversityofBeirutMedical Center;BMC,BellevueMedical Center;CHN,CentreHospitalierduNord;HDF,HotelDieudeFrance;UMCRH, UniversityMedicalCenterRizkHospital;MEIH,MiddleEastInstituteofHealth; MLH,MountLebanonHospital;NDS,NotreDamedesSecours;NINI;RHUH,Rafik HaririUniversityHospital;SCH,Sacre´ CoeurHospital;SGH,SaintGeorgesHospital; DD,discdiffusion;CLSI,ClinicalandLaboratoryStandardsInstitute;SFM,Societe´ Franc¸aise de Microbiologie; EUCAST, European Committee on Antimicrobial SusceptibilityTesting.
a
Automatedmicrobialidentificationsystem:Vitek,BDPhoenix.
Table2
Gram-positiveandGram-negativeisolates
Gram-positiveisolates Totalnumber collected Proportion (Gram-positive) Coagulase-negativeStaphylococcus 8194 39.6% Staphylococcusaureus 4890 23.6% Enterococcusspp 4145 20% Streptococcusagalactiae 1386 6.7% Streptococcuspyogenes 1059 5.1% Streptococcuspneumoniae 648 3.1%
Streptococcusviridansgroup 362 1.8% TotalGram-positive 20684 100% Gram-negativeisolates Totalnumber
collected Proportion (Gram-negative) Escherichiacoli 30411 54.7% Pseudomonasaeruginosa 7897 14.2% Klebsiellaspp 7883 14.2% Acinetobacterspp 3409 6.1% Enterobacterspp 2207 4.0% Salmonellaspp 877 1.6% Citrobacterspp 738 1.3% Morganellamorganii 675 1.2% Haemophilusinfluenzae 552 1.0% Serratiaspp 480 0.9% Shigellaspp 164 0.3% Proteusspp 162 0.3% Moraxellacatarrhalis 139 0.2% TotalGram-negative 55594 100% TotalGram-positiveand
Gram-negativeisolates
ThemeansusceptibilitiesofKlebsiellaspptothemostrelevant antimicrobialsarepresentedinTable5.Intheyears2011,2012, and 2013, the ESBL production rates in Klebsiella were 30.2%, 28.1%,and29.9%,respectively(mean29.2%).Klebsiellasppshowed thehighestsusceptibilitytoimipenem(98%)andamikacin(95.7%), followedbytigecycline(87%).Alowresistancetocarbapenems,a relatively low susceptibilityto trimethoprim–sulfamethoxazole, andastatisticallysignificantdeclineinsusceptibilityto nitrofur-antoinwerenoted.
Four hospitals reported the susceptibility to Acinetobacter baumannii,whileallof theothers reportedthesusceptibilityof
Acinetobacterspp.ThemeansusceptibilitiesofAcinetobactersppare presentedinTable6.Acinetobactersppshowedhighresistanceto most of the antimicrobials and low resistance to colistin. The susceptibilitytocolistinwas77.1%in2012and95.6%in2013,with ameanof82.9%(Table6).
ThemeansusceptibilitiesofPseudomonasspparepresentedin
Table6.Susceptibilitytoceftazidimerangedbetween78.4%and 83.3%. Susceptibilities to both aztreonam and imipenem were lowerthan80%,whileciprofloxacinwasassociatedwith suscepti-bilityrangingbetween74.8%and80.3%.
4. Discussion
Thefirstcomprehensivereportoftheantimicrobial suscepti-bilityofbacterialisolatesinLebanonwaspublishedin1994 fol-lowinganinvestigationbyArajetal.onthesusceptibilitypatterns ofclinicalisolatesat theAmericanUniversity ofBeirutMedical Center(AUBMC)fromMarch1992throughJune1993.Theoverall antimicrobial resistance rates did not differ significantly from those reported in the Arabian Gulf countries and US medical centres.6Thesurveillanceofbacterialsusceptibilityto antimicro-bials was performed in selected,mainly academic hospitals in Lebanon. Each hospital reported its own data separately. The presentstudyisthefirsttocompiledatageneratedbydifferent hospitalsrepresentingmostregionsofthecountry.
S.aureusisamajorpathogeninboththehospitalenvironment andthewidercommunity.Itcausesawidevarietyofinfections
that are associatedwith considerablemorbidityand significant mortality.ThehighprevalenceofMRSAfoundinthisstudy(27.6%) mayreflect healthcare-associatedinfectionsthat aredifficultto control.ThetransmissionofMRSAmayoccurduringbed-making, changing of clothes, and sneezing, and may result from poor hygienepractices.7,8ManyhospitalsinLebanondonotusecontact isolationforpatientswithMRSA,whichcouldbeacauseofthis highreportedrate.
Amongallresistantpathogens,MRSAisofparticularconcern becauseofitsimportanceincausingvariousclinicalconditions. MRSAprevalencedifferedamongthehospitals,beinglow(<20%) in some and exceeding 30% in others, suggesting possible outbreaksinsomeofthesecentres.
Between 2003 and 2005, the ARMed (Antibiotic Resistance Surveillance and Control in the Mediterranean Region) project reportedanMRSArateof39%amongthesusceptibilitytestresults of5000invasiveisolatesofS.aureusobtainedfrombloodcultures in62hospitalslocatedinAlgeria,Cyprus,Egypt,Jordan,Lebanon, Malta,Morocco,Tunisia,andTurkey.9Lebanonappearstohavea lowerMRSArate.
InthestudyconductedbyAraj etal.,therewasasignificant increase intheprevalence ofMRSA from3%in 1971to38% in 1999.6However,ratesatAUBMChavebeenaround20%inthelast decade. Vancomycin-intermediate S. aureus and vancomycin-resistant S. aureus strains were not reported.10 The present nationwide data collected from 16 hospitals over a period of 3yearsindicateanMRSArateof27.6%.
PreviouslyreportedratesofpenicillinresistanceofS. pneumo-niae isolates in Lebanon between 1990and 1996 were13% in AUBMC and 12% in Makassed General Hospital.11,12 A study conductedfrom2000to2004ina Beiruthospitalreported that only 40.6–50% of S. pneumoniae isolates were susceptible to penicillin G, with a decreasing trend in the susceptibility to clindamycin anderythromycin.13Thepattern ofresistance ofS. pneumoniaewasassessedagainin2011;48%ofisolatedspecies weresusceptible topenicillin, 50%wereintermediate,and 1.6% werefullyresistanttothisantibiotic.14OtherdatafromLebanon andtheregionhaveindicatedS.pneumoniaesusceptibilityratesof
Table3
SusceptibilityratesofGram-positiveorganismsobtainedfrom16Lebanesehospitals Percentagesusceptibilitytotheantimicrobialagents(numberofisolates)
Staphylococcusaureus Streptococcuspneumoniae
2011(790) 2012(1717) 2013(2383) Allyears (4890)
p-Value 2011(102) 2012(230) 2013(316) Allyears (648) p-Value Oxacillin 76.4(790) 72.1(1717) 72.9(2245) 73.3 0.066 50.5(61) 44.3(201) 46.7(239) 46.2 0.205 Ceftriaxone 94.5(94) 92.4(92) 97.5(81) 94.7 <0.05a Tigecycline 100(12) 98.8(236) 100(244) 99.4 <0.05a,b TMP–SMX 91.1(595) 91.6(1679) 90.5(2330) 90.9 0.475 52.9(17) 52.2(160) 53.3(119) 52.6 0.654 Levofloxacin 88.3(300) 83.0(1213) 84.0(784) 84 <0.05a 98.5(70) 96.6(210) 99.6(203) 98.1 <0.05b Erythromycin 76.2(790) 76.0(1717) 75.9(2383) 76 0.986 69.4(102) 64.6(230) 58.7(212) 63.2 <0.05b Clindamycin 85.8(759) 81.5(1535) 83.7(2065) 83.2 <0.05a 82.0(94) 73.0(212) 76.4(282) 76 0.183 Vancomycin 100(790) 99.1(1717) 100(2383) 99.7 <0.05a,b
Streptococcuspyogenes Enterococcusspp
2011(60) 2012(459) 2013(467) Allyears (986)
p-Value 2011(538) 2012(1666) 2013(1941) Allyears (4145) p-Value Penicillin 100(60) 100(459) 100(160) 100 Ampicillin 91.1(518) 85.5(1415) 81.6(1914) 84.4 <0.05a,b Tigecycline 100(67) 99.0(388) 100(268) 99.4 <0.05a,b Erythromycin 88.4(60) 93.7(459) 94.9(467) 94 <0.05a Clindamycin 83.3(30) 95.4(450) 96.1(419) 95.3 <0.05a Vancomycin 100(538) 99.0(1666) 98.8(1941) 99 <0.05a Teicoplanin 100(538) 97.7(1400) 98.8(1941) 98.6 <0.05a,b TMP–SMX,trimethoprim–sulfamethoxazole.
p-Valuereportsatleastonesignificantdifferencebetweenanypercentages.
a
p-value<0.05between2011and2012.
50% to penicillin and 25% to erythromycin between 2003 and 2005,15withmarkedlyhigherratesofpenicillinresistance(60– 72%)reportedatAUBMCbetween2000and2011.10
PenicillinresistanceofS.pneumoniaehasbeencorrelatedwith the nationwideuse of penicillin.16 The Lebanese Inter-Hospital PneumococcalSurveillanceProgramwasestablishedtodetermine theburdenofinvasivepneumococcaldiseaseand theprevalent serotypes.Thefirstnationwidedatafromtheprogrampublishedin 2012indicatedapenicillinresistancerateof17.5%usingthenew Clinical andLaboratoryStandardsInstitute(CLSI)breakpoints.17 Thisismarkedlylessthanthepresentresistancerateof53.8%.The discrepancy maybedue totheuseof theolder, pre-2008CLSI breakpointinmostofthecentres,ormaybebecauseoftheuseof ‘meningitis’or‘non-meningitis’or‘oral’breakpoints.Information onthebreakpointusedbythemicrobiologylaboratorieswasnot available.Itisbelievedthattherateofsusceptibilitytopenicillinis closertothatreportedbythePneumococcalSurveillanceProgram. On the other hand, the susceptibility of S. pneumoniae to erythromycinwaslow(63%),possiblybecauseoftheoveruseof thisclassofantimicrobialinLebanon,sincealloralantimicrobials are available over the counter. S. pneumoniae susceptibility to levofloxacinremainedhigh(98%).S.pyogenesremainedsensitive toampicillinduringthestudyperiod.Thisfindingisuniversal.
InanearlierstudyconductedatAUBMC,therateofampicillin susceptibilityofEnterococcusspprangedfrom95%to84%andVRE rateswerelow.10Inthepresentstudy,therateofEnterococcusspp susceptibilitytoampicillinwassimilarat84.4%andtheVRErate was low (1%). The data reported here are for all Enterococcus
species, as not all hospitals made a distinction between the
Enterococcusspecies.
ApriorevaluationofH.influenzaeisolatesataBeiruthospital revealedresistancetoamoxicillin–clavulanate,ceftriaxone, cipro-floxacin,andrifampicin,withmorethan92%ofisolatesshowing susceptibilitytocefuroxime,chloramphenicol,erythromycin,and tetracycline.13 The high susceptibility of H. influenzae to the aforementionedantimicrobialswasfoundtohavecontinuedinthe presentstudy(>92%).
Araj et al. reported high susceptibility of Salmonella and Shigellain2012.10Inthepresentstudy,SalmonellaandShigella susceptibilities to ampicillin were 81% and 62%, respectively. Susceptibilitiestotrimethoprim–sulfamethoxazolewerelower,at 88% and28%, respectively.Highsusceptibilities tociprofloxacin and ceftriaxonewerereported during the3years of thestudy. ResistanceofShigellaspptothird-generationcephalosporinswas firstdetectedinLebanonin2005;thissubsequentlyincreased,and ESBL-producingstrainswererevealed.18,19
In2003,therateofESBL-producingE.coliwasfoundtobe2.0% inalargehospitalinBeirut.20Laterstudieschronicledincreased ratesofESBL-producingE.coliisolatesfromabout4%in2000to about 30% in 2011.10,21 An investigation of the susceptibility profilesofE.coliatonecentrebetween2000and2009revealedan increaseintheprevalenceofESBL-producingisolatesfrom2.3%to 16.8%,withtheleastsusceptibilitytopiperacillinandampicillin and 100% susceptibilitytoimipenem.21Araj et al.foundE. coli susceptibility to imipenem to be 99.9% to 100% in their 2012 study.10 In the present study, the mean prevalence of ESBL-producing E.coli isolates was32.3%; quinoloneresistance wasabout55%andimipenemresistancewas0.7%.Asaresultof thesefindings,theempiricaluseofquinolonesasfirst-linetherapy inthetreatmentofurinarytractinfectionsisnowavoided.This will be reflected in guidelines that are in preparation for publication.
The prevalenceof ESBL-producing Klebsiella pneumoniae iso-lateswas20.0%inastudyconductedin2003inalargehospitalin Beirutand28%inastudyperformedatAUBMCin2011.10,20The
Table 4 Susceptibility rates of Haemophilus influenzae , Salmonella spp , and Shigella spp obtained from 16 Lebane se hospitals Percentage susceptibility to the antimicrobial agents (number of isolates) Haemophilus influenzae Salmonella spp Shigell a spp 2011 (91) 2012 (232) 2013 (244) All years (552) p -Value 2011 (151) 2012 (331) 2013 (395) All years (877) p -Value 2011 (8) 2012 (101) 2013 (55) All years (164) p -Value Ampicillin 85.3 (73) 77.7 (201) 78.0 (215) 79 0.39 85.6 (113) 80.0 (285) 81.0 (386) 81.3 0.39 NA (0) 63.2 (98) 60.0 (44) 62.2 0.63 Amox–Clav 92.3 (91) 94.7 (232) 94.4 (234) 95.1 0.67 93.0 (151) 96.0 (209) 93.7 (183) 94.4 0.31 100 (8) 78.7 (19) 91.0 (11) 86.7 0.3 Cefuroxime 100 (8) 96.9 (131) 98.7 (165) 97.9 0.48 Cefotaxime 100 (34) 99.4 (248) 98.5 (291) 99 0.41 100 (8) 84.6 (100) 85.3 (55) 85.6 0.49 Ceftriaxone 100 (73) 97.0 (99) 99.2 (215) 98.8 0.17 97.5 (127) 98.2 (215) 96.7 (348) 97.3 0.63 NA (0) 90.1 (30) 88.4 (44) 89.1 0.85 Cefepime 100 (8) 100 (14) 100 (6) 100 NA 97.9 (151) 99.4 (303) 98.7 (395) 98.8 0.45 100 (8) 96.2 (89) 94.6 (55) 95.8 0.69 Gentamicin 100 (18) 97.9 (50) 93.0 (29) 97.5 0.33 TMP–SMX 46.4 (73) 59.8 (198) 63.1 (229) 59.3 < 0.05 a 95.0 (151) 94.8 (331) 87.9 (378) 91.8 < 0.05 13 (8) 24.6 (95) 36.7 (55) 28.2 0.17 Ciprofloxacin 96.0 (83) 85.8 (49) 93.2 (70) 93 0.07 86.6 (151) 97.2 (331) 95.8 (395) 94.8 < 0.05 a 100 (8) 97.9 (100) 100 (55) 98.7 0.52 Norfloxacin NA (0) 98.0 (216) 95.7 (233) 96.8 0.13 NA (0) 100 (98) 100 (44) 100 NA Levofloxacin 100 (8) 91.6 (73) 93.3 (155) 93 0.65 Azithromycin 87.5 (8) 100 (57) 100 (6) 98.6 < 0.05 a Tetracycline 89.0 (18) 88.1 (50) 96.6 (60) 92.1 0.20 Amox–Clav, amoxicill in–clavulanic acid; TMP–SMX, trimethoprim–sulfamethoxazole; NA, not applicable. p -Value reports significant difference between any percentages. a p -value < 0.05 between 2011 and 2012.
rate was found to be 29.2% in the present study. The mean imipenemsusceptibilityofK.pneumoniaewas98%.
ConcerningAcinetobacter,an80%susceptibilityrateto imipe-nemwasreportedin2010/11fromAUBMC.10Thedataofthepresent study revealed a marked decrease in the rate of Acinetobacter susceptibilitytoimipenem,from49%in2011to15%in2013. Aci-netobactersusceptibilitytocolistinwas83%inthisstudy.Afew hospitals reported susceptibility to tigecycline, with a mean of 58.3%; only one hospital reported tigecycline susceptibility in 2011.Therewasanappreciabledropintigecyclinesusceptibility from100%in2011to39.6%in2013.Thiscouldsuggestoutbreak patternsinsomeofthesehospitals;outbreakscaneasilybecaused by this organism. In addition, these hospitals were probably overusingtigecyclinebecauseofprioroutbreaks.Itisalsoimportant tonotethatsomehospitalsonlyreportedA.baumannii,soitislikely thatthe meanvaluereported has shiftedtowards A. baumannii
susceptibilities. Previous studies investigating the basis of the carbapenemresistanceof multidrug-resistantA. baumanniihave
foundtheresistancetoberelatedtotheproductionof carbapenem-hydrolyzing oxacillinase OXA-58 encoded by a plasmid-borne gene.22,23Suchdatawerenotavailable fromthehospitalsinthe presentstudy.
With regard to Pseudomonas species, high and variable multidrugresistancerateshavebeenreported.12Mouawadetal. showed a trend of increasing resistance of P.aeruginosa to all antimicrobialsin2006and2009,withthehighestresistancebeing to ciprofloxacin (33%).24 In the present study, Pseudomonas susceptibilitytoimipenem and ciprofloxacinwas73% and 77%, respectively,lessthantherespectiveratesof80%and83%reported previously.10,24Anincreaseincarbapenemresistancewasnotedin the present study, while susceptibility to ceftazidime and piperacillin–tazobactam was maintained at around 80% and to aztreonam at around 75%. Of note, most hospitals reported P. aeruginosa only, but others reported all Pseudomonas species. ImipenemresistancewasreportedmoreintheBeirutarea,which could be a result of the increased use of carbapenems as a
Table6
SusceptibilityrateofAcinetobactersppandPseudomonassppobtainedfrom16Lebanesehospitals. Percentagesusceptibilitytotheantimicrobialagents(numberofisolates)
Acinetobacterspp Pseudomonasspp
2011(242) 2012(1704) 2013(1463) p-Value Allyears (3343)
2011(1105) 2012(3294) 2013(3498) p-Value Allyears (7897) Pip–Taz 30.6(242) 11.8(1704) 11.1(1397) <0.05a 12.9 80.5(1105) 78.1(3294) 80.7(3498) <0.05b 79.6 Ceftazidime 24.7(242) 11.6(1704) 10.0(1397) <0.05a 11.8 78.4(1105) 81.4(3294) 83.3(3498) <0.05a 81.8 Cefepime 30.5(242) 11.8(1704) 12.5(1463) <0.05a 13.4 78.7(1105) 82.6(3294) 84.3(3498) <0.05a 82.8 Aztreonam 17.0(219) 3.4(1242) 9.0(855) <0.05a,b 6.7 71.5(1059) 76.2(3173) 77.9(3251) <0.05a 76.3 Imipenem 49.2(242) 15.2(1704) 15.1(1463) <0.05a 17.6 79.6(1105) 70.9(3294) 72.5(3498) <0.05a 72.8 Gentamicin 42.4(242) 17.8(1692) 15.5(1450) <0.05a 18.6 81.9(1105) 82.5(3210) 82.7(3407) 0.673 82.5 Amikacin 33.3(228) 14.0(1704) 15.4(1397) <0.05a 15.9 89.2(883) 87.1(3294) 90.5(3498) <0.05b 88.9 TMP–SMX 35.5(228) 17.2(1440) 15.3(1231) <0.05a 17.8 Ciprofloxacin 24.0(242) 10.6(1704) 10.5(1433) <0.05a 11.5 75.5(1105) 74.8(3294) 80.3(3498) <0.05b 77.3 Colistin N/A 77.1(552) 95.6(254) <0.05b 82.9
Pip–Taz,piperacillin–tazobactam;TMP–SMX,trimethoprim–sulfamethoxazole.
p-Valuereportssignificantdifferencebetweenanypercentages.
a
p-value<0.05between2011and2012.
b
p-value<0.05between2012and2013.
Table5
SusceptibilityrateofEscherichiacoliandKlebsiellasppobtainedfrom16Lebanesehospitals Percentagesusceptibilitytotheantimicrobialagents(numberofisolates)
Escherichiacoli Klebsiellaspp
2011(4035) 2012(12003) 2013(14373) p-Value Allyears (30411)
2011(963) 2012(3222) 2013(3698) p-Value Allyears (7883) Ampicillin 29.1(1737) 23.6(8704) 22.6(12544) <0.05a,b 23.1 0.0(227) 0.0(1973) 0.0(2366) 0 Amox–Clav 66.7(4035) 63.3(12003) 58.5(14373) <0.05a,b 61.4 71.1(963) 68.2(3222) 64.6(3698) <0.05a,b 66.8 Pip–Taz 89.2(3466) 86.8(11437) 78.9(13836) <0.05a,b 83.3 83.4(872) 80.7(3147) 79.5(3599) <0.05a,b 80.5 Cefoxitin 82.7(2306) 88.7(10917) 86.8(10635) <0.05a,b 87.3 81.0(467) 88.0(2754) 90.4(2632) <0.05a,b 88.5 Cefuroxime 69.5(3591) 62.0(11572) 57.3(9499) <0.05a,b 59.2 71.4(794) 63.1(3074) 63.9(2648) <0.05a 64.4
Cefotaxime 73.6(1390) 66.1(8569) 61.5(10100) <0.05a,b 64.3 75.9(240) 65.0(2113) 63.6(2397) <0.05a,b 64.8
Ceftazidime 75.6(3591) 70.5(11572) 69.1(13567) <0.05a,b 70.5 78.9(794) 70.3(3074) 68.7(3467) <0.05a,b 70.5 Cefixime 77.8(821) 66.5(5844) 68.7(5798) <0.05a,b 68.3 Cefepime 85.2(2278) 70.8(11006) 74.1(13030) <0.05a,b 73.7 Aztreonam 75.5(2847) 63.3(10807) 66.7(13567) <0.05a,b 66.3 80.3(679) 66.7(2938) 68.3(3403) <0.05a,b 68.8 Imipenem 99.5(4035) 99.3(12003) 99.2(14373) 0.145 99.3 98.6(963) 98.6(3222) 97.3(3698) <0.05b 98 Gentamicin 66.7(4035) 72.7(11491) 72.2(13801) <0.05a,b 71.7 68.8(963) 75.2(3089) 75.6(3549) <0.05a 74.6 Amikacin 96.7(3291) 97.5(12003) 97.0(14373) <0.05a 97.2 94.2(848) 96.7(3222) 95.1(3698) <0.05a,b 95.7 TMP–SMX 49.4(4035) 48.0(12003) 49.8(13651) <0.05a,b 49 54.5(963) 58.1(3222) 55.8(3524) <0.05a,b 56.6 Ciprofloxacin 57.4(3035) 57.0(12003) 52.0(14373) <0.05b 54.7 72.2(963) 71.8(3222) 73.1(3698) 0.372 72.5 Nitrofurantoin 95.4(2306) 96.6(7406) 95.6(8710) <0.05a,b 96 61.6(467) 54.1(1789) 48.4(2100) <0.05a,b 52.2 Tigecycline 100(821) 97.3(3795) 98.5(5100) <0.05a,b 98.2 100(149) 84.9(883) 86.9(1211) <0.05a,b 87 ESBLproductionrate 32 30.8 33.6 <0.05a,b 32.3 30.2 28.1 29.9 0.191 29.2
Amox–Clav,amoxicillin–clavulanicacid;Pip–Taz,piperacillin–tazobactam;TMP–SMX,trimethoprim–sulfamethoxazole;ESBL,extended-spectrumbeta-lactamase.
p-Valuereportssignificantdifferencebetweenanypercentages.
a p-value<0.05between2011and2012. b
consequenceoftheriseinESBL-producingpathogensoverthepast few years in Lebanon. In addition,ciprofloxacin resistance was stableataround23%duringthestudyperiod.
There are some limitations to this study, mainly the biases associatedwithpatientpresentationtohealthcare(oftenpatients with prior treatment failure or complicated medical histories), patient samplingpractices, and testpractices. The main,largest hospitalsreportedtheresultsbypatient,avoidingduplicateisolates. Afewhospitalswereunabletodothis.However,the numberof isolatesreportedbytheselattercentreswaslow,withthislimitation outweighedbythebenefitofinclusionofthecentrestoprovidea nationwide perspective.A furtherlimitation is that,while most hospitals reported the bacterial susceptibility for inpatient and outpatientculturestogether,onehospitalreportedonly suscepti-bility for inpatient specimen cultures. Even for the hospitals reporting cultures from outpatients, the data obtained did not showpriorrecentadmissionstothehospitalorcontactwithrecently hospitalizedpatients.Thisisexpectedinanon-clinicalstudysuchas theonepresentedhere.Thislimitationisconsiderednottohave considerablyaffectedtheresults,sinceacomparisonofinpatients andoutpatientswasnotdone.Anotherlimitationisthedifferent antibioticsusceptibility methods used in the differenthospitals (Table 3). With regard to the use of European Committee for AntimicrobialSusceptibilityTesting(EUCAST)andCLSIguidelines fortheinterpretationofresistance,EUCASThaspublishedguidelines fortheperformanceandinterpretationofantibioticsusceptibility testingandhasencouragedachangeintheantibioticsusceptibility testingsystemstofacilitate the comparison of results.TheCLSI updateditsrecommendationsfortheinterpretationofinvitrodrug susceptibilitytesting results in their 2010 and 2011guidelines, basedonclinicaldata,pharmacokinetic–pharmacodynamic prop-erties,andminimalinhibitoryconcentrationdistributions,inpart adoptingtheEUCASTstrategies.25Sincethepresentstudyperiod extended from 2011 to 2013, the differences in interpretation betweenthetworecommendationswereconsideredminimal;the majorityofLebanesehospitalswereusingtheCLSIguidelines.26,27In addition,itisimportanttonotethatthedifferencesbetweenthe EUCASTandCLSIsystemsafter 2011affect mostlyintermediate resistanceratherthansusceptibilityorresistance.Finally,themean susceptibilitiesofallbacteriaarepresentedinrelationtothenumber ofisolatestested,asmentionedinallofthetables.However,mostof thestandardantimicrobialsusedindeterminingthesusceptibility patternswerereported.
Inspiteoftheselimitations,thedatareflectthenationalpattern inanacceptableway.Theyaretheonlynationallycompileddata availabletodateandconstituteaplatformforthefuture.
It is concluded that antimicrobial resistance is becoming a majorprobleminLebanon.MRSA,penicillin-and erythromycin-resistantS.pneumoniae,anddifferentiallyresistant Enterobacter-iaceae,Pseudomonas,andAcinetobacterareallimportantthreats totheLebanese population.Astrategicplanisneeded.Thefirst stepwillbe toestablisha proper surveillancesystemafter the standardizationofmicrobiologicalmethods.Thisstudyprovides datathatcouldassistcliniciansintheirdailypracticeandthatmay helpinestablishingpreventionandtreatmentguidelines.Finally theresultsofthisstudycouldhelpdirectfurtherresearcheffortsin thefuture.
Funding:None.
Conflictofinterest:None.
References
1.CentersforDiseaseControlandPrevention(CDC).Antibioticresistancethreats
intheUnitedStates.Atlanta,GA:CDC;2013.
2.ZowawiHM,BalkhyHH,WalshTR,PatersonDL.b-Lactamaseproductioninkey
Gram-negativepathogenisolatesfromtheArabianPeninsula.ClinMicrobiolRev
2013;26:361–80.
3.SosaA,ByarugabaD,Amabile-CuevasC,HsuehP,KariukiS,OkekeI.
Antimi-crobialResistanceinDevelopingCountries.NewYork,NY:Springer;2010.
4.SkovR,LarsenAR,KearnsA,HolmesM,TealeC,EdwardsG,etal.Phenotypic
detectionofmecC-MRSA:cefoxitinismorereliablethanoxacillin.JAntimicrob
Chemother2014;69:133–5.
5.DrieuxL,BrossierF,SougakoffW,JarlierV.Phenotypicdetectionof
extended-spectrum b-lactamaseproductionin Enterobacteriaceae:review andbench
guide.ClinMicrobiolInfect2008;14:90–103.
6.ArajGF, Uwaydah MM,Alami SY.Antimicrobialsusceptibility patterns of
bacterialisolatesattheAmericanUniversityMedicalCenterinLebanon.Diagn
MicrobiolInfectDis1994;20:151–8.
7.BadawiH,SaadDiabM,ElSaidM.Impactofantibioticpolicyinatertiarycare researchinstitutehospitalinEgypt:threeyearsexperience.IntJInfectContr
2007;3.http://dx.doi.org/10.3396/03-01-10-07
8.NimmoGR,PearsonJC,CollignonPJ,ChristiansenKJ,CoombsGW,BellJM,etal.
AustralianGrouponAntimicrobialResistance.Antimicrobialsusceptibilityof
Staphylococcusaureusisolatedfromhospitalinpatients,2009:reportfromthe
Australian Group on Antimicrobial Resistance. Commun Dis Intell Q Rep
2011;35:237–43.
9.BorgMA,deKrakerM,SciclunaE,vandeSande-BruinsmaN,TiemersmaE,
Monen J, etal.ARMedProject Membersand Collaborators.Prevalence of
methicillin-resistantStaphylococcusaureus(MRSA)ininvasiveisolatesfrom
southern and eastern Mediterranean countries. J Antimicrob Chemother
2007;60:1310–5.
10.ArajGF,AvedissianAZ,AyyashNS,BeyHA,ElAsmarRG,HammoudRZ,etal.A
reflectiononbacterialresistancetoantimicrobialagentsatamajortertiarycare
centerinLebanonoveradecade.JMedLiban2012;60:125–35.
11.UwaydahM,JradehM,ShihabZ.Antimicrobialresistanceofclinicalisolatesof
StreptococcuspneumoniaeinLebanon.JAntimicrobChemother1996;38:283–6.
12.ShaarTJ,Al-HajjarR.Antimicrobialsusceptibilitypatternsofbacteriaatthe
MakassedGeneralHospitalinLebanon.IntJAntimicrobAgents2000;14:161–4.
13.DaoudZ,CocozakiA,HakimeN.Antimicrobialsusceptibilitypatternsof
Hae-mophilusinfluenzaeandStreptococcuspneumoniaeisolatesinaBeirutgeneral
universityhospitalbetween2000and2004.ClinMicrobiolInfect 2006;12:
86–90.
14.DaoudZ1,KouraniM,SaabR,NaderMA,HajjarM.ResistanceofStreptococcus
pneumoniaeisolatedfromLebanesepatientsbetween2005and2009.RevEsp Quimioter2011;24:84–90.
15.BorgMA,TiemersmaE,SciclunaE,vandeSande-BruinsmaN,deKrakerM,
MonenJ, etal.,ARMed Projectmembersandcollaborators. Prevalence of
penicillinanderythromycinresistanceamonginvasiveStreptococcus
pneumo-niaeisolatesreportedbylaboratoriesinthesouthernandeastern
Mediterra-neanregion.ClinMicrobiolInfectDis2009;15:232–7.
16.EidAJ,BerbariEF.TheemergenceofantibioticresistanceinLebanon:reality
checkandcallforaction.JMedLiban2013;61:125–6.
17.CentersforDiseaseControlandPrevention.Effectsofnewpenicillin
suscepti-bilitybreakpointsforStreptococcuspneumoniae—UnitedStates,2006–2007.
MorbMortalWklyRep2008;57:1353–5.
18.MatarGM,JaafarR,SabraA,HartCA,CorkillJE,DbaiboGS,etal.Firstdetection
and sequenceanalysisof thebla-CTX-M-15 genein Lebanese isolatesof
extended-spectrum-b-lactamase-producingShigellasonnei.AnnTropMed
Para-sitol2007;101:511–7.
19.SabraAH,ArajGF,KattarMM,Abi-RachedRY,KhairallahMT,KlenaJD,etal.
Molecular characteristics of ESBL-producing Shigella sonnei isolates from
patientswithbacillarydysenteryinLebanon.JInfectDevCtries2009;3:300–5.
20.DaoudZ,HakimeN.Prevalenceandsusceptibilitypatternsofextended-spectrum
betalactamase-producingEscherichiacoliandKlebsiellapneumoniaeinageneral
universityhospitalinBeirut,Lebanon.RevEspQuimioter2003;16:233–8.
21.DaoudZ,AfifC.EscherichiacoliisolatedfromurinarytractinfectionsofLebanese patientsbetween2000and2009:epidemiologyandprofiles ofresistance.
Chemother Res Pract 2011;2011:6. http://dx.doi.org/10.1155/2011/218431. ArticleID218431.
22.ZarrilliR,VitaleD,DiPopoloA,BagattiniM,DaoudZ,KhanAU,etal.A
plasmid-borneblaOXA-58geneconfersimipenemresistancetoAcinetobacterbaumannii
isolatesfromaLebanesehospital.AntimicrobAgentsChemother2008;52:4115–20.
23.GiannouliM,TomasoneF,AgodiA,VahabogluH,DaoudZ,TriassiM,etal.
Molecular epidemiology of carbapenem-resistant Acinetobacter baumannii
strainsinintensivecareunitsofmultipleMediterraneanhospitals.JAntimicrob
Chemother2009;63:828–30.
24.MouawadR,AfifC,AzarE,DahdouhE,MasriK,IraniJ,etal.Effectofantibiotic
consumptiononresistanceofPseudomonasaeruginosaisolatedfromLebanese
patientswithemphasisonMBLproduction.AdvMicrobiol2013;3:382–8.
25.HombachM,BloembergGV,Bo¨ttgerEC.Effectsofclinicalbreakpointchangesin CLSIguidelines2010/2011andEUCASTguidelines2011onantibiotic suscep-tibility test reporting of Gram-negative bacilli. J Antimicrob Chemother
2012;67:622–32.http://dx.doi.org/10.1093/jac/dkr524.Epub2011Dec13.
26.ClinicalandLaboratoryStandardsInstitute.Performancestandardsfor
antimi-crobialsusceptibilitytesting:twentiethinformationalsupplementM100-S20.
Wayne,PA:CLSI;2010.
27.ClinicalandLaboratoryStandardsInstitute.Performancestandardsfor
antimi-crobialsusceptibilitytesting:twenty-firstinformationalsupplement