Computing Services for Scientific Computing
Simon Ostermann1, Alexandru Iosup2, Nezih Yigitbasi2, Radu Prodan1, Thomas Fahringer1, and Dick Epema2
1 University of Innsbruck, Austria
[email protected],[email protected],[email protected] 2 Delft University of Technology, The Netherlands
[email protected],[email protected],[email protected]
Abstract. Cloud Computing is emerging today as a commercial infras-tructure that eliminates the need for maintaining expensive computing hardware. Through the use of virtualization, clouds promise to address with the same shared set of physical resources a large user base with dif-ferent needs. Thus, clouds promise to be for scientists an alternative to clusters, grids, and supercomputers. However, virtualization may induce significant performance penalties for the demanding scientific computing workloads. In this work we present an evaluation of the usefulness of the current cloud computing services for scientific computing. We analyze the performance of the Amazon EC2 platform using micro-benchmarks and kernels.While clouds are still changing, our results indicate that the current cloud services need an order of magnitude in performance im-provement to be useful to the scientific community.
1
Introduction
Scientific computing requires an ever-increasing number of resources to deliver results for growing problem sizes in a reasonable time frame. In the last decade, while the largest research projects were able to afford expensive supercomputers, other projects were forced to opt for cheaper resources such as commodity clus-ters and grids. Cloud computing proposes an alternative in which resources are no longer hosted by the researcher’s computational facilities, but leased from big data centers only when needed. Despite the existence of several cloud computing vendors, such as Amazon [4] and GoGrid [13], the potential of clouds remains largely unexplored. To address this issue, in this paper we present a performance analysis of cloud computing services for scientific computing.
The cloud computing paradigm holds good promise for the performance-hungry scientific community. Clouds promise to be a cheap alternative to super-computers and specialized clusters, a much more reliable platform than grids, and a much more scalable platform than the largest of commodity clusters or resource pools. Clouds also promise to “scale by credit card,” that is, scale up immediately and temporarily with the only limits imposed by financial reasons,
D.R. Avresky et al. (Eds.): Cloudcomp 2009, LNICST 34, pp. 115–131, 2010. c
Table 1.A selection of cloud service providers. VM stands for virtual machine, S for storage.
Service type Examples
VM,S Amazon (EC2 and S3), Mosso (+CloudFS), ... VM GoGrid, Joyent, infrastructures based on Condor
Glide-in [28]/Globus VWS [12]/Eucalyptus [21], ... S Nirvanix, Akamai, Mozy, ...
non-IaaS 3Tera, Google AppEngine, Sun Network, ...
as opposed to the physical limits of adding nodes to clusters or even supercom-puters or to the financial burden of over-provisioning resources. However, clouds also raise important challenges in many areas connected to scientific computing, including performance, which is the focus of this work.
An important research question arises:Is the performance of clouds sufficient for scientific computing?Though early attempts to characterize clouds and other virtualized services exist [33,10,23,29], this question remains largely unexplored. Our main contribution towards answering it is:
1. We evaluate the performance of the Amazon Elastic Compute Cloud (EC2), the largest commercial computing cloud in production (Section 3);
2. We assess avenues for improving the current clouds for scientific comput-ing; this allows us to propose two cloud-related research topics for the high performance distributed computing community (Section 4).
2
Amazon EC2
We identify three categories of cloud computing services: Infrastructure-as-a-Service (IaaS), that is, raw infrastructure and associated middleware, Platform-as-a-Service (PaaS), that is, APIs for developing applications on an abstract platform, and Software-as-a-Service (SaaS), that is, support for running software services remotely. The scientific community has not yet started to adopt PaaS or SaaS solutions, mainly to avoid porting legacy applications and for lack of the needed scientific computing services, respectively. Thus, in this study we are focusing on IaaS providers.
Unlike traditional data centers, which lease physical resources, most clouds lease virtualized resources which are mapped and run transparently to the user by the cloud’s virtualization middleware on the cloud’s physical resources. For example, Amazon EC2 runs instances on its physical infrastructure using the open-source virtualization middleware Xen [7]. By using virtualized resources a cloud can serve with the same set of physical resources a much broader user base; configuration reuse is another reason for the use of virtualization. Scientific software, compared to commercial mainstream products, is often hard to install and use [8]. Pre- and incrementally-built virtual machine (VM) images can be run on physical machines to greatly reduce deployment time for software [20].
Table 2.The Amazon EC2 instance types. The ECU is the CPU performance unit defined by Amazon.
Name ECUs RAM Archi I/O Disk Cost Reserve Reserved Cost (Cores) [GB] [bit] Perf. [GB] [$/h] [$/y], [$/3y] [$/h] m1.small 1 (1) 1.7 32 Med 160 0.1 325, 500 0.03 m1.large 4 (2) 7.5 64 High 850 0.4 1300, 2000 0.12 m1.xlarge 8 (4) 15.0 64 High 1690 0.8 2600, 4000 0.24 c1.medium 5 (2) 1.7 32 Med 350 0.2 650, 1000 0.06 c1.xlarge 20 (8) 7.0 64 High 1690 0.8 2600, 4000 0.24
Many clouds already exist, but not all provide virtualization, or even comput-ing services. Table 1 summarizes the characteristics of several clouds currently in production; of these, Amazon is the only commercial IaaS provider with an infrastructure size that can accommodate entire grids and parallel production infrastructures (PPI) workloads.
EC2 is an IaaS cloud computing service that opens Amazon’s large com-puting infrastructure to its users. The service is elastic in the sense that it enables the user to extend or shrink his infrastructure by launching or terminat-ing new virtual machines (instances). The user can use any of the fiveinstance typescurrently available on offer, the characteristics of which are summarized in Table 2. An ECU is the equivalent CPU power of a 1.0-1.2 GHz 2007 Opteron or Xeon processor. The theoretical peak performance can be computed for different instances from the ECU definition: a 1.1 GHz 2007 Opteron can perform 4 flops per cycle at full pipeline, which means at peak performance one ECU equals 4.4 gigaflops per second (GFLOPS). Instances can be reserved in advanced for one or three years per location which results in a lower hourly cost letting user with long usage periods benefit in a subscription way.
To create an infrastructure from EC2 resources, the user first requires the launch of one or several instances, for which he specifies the instance type and the VM image; the user can specify any VM image previously registered with Amazon, including Amazon’s or the user’s own. Once the VM image has been transparently deployed on a physical machine (the resource status isrunning), the instance is booted; at the end of the boot process the resource status be-comesinstalled. The installed resource can be used as a regular computing node immediately after the booting process has finished, via an ssh connection. A maximum of 20 instances can be used concurrently by regular users; an appli-cation can be made to increase this limit. The Amazon EC2 does not provide job execution or resource management services; a cloud resource management system can act as middleware between the user and Amazon EC2 to reduce re-source complexity. Amazon EC2 abides by a Service Level Agreement in which the user is compensated if the resources are not available for acquisition at least 99.95% of the time, 365 days/year. The security of the Amazon services has been investigated elsewhere [23].
Table 3.The benchmarks used for cloud performance evaluation. B, FLOP, U, MS, and PS stand for bytes, floating point operations, updates, makespan, and per second, respectively. The other acronyms are described in the text.
Type Suite/Benchmark Resource Unit
SJSI lmbench/all Many Many
SJSI Bonnie/all Disk MBps
SJSI CacheBench/all Memory MBps SJMI HPCC/HPL CPU, float GFLOPS SJMI HPCC/DGEMM CPU, double GFLOPS SJMI HPCC/STREAM Memory GBps SJMI HPCC/RandomAccess Network MUPS SJMI HPCC/beff Memory µs, GBps
3
Cloud Performance Evaluation
In this section we present a performance evaluation of cloud computing services for scientific computing.
3.1 Method
We design a performance evaluation method, that allows an assessment of clouds. To this end, we divide the evaluation procedure into two parts, the first cloud-specific, the second infrastructure-agnostic.
Cloud-specific evaluation.An attractive promise of clouds is that there are always unused resources, so that they can be obtained at any time without addi-tional waiting time. However, the load of other large-scale systems (grids) varies over time due to submission patterns; we want to investigate if large clouds can indeed bypass this problem. Thus, we test the duration of resource acquisition and release over short and long periods of time. For the short-time periods one or more instances of the same instance type are repeatedly acquired and re-leased during a few minutes; the resource acquisition requests follow a Poisson process with arrival rate λ= 1s. For the long periods an instance is acquired then released every 2 min over a period of one week, then hourly averages are aggregated from the 2-minutes samples taken over a period of one month. Infrastructure-agnostic evaluation. There currently is no single accepted benchmark for scientific computing at large-scale. In particular, there is no such benchmark for the common scientific computing scenario in which an infras-tructure is shared by several independent jobs, despite the large performance losses that such a scenario can incur [5]. To address this issue, our method both uses traditional benchmarks comprising suites of jobs to be run in isolation and replays workload traces taken from real scientific computing environments.
We design two types of test workloads: SJSI/MJSI–run one or more single-process jobs on a single instance (possibly with multiple cores) and SJMI–run a
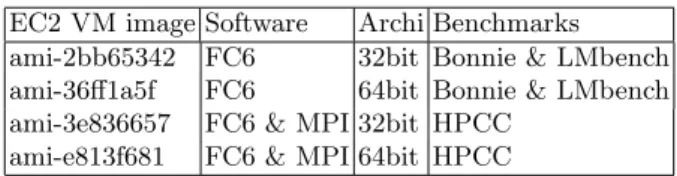
Table 4.The EC2 VM images. FC6 stands for Fedore Core 6 OS (Linux 2.6 kernel). EC2 VM image Software Archi Benchmarks
ami-2bb65342 FC6 32bit Bonnie & LMbench ami-36ff1a5f FC6 64bit Bonnie & LMbench ami-3e836657 FC6 & MPI 32bit HPCC
ami-e813f681 FC6 & MPI 64bit HPCC
single multi-process jobs on multiple instances. The SJSI, MJSI, and SJMI work-loads all involve executing one or more from a list of four open-source bench-marks: LMbench [17], Bonnie [9], CacheBench [18], and the HPC Challenge Benchmark (HPCC) [15]. The characteristics of the used benchmarks and the mapping to the test workloads are summarized in Table 3.
Performance metrics.We use the performance metrics defined by the bench-marks used in this work. We also define and use theHPL efficiency for a real virtual cluster based on instance typeTas the ratio between the HPL benchmark performance of the cluster and the performance of a real environment formed with only one instance of same type, expressed as a percentage.
3.2 Experimental Setup
We now describe the experimental setup in which we use the performance eval-uation method presented earlier.
Environment. We perform all our measurements on the EC2 environment. However, this does not limit our results, as there are sufficient reports of per-formance values for all the Single-Job benchmarks, and in particular for the HPCC [2] to compare our results with. For our experiments we build homoge-neous environments with 1 to 128 cores based on the five EC2 instance types.
Amazon EC2 offers a wide range of ready-made machine images. In our ex-periments, we used the images listed in Table 4 for the 32 and 64 bit instances; all VM images are based on a Fedora Core 6 OS with Linux 2.6 kernel. The VM images used for the HPCC benchmarks also have a working pre-configured MPI based on thempich2-1.0.5[31] implementation.
Optimizations, tuning.The benchmarks were compiled using GNU C/C++ 4.1 with the -O3 -funroll-loops command-line arguments. We did not use any additional architecture- or instance-dependent optimizations. For the HPL benchmark, the performance results depend on two main factors: the Basic Lin-ear Algebra Subprogram (BLAS) [11] library, and the problem size. We used in our experiments the GotoBLAS [30] library, which is one of the best portable solutions freely available to scientists. Searching for the problem size that can deliver peak performance is extensive (and costly); instead, we used a free math-ematical problem size analyzer [3] to find the problem sizes that can deliver results close to the peak performance: five problem sizes ranging from 13,000 to 55,000.
0 20 40 60 80 100 120 140 160 180 200
m1.small m1.large m1.xlarge
c1.medium c1.xlarge m1.small m1.large m1.xlarge
c1.medium c1.xlarge m1.small m1.large m1.xlarge
c1.medium c1.xlarge m1.small m1.large m1.xlarge
c1.medium c1.xlarge
Duration [s]
Total Time for Res. Acquisition
VM Boot Time for Res. Acquisition VM Deployment Time
for Res. Acquisition
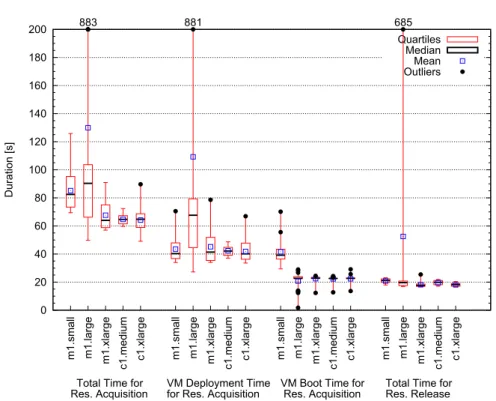
Total Time for Res. Release 883 881 685 Quartiles Median Mean Outliers
Fig. 1.Resource acquisition and release overheads for acquiring single instances 3.3 Experimental Results
The experimental results of the Amazon EC2 performance evaluation are pre-sented in the following.
Resource Acquisition and Release.We study three resource acquisition and release scenarios: for single instances over a short period, for multiple instances over a short period, and for single instances over a long period of time.
Single instances.We first repeat 20 times for each of the five instance types a resource acquisition followed by a release as soon as the resource status becomes installed (see Section 2). Figure 1 shows the overheads associated with resource acquisition and release in EC2. The total resource acquisition time (Total) is the sum of theInstall andBoot times. TheRelease time is the time taken to release the resource back to EC2; after it is released the resource stops being charged by Amazon. Thec1.*instances are surprisingly easy to obtain; in contrast, the m1.*instances have for the resource acquisition time higher expectation (63-90s compared to around 63s) and variability (much larger boxes). With the exception of the occasional outlier, both the VM Boot and Release times are stable and represent about a quarter ofTotal each.
Multiple instances.We investigate next the performance of requesting the ac-quisition of multiple resources (2,4,8,16, and 20) at the same time; this
0 20 40 60 80 100 120 2 4 8 16 20 2 4 8 16 20 2 4 8 16 20 2 4 8 16 20 Duration [s]
Instance Count Instance Count Instance Count Instance Count
Total Time for Res. Acquisition
VM Boot Time for Res. Acquisition VM Deployment Time
for Res. Acquisition
Total Time for Res. Release Quartiles
Median Mean Outliers
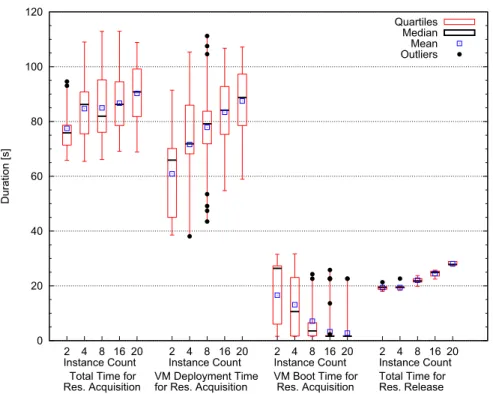
Fig. 2.Instance resource acquisition and release overheads when acquiring multiple c1.xlargeinstances at the same time
corresponds to the real-life scenario where a user would create a homogeneous cluster from Amazon EC2 resources. When resources are requested in bulk, we record acquisition and release times for each resource in the request, sep-arately. Figure 2 shows the basic statistical properties of the times recorded for
c1.xlarge instances. The expectation and the variability are both higher for
multiple instances than for a single instance.
Long-term investigation. Last, we discuss the Install time measurements published online by the independent CloudStatus team [1]. We have written web crawlers and parsing tools and taken samples every two minutes between Aug 2008 and Nov 2008 (two months). We find that the time values fluctuate within the expected range (expected value plus or minus the expected variabil-ity). We conclude that in Amazon EC2 resources can indeed be provisioned without additional waiting time due to system overload.
Performance of SJSI Workloads. In this set of experiments we measure the raw performance of the CPU, I/O, and memory hierarchy using the Single-Instance benchmarks listed in Section 3.1.
Compute performance.We assess the computational performance of each in-stance type using the entire LMbench suite. The performance of int and int64
0 2 4 6 8 10
m1.small m1.large m1.xlarge c1.medium c1.xlarge
Performance [GOPS]
Instance Type
INT-bit INT-add INT-mul INT64-bit INT64-mul
0 0.2 0.4 0.6 0.8 1
m1.small m1.large m1.xlarge c1.medium c1.xlarge
Performance [GOPS] Instance Type FLOAT-add FLOAT-mul FLOAT-bogo DOUBLE-add DOUBLE-mul DOUBLE-bogo
Fig. 3.LMbench results. The Performance of 32- and 64-bit integer operations in giga-operations per second (GOPS) (top), and of floating operations with single and double precision (bottom)
operations, and of the float and double float operations is depicted in Figure 3 top and bottom, respectively.The GOPS recorded for the floating point and double operations is 6−8×lower than the theoretical maximum of ECU (4.4 GOPS).
0 200 400 600 800 1000 1200 1400
1024KiB 2MiB 5MiB 10MiB 20MiB 50MiB 100MiB 500MiB 1000MiB 2GiB 5GiB
Rewrite Bonnie benchmark Sequential Output [MBps]
Test File Size
c1.xlarge c1.medium m1.xlarge m1.large m1.small
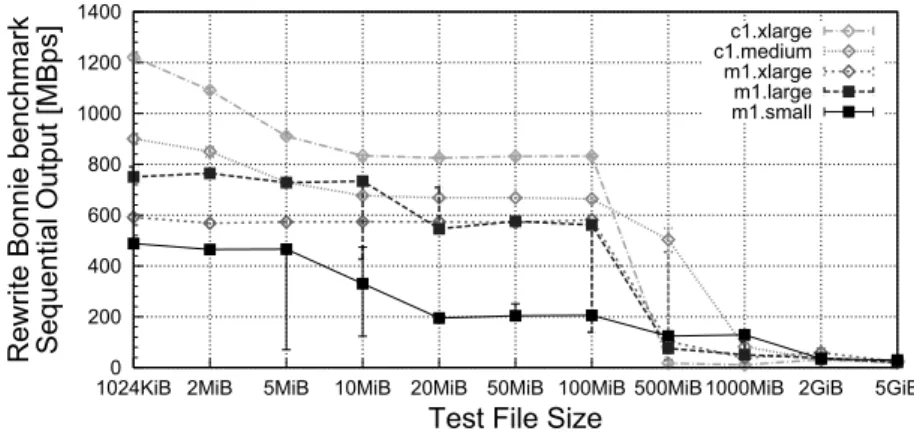
Fig. 4.The results of the Bonnie Rewrite benchmark. The performance drop indicates the capacity of the memory-based disk cache.
Table 5.The I/O performance of the Amazon EC2 instance types and of 2002 [14] and 2007 [6] systems
Seq. Output Seq. Input Rand. Instance Char Block Rewrite Char Block Input Type [MB/s] [MB/s] [MB/s] [MB/s] [MB/s] [Seek/s] m1.small 22.37 60.18 33.27 25.94 73.46 74.4 m1.large 50.88 64.28 24.40 35.92 63.20 124.3 m1.xlarge 56.98 87.84 33.35 41.18 74.51 387.9 c1.medium 49.15 58.67 32.80 47.43 74.95 72.4 c1.xlarge 64.85 87.82 29.96 44.98 74.46 373.9 ’02 Ext3 12.24 38.75 25.66 12.67 173.68 -’02 RAID5 14.45 14.32 12.19 13.50 73.03 -’07 RAID5 30.88 40.63 29.03 41.91 112.69 192.9
important for scientific computing, is mixed: excellent addition but poor multipli-cation capabilities. Thus, as many scientific computing applimultipli-cations use heavily both of these operations, the user is faced with the difficult problem of selecting between two choices where none is optimal. Finally, several floating and double point operations take longer onc1.mediumthan onm1.small.
I/O performance.We assess the I/O performance of each instance type with the Bonnie benchmarks, in two steps. The first step is to determine the smallest file size that invalidates the memory-based I/O cache, by running the Bonnie suite for thirteen file sizes in the range 1024 Kilo-binary byte (KiB) to 40 GiB. Figure 4 depicts the results of the rewrite with sequential output benchmark, which involves sequences of read-seek-write operations of data blocks that are dirtied before writing. For all instance types, a performance drop begins with the 100MiB test file and ends at 2GiB, indicating a capacity of the memory-based disk cache of 4-5GiB (twice 2GiB). Thus, the results obtained for the file sizes
0 5000 10000 15000 20000 25000 30000 35000 40000 210 215 220 225 230 Performance [MBps] Working Set [B] 32KB 1MB m1.small m1.large m1.xlarge c1.medium c1.xlarge
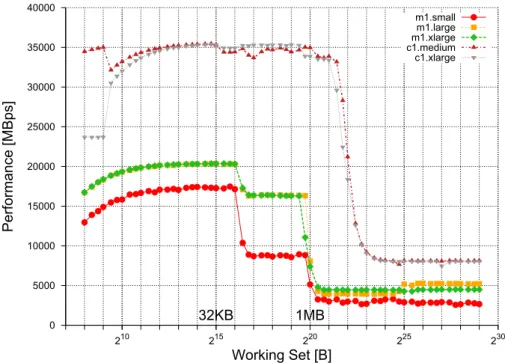
Fig. 5. CacheBench Rd-Mod-Wr benchmark results, one benchmark process per instance
above 5GiB correspond to the real I/O performance of the system; lower file sizes would be served by the system with a combination of memory and disk opera-tions. We analyze the I/O performance obtained for files sizes above 5GiB in the second step; Table 5 summarizes the results. We find that the I/O performance indicated by EC2 (see Table 2) corresponds to the achieved performance for ran-dom I/O operations (column ’Rand. Input’ in Table 5). The*.xlargeinstance types have the best I/O performance from all instance types. For the sequen-tial operations more typical to scientific computing all EC2 instance types have in general better performance when compared with similar modern commodity systems, such as the systems described in the last three rows in Table 5. Memory hierarchy performance. We test the performance of the memory hierarchy using CacheBench on each instance type. Figure 5 depicts the perfor-mance of the memory hierarchy when performing the Rd-Mod-Wr benchmark with 1 benchmark process per instance. Thec1.*instances perform very similar, almost twice as good as the next performance group formed bym1.xlargeand
m1.large; them1.smallinstance is last with a big performance gap for working
sets of 217–219B. We find the memory hierarchy sizes by extracting the major
performance drop-offs. The visible L1/L2 memory sizes are 64KB/1MB for the m1.*instances; thec1.*instances have only one performance drop point around 2MB (L2). Looking at the other results (not shown), we find that L1c1.*is only 32KB. For the Rd and Wr unoptimized benchmarks we have obtained similar
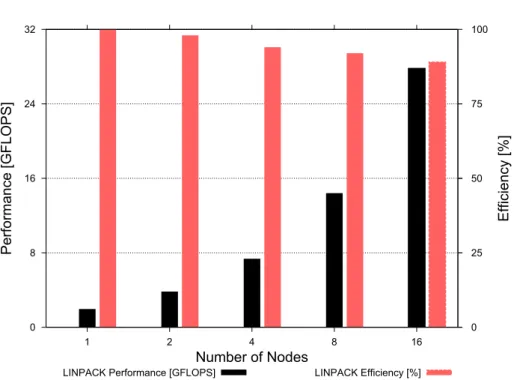
0 8 16 24 32 1 2 4 8 16 0 25 50 75 100 Performance [GFLOPS] Efficiency [%] Number of Nodes
LINPACK Performance [GFLOPS] LINPACK Efficiency [%]
Fig. 6.The HPL (LINPACK) performance of m1.small-based virtual clusters results up to the L2 cache boundary, after which the performance ofm1.xlarge drops rapidly and the system performs worse thanm1.large. We speculate on the existence of a throttling mechanism installed by Amazon to limit resource consumption. If this is true, the performance of computing applications would be severely limited when the working set is near or past the L2 boundary. Reliability.We have encountered several system problems during the SJSI ex-periments. When running the LMbench benchmark on a c1.medium instance using the default VM image provided by Amazon for this architecture, the test did not complete and the instance became partially responsive; the problem was reproducible on another instance of the same type. For one whole day we were no longer able to start instances–any attempt to acquire resources was terminated instantly without a reason. Via the Amazon forums we have found a solution to the second problem (the user has to perform manually several account/setup actions); we assume it will be fixed by Amazon in the near future.
Performance of SJMI Workloads. In this set of experiments we measure the performance delivered by homogeneous clusters formed with EC2 instances when running the Single-Job-Multi-Machine (in our case Instance) benchmarks. For these tests we execute the HPCC benchmark on homogeneous clusters of size 1–16 instances.
HPL performance. The performance achieved for the HPL benchmark on various virtual clusters based on them1.smallinstance is depicted in Figure 6.
Table 6.HPL performance and cost comparison for various EC2 instance types
Peak GFLOPS GFLOPS
Name Perf. GFLOPS /ECU /$1 m1.small 4.4 1.96 1.96 19.6 m1.large 17.6 7.15 1.79 17.9 m1.xlarge 35.2 11.38 1.42 14.2 c1.medium 22.0 3.91 0.78 19.6 c1.xlarge 88.0 49.97 2.50 62.5
Table 7.The HPCC performance for various platforms. HPCC-x is the system with the HPCC IDx [2].
Peak Perf. HPL STREAM RandomAc. Latency Bandw. Provider, System [GFLOPS] [GFLOPS] [GBps] [MUPs] [µs] [GBps]
EC2, m1.small 4.40 1.96 3.49 11.60 - -EC2, m1.large 17.60 7.15 2.38 54.35 20.48 0.70 EC2, m1.xlarge 35.20 11.38 3.47 168.64 17.87 0.92 EC2, c1.medium 22.00 3.91 3.84 46.73 13.92 2.07 EC2, c1.xlarge 88.00 51.58 15.65 249.66 14.19 1.49 EC2, 16 x m1.small 70.40 27.80 11.95 77.83 68.24 0.10 EC2, 16 x c1.xlarge 1408.00 425.82 16.38 207.06 45.20 0.75 HPCC-228, 8 cores 51.20 27.78 2.95 10.29 5.81 0.66 HPCC-227, 16 cores 102.40 55.23 2.95 10.25 6.81 0.66 HPCC-224, 128 cores 819.20 442.04 2.95 10.25 8.25 0.68
The cluster with one node was able to achieve a performance of 1.96 GFLOPS, which is 44.54% from the peak performance advertised by Amazon. For 16 in-stances we have obtained 27.8 GFLOPS, or 39.4% from the theoretical peak and 89% efficiency. We further investigate the performance of the HPL benchmark for different instance types; Table 6 summarizes the results. The c1.xlarge instance achieves good performance (51.58 out of a theoretical performance of 88 GFLOPS, or 58.6%), but the other instance types do not reach even 50% of their theoretical peak performance. The low performance ofc1.mediumis due to the reliability problems discussed later in this section. Cost-wise, thec1.xlarge instance can achieve up to 64.5 GFLOPS/$ (assuming an already installed in-stance is present), which is the best measured value in our test. This inin-stance type also has in our tests the best ratio between its Amazon ECU rating (column “ECUs” in Table 2) and achieved performance (2.58 GFLOPS/ECU).
HPCC performance. To obtain the performance of virtual EC2 clusters we run the HPCC benchmarks on unit clusters comprising one instance, and on
16-core clusters comprising at least two instances. Table 7 summarizes the ob-tained results and, for comparison, results published by HPCC for four modern and similarly-sized HPC clusters [2]. For HPL, only the performance of the
c1.xlarge is comparable to that of an HPC system. However, for DGEMM,
20 40 60 80 100 120 140 160 180 200 210 215 220 225 230
Performance of Unoptimized vs. Hand-Tuned Benchmarks [%]
Working Set [B]
unoptimized v hand-tuned (c1.xlarge x 1 process) unoptimized v hand-tuned (c1.xlarge x 2 processes) unoptimized v hand-tuned (c1.xlarge x 4 processes) unoptimized v hand-tuned (c1.xlarge x 8 processes) Optimization break-even: Unoptimized = Hand-tuned (theoretical)
Fig. 7.CacheBench Wr hand-tuned benchmark results on thec1.xlargeinstance type with 1–8 processes per instance
better than the performance of the HPC clusters. We attribute this mixed be-havior to the network characteristics: the EC2 platform has much higher latency, which has an important negative impact on the performance of the HPL bench-mark. In particular, this relatively low network performance means that the ratio between the theoretical peak performance and achieved HPL performance increases with the number of instances, making the virtual EC2 clusters poorly scalable. Thus, for scientific computing applications similar to HPL the virtual EC2 clusters can lead to an order of magnitude lower performance for large sys-tem sizes (1024 cores and higher), while for other types of scientific computing the virtual EC2 clusters are already suitable execution environments.
Reliability.We have encountered several reliability problems during these ex-periments; the two most important were related to HPL and are reproducible. First, them1.largeinstances hang for an HPL problem size of 27,776 (one pro-cess blocks). Second, on thec1.mediuminstance HPL cannot complete problem sizes above 12,288 even if these should still fit in the available memory; as a result, the achieved performance onc1.mediumwas much lower than expected.
4
How to Improve Clouds for Scientific Computing?
Tuning applications for virtualized resources: We have shown through-out Section 3.3 that there is no “best”-performing instance type in clouds–each
instance type has preferred instruction mixes and types of applications for which it behaves better than the others. Moreover, a real scientific application may ex-hibit unstable behavior when run on virtualized resources. Thus, the user is faced with the complex task of choosing a virtualized infrastructure and then tuning the application for it. Butis it worth tuning an application for a cloud?
To answer this question, we use from CacheBench the hand-tuned benchmarks to test the effect of simple, portable code optimizations such as loop unrolling etc. We use the experimental setup described in Section 3.2. Figure 7 depicts the performance of the memory hierarchy when performing the Wr hand-tuned then compiler-optimized benchmark of CacheBench on thec1.xlargeinstance types, with 1 up to 8 benchmark processes per instance. Up to the L1 cache size, the compiler optimizations to the unoptimized CacheBench benchmarks leads to less than 60% of the peak performance achieved when the compiler optimizes the hand-tuned benchmarks. This indicates a big performance loss when run-ning applications on EC2, unless time is spent to optimize the applications (high roll-in costs). When the working set of the application falls between the L1 and L2 cache sizes, the performance of the hand-tuned benchmarks is still better, but with a lower margin. Finally, when the working set of the application is bigger than the L2 cache size, the performance of the hand-tuned benchmarks is lower than that of the unoptimized applications. Given the performance dif-ference between unoptimized and hand tuned versions of the same applications, and that tuning for a virtual environment holds promise for stable performance across many physical systems,we raise as a future research problem the tuning of applications for cloud platforms.
New providers seem to address most of the bottlenecks we identified in this work by providing cloud instances with high speed interconnections like penguin com-puting [24] with their Penguin on DemandTM(PODTM) and HPC as a ServiceTM
offers. HPC as a Service extends the cloud model by making concentrated, non-virtualized high-performance computing resources available in the cloud.
5
Related Work
There has been a spur of research activity in assessing the performance of virtu-alized resources, in cloud computing environments and in general [33, 10, 23, 29, 21, 19, 32, 26, 27]. In contrast to these studies, ours targets computational cloud resources for scientific computing, and is much broader in size and scope: it per-forms much more in-depth measurements, compares clouds with other off the shelf clusters.
Close to our work is the study of performance and cost of executing the Montage workflow on clouds [10]. The applications used in our study are closer to the mainstream HPC scientific community. Also close to our work is the seminal study of Amazon S3 [23], which also includes an evaluation of file transfer between Amazon EC2 and S3. Our work complements this study by analyzing the performance of Amazon EC2, the other major Amazon cloud ser-vice. Several small-scale performance studies of Amazon EC2 have been recently
conducted: the study of Amazon EC2 performance using the NPB benchmark suite [29], the early comparative study of Eucalyptus and EC2 performance [21], etc. Our performance evaluation results extend and complement these previous findings, and give more insights into the loss of performance exhibited by EC2 resources.
On the other hand scientists begin to adapt the cloud infrastructure for their scientific computing. They run their calculations in the cloud [16], extend clusters on demand with IaaS resources [10] and execute big workflows on a resource mix from traditional grids and clouds [22]. This shows the growing importance of IaaS cloud providers for scientific computing and the need to have performance estimates for the different offered types beyond the marketing information offered by the providers.
6
Conclusions and Future Work
With the emergence of cloud computing as the paradigm in which scientific computing is done exclusively on resources leased only when needed from big data centers, e-scientists are faced with a new platform option. However, the initial target of the cloud computing paradigm does not match the characteristics of the scientific computing workloads. Thus, in this paper we seek to answer an important research question:Is the performance of clouds sufficient for scientific computing? To this end, we perform a comprehensive performance evaluation of a large computing cloud that is already in production. Our main finding is that the performance and the reliability of the tested cloud are low. Thus, this cloud is insufficient for scientific computing at large, though it still appeals to the scientists that need resources immediately and temporarily. Motivated by this finding, we have analyzed how to improve the current clouds for scientific computing, and identified two research directions which hold each good potential for improving the performance of today’s clouds to the level required by scientific computing. New provider [24] seem to address this directions and we plan to test their services to see if they can hold their claims.
We will extend this work with additional analysis of the other services offered by Amazon: Storage (S3), database (SimpleDB), queue service (SQS), Private Cloud, and their inter-connection. We will also extend the performance evalu-ation results by running similar experiments on other IaaS providers [25] and clouds also on other real large-scale platforms, such as grids and commodity clusters. In the long term, we intend to explore the two new research topics that we have raised in our assessment of needed cloud improvements.
Acknowledgment
This work is partially funded by the European Union through the IST-034601 edutain@grid project and the Austrian Federal Ministry for Education, Sci-ence and Culture through the GZ BMWF-10.220/0002-II/10/2007 Austrian Grid project.
References
1. The Cloud Status Team. JSON report crawl (January 2009), http://www.cloudstatus.com/
2. The HPCC Team. HPCChallenge results (Sept. 2009), http://icl.cs.utk.edu/hpcc/hpcc_results.cgi
3. Advanced Clustering Tech. Linpack problem size analyzer (December 2008), http://www.advancedclustering.com/
4. Amazon Inc. Amazon Elastic Compute Cloud (Amazon EC2) (September 2009), http://aws.amazon.com/ec2/
5. Arpaci-Dusseau, R.H., Arpaci-Dusseau, A.C., Vahdat, A., Liu, L.T., Anderson, T.E., Patterson, D.A.: The interaction of parallel and sequential workloads on a network of workstations. In: SIGMETRICS, pp. 267–278 (1995)
6. Babcock, M.: XEN benchmarks. Tech. Rep. (August 2007), http://mikebabcock.ca/linux/xen/
7. Barham, P., Dragovic, B., Fraser, K., Hand, S., Harris, T.L., Ho, A., Pratt, I., Warfield, A.: Xen and the art of virtualization. In: SOSP. ACM, New York (2003) 8. Bradshaw, R., Desai, N., Freeman, T., Keahey, K.: A scalable approach to deploying
and managing appliances. In: TeraGrid Conference 2007 (June 2007)
9. Bray, T.: Bonnie, 1996 (December 2008), http://www.textuality.com/bonnie/ 10. Deelman, E., Singh, G., Livny, M., Berriman, J.B., Good, J.: The cost of doing
science on the cloud: the Montage example. In: SC, p. 50. IEEE/ACM (2008) 11. Dongarra, J., et al.: Basic linear algebra subprograms technical forum standard.
Int’l. J. of High Perf. App. and Supercomputing 16(1), 1–111 (2002)
12. Foster, I.T., Freeman, T., Keahey, K., Scheftner, D., Sotomayor, B., Zhang, X.: Vir-tual clusters for grid communities. In: CCGrid, pp. 513–520. IEEE, Los Alamitos (2006)
13. GoGrid. GoGrid cloud-server hosting (September 2009),http://www.gogrid.com 14. Kowalski, A.: Bonnie - file system benchmarks. Tech. Rep., Jefferson Lab (October
2002),http://cc.jlab.org/docs/scicomp/benchmark/bonnie.html
15. Luszczek, P., Bailey, D.H., Dongarra, J., Kepner, J., Lucas, R.F., Rabenseifner, R., Takahashi, D.: S12 - The HPC Challenge (HPCC) benchmark suite. In: SC, p. 213. ACM, New York (2006)
16. Assuncao, A.C.M., Buyya, R.: Evaluating the cost-benefit of using cloud computing to extend the capacity of clusters. In: Kranzlm¨uller, D., Bode, A., Hegering, H.-G., Casanova, H., Gerndt, M. (eds.) 11th IEEE International Conference on High Per-formance Computing and Communications, HPCC 2009. ACM, New York (2009) 17. McVoy, L., Staelin, C.: LMbench - tools for performance analysis (December 2008),
http://www.bitmover.com/lmbench/
18. Mucci, P.J., London, K.S.: Low level architectural characterization benchmarks for parallel computers. Technical Report UT-CS-98-394, U. Tennessee (1998) 19. Nagarajan, A.B., Mueller, F., Engelmann, C., Scott, S.L.: Proactive fault tolerance
for HPC with Xen virtualization. In: ICS, pp. 23–32. ACM, New York (2007) 20. Nishimura, H., Maruyama, N., Matsuoka, S.: Virtual clusters on the fly - fast,
scalable, and flexible installation. In: CCGrid, pp. 549–556. IEEE, Los Alamitos (2007)
21. Nurmi, D., Wolski, R., Grzegorczyk, C., Obertelli, G., Soman, S., Youseff, L., Zagorodnov, D.: The Eucalyptus open-source cloud-computing system. UCSD Tech. Rep. 2008-10 (2008),http://eucalyptus.cs.ucsb.edu/
22. Ostermann, S., Prodan, R., Fahringer, T.: Extended grids with cloud resource management for scientific computing. In: Grid 2009: IEEE/ACM International Conference on Grid Computing (October 2009)
23. Palankar, M.R., Iamnitchi, A., Ripeanu, M., Garfinkel, S.: Amazon S3 for science grids: a viable solution? In: DADC 2008: Proceedings of the 2008 international workshop on Data-aware distributed computing, pp. 55–64. ACM, New York (2008) 24. Penguin Computing. Reliable hpc linux systems (September 2009),
http://www.penguincomputing.com/
25. Prodan, R., Ostermann, S.: A survey and taxonomy of infrastructure as a ser-vice and web hosting cloud providers. In: Grid 2009: IEEE/ACM International Conference on Grid Computing (October 2009)
26. Qu´etier, B., N´eri, V., Cappello, F.: Scalability comparison of four host virtualiza-tion tools. J. Grid Comput. 5(1), 83–98 (2007)
27. Sotomayor, N., Keahey, K., Foster, I.: Overhead matters: A model for virtual re-source management. In: VTDC, pp. 4–11. IEEE, Los Alamitos (2006)
28. Thain, D., Tannenbaum, T., Livny, M.: Distributed computing in practice: the Condor experience. Conc. & Comp.: Pract. & Exp. 17(2-4), 323–356 (2005) 29. Walker, E.: Benchmarking Amazon EC2 for HP Scientific Computing. Login 33(5),
18–23 (2008)
30. Wang, P., Turner, G.W., Lauer, D.A., Allen, M., Simms, S., Hart, D., Papakhian, M., Stewart, C.A.: Linpack performance on a geographically distributed linux clus-ter. In: IPDPS. IEEE, Los Alamitos (2004)
31. Worringen, J., Scholtyssik, K.: MP-MPICH: User documentation & technical notes (June 2002)
32. Youseff, L., Seymour, K., You, H., Dongarra, J., Wolski, R.: The impact of paravir-tualized memory hierarchy on linear algebra computational kernels and software. In: HPDC, pp. 141–152. ACM, New York (2008)
33. Youseff, L., Wolski, R., Gorda, B.C., Krintz, C.: Paravirtualization for HPC sys-tems. In: Min, G., Di Martino, B., Yang, L.T., Guo, M., R¨unger, G. (eds.) ISPA Workshops 2006. LNCS, vol. 4331, pp. 474–486. Springer, Heidelberg (2006)