Cost Efficiency of Critical Access Hospitals
I.Cristian Nedelea Graduate Student
Department of Agricultural Economics and Agribusiness Louisiana State University
101 Ag. Administration Bldg. Baton Rouge, LA 70803 Phone: 225.578.2595 Email: inedel1@lsu.edu J. Matthew Fannin, Ph.D. Assistant Professor
Department of Agricultural Economics and Agribusiness Louisiana State University Agricultural Center
101 Ag. Administration Bldg. Baton Rouge, LA 70803
Phone: 225.578.0346 Email: mfannin@agcenter.lsu.edu
James N. Barnes, Ph.D. Assistant Professor and Director Delta Rural Development Center
Department of Agricultural Economics and Agribusiness Louisiana State University Agricultural Center
P.O. Box 620 Oak Grove, LA 71263 Email: jbarnes@agcenter.lsu.edu
Selected Paper prepared for presentation at the Southern Agricultural Economics Association Annual Meeting, Orlando, FL, February 6-9, 2010
Copyright 2010 by I. Cristian Nedelea, J. Matthew Fannin and James N. Barnes . All rights
reserved. Readers may make verbatim copies of this document for non‐commercial purposes by any
Introduction
Relying heavily on Medicare reimbursement, small rural hospitals have been largely affected by the Medicare payment policies. Medicare has been the most important source of revenue for rural hospitals because rural communities have a relatively higher proportion of the elderly compared to urban areas. Prior to 1983, Medicare reimbursed hospitals according to the actual costs incurred in providing services to Medicare beneficiaries. This cost-based
reimbursement gave hospitals little incentives to control their costs and encouraged both
excessive services and inefficiently produced services (Gianfrancesco 1990). In 1983, Medicare replaced cost-based reimbursement with the prospective payment system1 (PPS). The PPS system was designed to promote efficiency in hospital operation by rewarding hospitals that are able to keep their costs below PPS rates and penalizing hospitals with higher costs2. However, the reimbursement changes caused by the PPS system led to the deterioration of financial conditions of many small rural hospitals that commonly failed to cover costs on Medicare patients (Dalton et al. 2003).
To alleviate the negative financial impact of PPS on small rural hospitals, Congress created programs that exempted eligible rural hospitals from these payment policies. One of the most important programs, called Medicare Rural Hospital Flexibility Program, was created by Congress in 1997 as part of the Balanced Budget Act. This program has established a national limited service hospital program called Critical Access Hospital (CAH). CAHs receive cost-based reimbursement3 for inpatient and outpatient services delivered to Medicare beneficiaries
1
The PPS system paid a fixed fee based on the diagnosis related group (DRG) allowing variations only for very serious cases that might require additional care and resources.
2
Under PPS system, hospitals are allowed to keep the surplus between the PPS rate and actual cost of providing services. Conversely, hospitals can lose money if their costs exceed the PPS rate.
3
Under cost-based reimbursement, hospitals were paid an interim rate throughout the year, receiving retrospective payments from Medicare for the difference between interim payments and total allowable cost at the end of their
and are designed to address the needs of rural communities where full service hospitals are not financially viable (Capalbo et al. 2002). A rural hospital qualifies as a CAH if it meets several requirements. Most importantly the rural hospital must be located at least 35 miles by primary road, or 15 miles by secondary road, from the nearest full service hospital; use no more than 25 acute care beds at any one time; the annual average length of stay cannot be greater than four days; and provide 24-hour emergency care services.
The PPS system relies on the assumption that if a hospital can increase its net revenue by reducing costs, it will seek ways to increase the efficiency with which it uses its resources (Sexton et al. 1989). Conversely, under cost-based reimbursement a hospital has an incentive to increase costs in order to receive higher revenues because Medicare pays for services on a cost basis (McKay et al., 2002/2003). CAHs, which receive cost-based reimbursement, have been designed to support small, isolated rural hospitals that faced the threat of closure because of reduced patient volumes and rising costs. However, even this small rural hospitals need to be concerned with the efficiency of their operations because wasting resources is not in the interest of their long-term financial viability. In addition, CAHs operate in an environment where regulation is geared to hospital survival and price competition is small. Vitaliano and Toren (1996) indicate that these two factors are not conducive to cost-minimizing behavior for hospitals.
With health care costs rising at a rapid rate, understanding the factors that affect cost efficiency of hospitals is critical. The primary objective of this research is to examine the factors associated with cost inefficiency of CAHs. Specific objective are: (1) estimate a stochastic frontier cost function to assess the cost inefficiency of CAHs; and (2) identify some of the factors that are likely to influence the inefficiency of CAHs.
Literature review
Previous studies of hospital inefficiency have found that hospitals do not use best-practice or optimal combinations of inputs to produce a given level of output (McKay et al. 2002/2003). Empirical studies of hospital inefficiency have applied frontier techniques such as Data Envelopment Analysis or stochastic frontier analysis (SFA). SFA was developed
independently by Aigner, Lovell, and Schmidt (1977) and Meeusen and van den Broeck (1977). The first study that used SFA to analyze US hospital efficiency was published by Zuckerman, Hadley, and Iezzony (1994). Using data from 1,600 US hospitals, they estimated that
inefficiency accounts for 13.6 percent of total hospital costs. In a different study, Hadley,
Zuckerman, and Iezzony (1996) looked at 1,435 acute-care US hospitals between 1987 and 1989 and found that hospitals facing greater financial pressure improved their efficiency. Using a stochastic costs frontier, Vitaliano and Toren (1994) found that the average level of cost inefficiency in New York nursing homes was 29 percent. Chronic excess demand, excessive managerial personnel and diseconomies of size are suggested as causes of inefficiency. In a similar study, Vitaliano and Toren (1996) applied SFA to 219 general care hospitals in New York in 1991 and estimated an average inefficiency of 18 percent. They found that hospitals that rely more heavily on Medicare are more efficient and that reimbursement restrictions may reduce inefficiency. Rosko (1999) used SFA to estimate cost inefficiency in US hospitals. Based on a sample of 3,262 hospitals from 1994, he calculated that mean inefficiency is ranging from 20.2 percent to 25.5 percent depending on the distribution of error. The results show that fiscal pressure from Medicare and Medicaid creates incentives for efficiency.
Model Specification
i i i i TC Y W
TC = ( , )+ε , i= 1,2,…..n (1)
where TC represents total cost; Y is a vector of outputs; W is a vector of input prices; and ε is a composite error term which can be decomposed as:
i i i =v +u
ε (2)
where v captures random statistical noise, assumed to be distributed as N(0, σ2); and u represents cost inefficiency and is assumed to be positive. Furthermore, it is assumed that u has a specific distribution, different of the distribution of v, and that v and u are distributed independently of each other and of regressors. Although the half-normal distribution is the most frequently assumed, there is no economic criteria for the selection of this or other distributional forms for u (Schmidt and Sickles 1984).4
The inefficiency term u must be observed indirectly from the estimates of ε (= v + u). Specifically, for a half-normal distribution, the expected mean value of inefficiency, conditional upon the composite residual εis (Jondrow et al., 1982):
⎥ ⎦ ⎤ ⎢ ⎣ ⎡ − − Φ + = σ λ ε σ λ ε σ λ ε φ λ σλ ε i i i i i u E ) / ( ) / ( ) 1 ( ) | ( 2 (3)
where σ2 =σu2 +σv2 . λ =σu σv ; φ(.) and Φ(.)are, respectively, the probability density function and cumulative distribution function of the standard normal distribution.
In the estimation of a stochastic frontier cost model, one must specify a functional form for the cost equation. Hospital applications of SFA have used a variety of functional forms, the most popular being the translog and the Cobb-Douglas cost functions (Rosko and Mutter 2008). While the main advantage of Cobb-Douglas is its simplicity, if the structure of production
4
technology is more complex than its Cobb-Douglas representation, the unmodeled complexity will show up in the error term, leading to biased estimates of the cost inefficiency (Kumbhakar and Lovel 2000). The translog functional form can mitigate this problem. In a general form, the translog cost function is expressed as:
i i m j i ij l j jl k i ik j j i i u v PM W Y W W Y Y W Y a TC + + + + + + + + =
∑
∑∑
∑∑
∑∑
∑
∑
ϕ ρ λ η β α ln ln ln ln 2 1 ln ln 2 1 ln ln ln (4)where TC is total cost; Y, outputs; W, input prices; and PM represents product-mix variables, and v and u are as defined before. The translog cost function in (4) is estimated with the restriction of linear homogeneity in input prices imposed.
Researchers have been interested in explaining the factors that influence cost
inefficiency. The cost inefficiency effects, ui, could be specified as (Battese and Coelli 1995):
i i
i z w
u = δ + (5)
where zi is a vector of exogenous variables associated with inefficiency effects; is a vector of
parameters to be estimated; wi is a random variable defined by the truncation of the normal
distribution with mean zero and variance σ2, such that the point of the truncation is .
The analysis of the effect of exogenous variables (z) on inefficiency effects can be done in one or two stages. The two-stage approach includes a first stage in which one estimates the stochastic cost frontier model and predicts inefficiency effects, ignoring z. Then, in the second stage, the inefficiency estimates are regressed against the set of exogenous variables z.
Kumbhakar and Lovel (2000) and Wang and Schmidt (2002) state that the two-stage procedure will give biased results, because the model estimated in the first stage is misspecified. They
suggest that the solution to this bias problem is a one-stage procedure in which equations (1) and (5) are simultaneously estimated by maximum likelihood.
We prefer the one-stage approach suggested by Battese and Coelli (1995), Kumbhakar and Lovel (2000) and Wang and Schmidt (2002) to analyze cost efficiency of CAHs. Our
stochastic frontier cost model allows inefficiency effects to be explicitly modeled as a function of exogenous variables, the parameters of which are estimated simultaneously with the stochastic cost frontier.
The level of cost efficiency of the ith hospital, CEi, may be calculated as the ratio of the
frontier minimum cost (where ui=0 on the cost frontier) to observed total cost for the hospital.
Following Coelli et al. (2005), cost efficiency of the ith hospital is defined as:
) u (
CEi =exp − i (6)
This measure ranges in value from zero to one, where the most efficient (low cost) hospital takes a value of one. Similarly, the amount by which exp(ui) exceeds 1 is a measure of
cost-inefficiency of the ith hospital.
Data
The data used for this study come primarily from the 2006 American Hospital
Association Annual Survey of Hospitals and the 2006 Medicare Hospital Cost Report. The unit of observation for the analysis is the hospital. The market area is defined as the county, a definition used frequently in hospital studies, as Rosko (1999, 2001) points out. Defining the market area as the county allows us to use the Area Resource File for county level data.
The dependent variable used in stochastic frontier cost model is represented by the total hospital cost, calculated as the sum of total salary expenses, total capital related costs, and total other costs from the Medicare Cost Report (McKay and Deily 2008). The explanatory variables
consist of input prices and outputs. In their excellent review of hospital inefficiency studies, Rosko and Mutter (2008) emphasize that most of the hospital stochastic frontier studies included both inpatient and outpatient outputs. Following McKay et al. (2002/2003) and Rosko (1999), we use as outputs the number of outpatient visits, the number of admissions and the number of inpatient days. Rosko and Mutter (2008) also point out that, due to data constraints, the input price variables were similar in each national study. Following past practices, we use two input prices in our analysis: the price of labor, approximated by the sum of hospital payroll expenses and employee benefits divided by the full-time equivalent hospital unit total personnel; and the price of capital which was approximated by the sum of depreciation expenses and interest expenses (obtained from Medicare Cost Report) divided by the number of hospital beds. The assumption of linear homogeneity in input prices is imposed by normalizing the cost equation by the wage rate.
Other variables influencing hospital cost can be generally classified as what Rosko and Mutter (2008) call product mix descriptors (i.e., variables that reflect the heterogeneity of output). In this category we include the percent of outpatient visits classified as emergency ((emergency room visits/ total outpatient visits) ×100), the percent of outpatient surgical operations ((outpatient surgeries/total outpatient visits) ×100), and the percent of inpatient surgical operations ((inpatient surgeries/admissions) ×100). Two other variables included in the cost function are the number of hospital beds set up and staffed and a variable for quality to control for variation in available hospital services. Folland and Hoffer (2001) state that failure to include a variable for quality in the cost function might cause an omitted variable bias. We use as a quality measure hospital accreditation status. This is represented by accreditation by the
Joint Commission on Accreditation of Health Care Organizations (JCAHO), a quality measure commonly used in the literature (see for example McKay and Deily 2008).
A set of variables that may affect hospital cost efficiency is also included in the stochastic frontier cost model. The primary variables of interest are those associated with the type of hospital reimbursement policies, ownership status, and the degree of competition in a hospital’s market. Rosko (1999) suggests that cost inefficiency may arise from the lack of regulatory pressure on hospitals to operate as efficiently as possible. Medicare reimbursement policies have an impact on hospital profits and can create incentives for hospitals to operate more efficiently. For example, reimbursement policies under Medicare PPS create incentives for reducing inefficiency while cost based reimbursement gives hospitals little incentives to control their costs. We follow Vitaliano & Toren (1996), McKay et al. (2002/2003), and Rosko (1999, 2001) and use two variables to reflect the regulatory pressure of public payers: Medicare percent of discharges ((Medicare discharges / total discharges) × 100) and Medicaid percent of discharges ((Medicaid discharges / total discharges) × 100). Under PPS system, Medicare reimbursement policies place fiscal pressure on hospitals. Therefore the Medicare percent variable is expected to be inversely related with inefficiency when hospitals receive PPS reimbursement. On the other hand, CAHs receive Medicare cost-based reimbursement and have little incentives to control their costs. As a result, we expect that Medicare percent variable to be directly associated with CAH cost inefficiency.
The effect of ownership on hospital efficiency should be consistent with Property Rights Theory which suggests that for-profit hospitals pursue profit maximization (Rosko 1999). One way in which for-profit hospitals increase their profits is by reducing inefficiency. The
ownership status in this analysis is introduced by using dummy variables that define public/government owned hospitals, private non-profit hospitals and for-profit hospitals.
Following Rosko (1999, 2001) and Mutter and Rosko (2008) we use a Herfindahl-Hirschman index (HHI) to measure competitive pressure in the hospital’s market. HHI is calculated by summing the squares of the market shares of admissions for all of the hospitals in the county. This index equals one in monopolistic markets and approaches zero in markets with high competition. Higher HHI values reflect less competitive pressure, and hence increased efficiency should be inversely related to HHI.
Other variables that may be used to explain hospital cost inefficiency is county unemployment rate (from 2006 Area Resource File) and occupancy rate. The county
unemployment rate is used as a proxy for the amount of uncompensated care provided by the hospital. The occupancy rate is defined as the number of inpatient days divided by the cumulative number of beds maintained during the year (number of hospital beds ×365 days). Ferrier and Valdmanis (1996) found that higher occupancy rates in rural hospitals helped enhance cost efficiency. We also included a dummy variable to represent whether the hospital participates in a network. When a hospital participates in a network, it has an agreement with one or more hospitals for transfer of patients and sharing of resources and personnel. This allows hospital to provide services at lower costs by allocating the treatment of patients across network members. Thus, it is expected that hospitals that participate in a network to be more efficient than the ones that does not.
We started the analysis with a sample of general medical and surgical hospitals located in non-metro areas in the U.S. in 2006. This sample also includes information on CAHs which is of primary importance for our study. Although there were 2,053 rural hospitals (out of which 934
were CAHs) in the initial sample, data issues including missing information and implausible values reduced the number of hospitals eligible for the study to 1,561 rural hospitals (including 688 CAHs). Table 1 presents definitions and summary statistics for all variables used in empirical estimation for both the sample of non-CAH rural hospitals and the CAH sample. Table 1. Variable definitions and summary statistics
CAH Sample (n=688) Non-CAH Sample (n=873)
Cost Function Variables Mean Std. Dev. Mean Std. Dev. tc Total hospital cost($) 13,400,000.00 9,473,409.00 53,400,000.00 53,800,000.00 admh Total hospital admissions 668.67 434.34 3,818.88 3,251.03 ipdh Total inpatient days 2,695.46 1,584.93 16,054.61 15,937.38 vtot Total outpatient visits 28,018.15 25,775.10 84,410.03 77,641.12 Pk Price of capital($) 35,321.13 32,568.80 40,755.62 30,222.01 w Price of labor($) 49,831.09 17,944.22 54,048.10 15,047.03 erpct % emergency room visits 21.62 19.90 27.71 18.48
suroppct % outpatient surgeries 1.89 2.13 3.39 3.35 surippct % inpatient surgeries 10.28 11.39 23.29 12.56
jcaho 1 if accredited by JCAHO 0.21 0.41 0.70 0.46
bdh # hospital beds 21.60 5.05 85.92 68.36
Efficiency Variables
gov Government owned hospital 0.47 0.50 0.29 0.45
nprofit Non-profit hospital 0.50 0.50 0.58 0.49
fprofit For-profit hospital 0.03 0.17 0.13 0.34
mcrpct % Medicare discharges 62.10 15.53 50.83 11.02
mcdpct % Medicaid discharges 10.25 8.70 18.77 9.38 unemployment County unemployment % 5.12 1.70 5.71 1.75
occup Occupancy rate 0.33 0.17 0.47 0.16
netwrk 1 if h. participate in a network 0.43 0.50 0.31 0.46
hhi Herfindahl-Hirschman index 0.58 0.35 0.56 0.35
Results
We first examined whether being a CAH has any effect on hospital efficiency. This was done by estimating a stochastic frontier model (with a translog cost function and assuming a half-normal distribution for the inefficiency error term) using a sample of rural hospitals (N = 1,561) and including in the inefficiency equation a dummy variable that is 1 if the hospital is a
CAH and 0 otherwise. The estimated results show a positive and significant (p-value<0.01) coefficient of CAH variable. This indicates that CAHs might be less efficient relative to other rural hospitals.
To investigate whether CAHs and non-CAH rural hospitals can be modeled separately, we performed a Chow test to test the null hypothesis of pooling the data (estimating a stochastic cost frontier model using the full sample of rural hospitals) against the alternative of sorting the data (estimating separate cost frontier models for CAHs and non-CAH rural hospitals). The rejection of the null hypothesis (based on a Chi-square of 76.75 and a p-value<0.05) indicates that separate cost frontier models for CAHs and non-CAH rural hospitals are appropriate.
Next, we performed a series of likelihood-ratio tests to arrive at a preferred model using the sample of CAHs. We started by testing H0: 0, where ⁄ is a parameter of the log-likelihood function (Battese and Corra 1977). This is equivalent to testing whether SFA is more appropriate than OLS as an estimation technique. Accepting H0 implies that
0 and thus the deviations from the cost frontier are due entirely to statistical noise. In this case the parameters can be consistently estimated using OLS. As indicated in Tables 2, the null hypothesis that 0 was rejected and the stochastic frontier cost model was used in empirical analysis.
We also tested whether a simpler functional form such as Cobb-Douglas can more accurately represent the cost frontier. The null hypothesis was that the parameters of all squared and interaction terms in the translog cost function equals zero (Bij=0). The rejection of the null
hypothesis, as shown in Table 2, indicates that the translog functional form can more accurately represent the cost frontier.
In SFA, an assumption about the distribution of the inefficiency error term, u, must be made. The truncated–normal distribution for u, defined as u~N+(µ, ), reduces to the half-normal distribution when µ=0. Therefore, we can test whether it is appropriate to assume the half-normal distribution for u by testing H0: µ=0. As Table 2 shows, we failed to reject H0 and the half-normal distribution for u was assumed in empirical estimation.
Finally, we tested whether the exogenous inefficiency variables, as a group, have a significant impact on cost inefficiency. This is equivalent to testing H0: δ1=δ2=….=δ8=0. As Table 2 shows, the H0 was rejected and this implies that the exogenous inefficiency variables belong in the model. Based on the above likelihood ratio tests, our preferred stochastic frontier model for the CAH sample uses the translog cost function with a half-normal distribution for the inefficiency error term. For comparison purposes, we also estimate a separate stochastic frontier model for non-CAH rural hospitals imposing the same conditions as in the model that uses CAH sample.
Table 2. Likelihood-ratio test of null hypothesis for parameters of stochastic frontier translog cost model for CAH sample.
Null Hypothesis Tests Statistic Χ2(0.05) Decision
µ = 0 0.190 3.841 Fail to Reject
Bij = 0 94.069 18.307 Reject
= 0 49.451 16.919 Reject
δ1=δ2=….=δ8=0 31.052 15.507 Reject
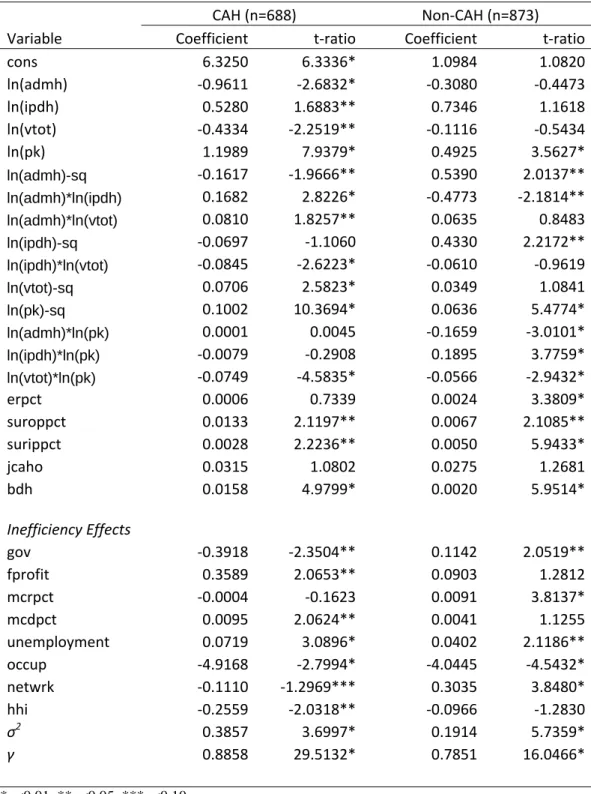
Table 3 summarizes the empirical results obtained from estimating separate stochastic frontier models for CAHs and non-CAH rural hospitals. Some of the estimated coefficients of the output variables and interaction terms are insignificant and of unexpected sign. This may be due to multicolinearity problems. When the Cobb-Douglas cost function was used, the
coefficients of input price and output variables were significant and had the expected positive sign.
In the translog cost function, the squared and interaction terms make the individual estimated coefficients difficult to interpret directly. As an alternative, these coefficients can be used to calculate cost elasticieties. The cost elasticities of price of capital and inpatient days, evaluated at the mean, are larger for CAHs (0.3283 and 0.2166) than for non-CAHs (0.2817 and 0.2023). On the other hand, the cost elasticities of admissions and outpatient visits are larger for non-CAHs (0.3174 and 0.2382) than for CAHs (0.1182 and 0.1745).
The coefficient of the accreditation by JCAHO variable was found insignificant in both samples of data. While the coefficient of erpct variable was found insignificant in the CAH sample, it was significant (p-value<0.01) and positive in the non-CAH sample. The coefficient of bdh variable is positive and highly statistically significant (p-value<0.01) in both samples; however, it is larger for CAHs implying that a reduction in bdh would decrease costs more for CAHs than for non-CAH rural hospitals. Similarly, the coefficients of suroppct and surippct are positive and statistically significant (p-value<0.05) in both samples, implying that an increase in surgical operations leads to an increase in hospital costs.
More important for our study are results for the inefficiency effects variables presented at the bottom of Table 3. While the coefficient of the government ownership variable is negative and significant (p-value<0.05) for CAHs, it is positive and significant (p-value<0.05) for CAHs. These results indicate that government owned CAHs are more efficient relative to non-profit CAHs while government non-CAHs are less efficient relative to non-non-profit non-CAHs. The positive and significant (p-value<0.05) coefficient of for-profit variable for CAHs is contrary to what Property Rights Theory (PRT) predicts. Contrary to what PRT predicts, our results indicate that for-profit CAHs are more inefficient than non-profit CAHs. An explanation for this result could be the lack of constraint in payment mechanism. CAHs are fully reimbursed
for the cost of providing care to Medicare and Medicaid beneficiaries and this could diminish the attention managers of for-profit CAHs might pay to the improvement of efficiency. Our results for CAHs are consistent with the findings of Ozcan et al. (1992) who found that for-profit hospitals are less efficient than non-profit hospitals while government hospitals are more efficient than non-profit counterparts.
It is widely recognized that hospitals respond to Medicare and Medicaid payment mechanisms (McKay et al. 2002/2003, Rosko and Mutter 2008). A large number of studies show that Medicare PPS payment mechanism places fiscal pressure on hospitals. In these studies Medicare is inversely related to inefficiency (Rosko 1999). CAHs receive cost-based reimbursement and this provides little incentive for cost control. Our main hypothesis was that Medicare cost-based reimbursement for CAHs may lead to inefficient operation of these hospitals. The estimated results show that the coefficient of mcrpct is insignificant in CAH sample but positive and significant (p-value<0.01) in non-CAH sample. The positive sign of mcrpct in non-CAH sample is unexpected and counterintuitive. The coefficient of mcdpct variable is positive and significant (p-value<0.05) for CAHs and insignificant for non-CAHs. The positive coefficient of mcdpct indicates that mcdpct might lead to an increase in cost inefficiency because CAHs tend to be located in less affluent areas with a large number of Medicaid and uninsured patients.
The coefficient of unemployment percent variable (a proxy for uncompensated care) is positive and significant for both CAHs and non-CAHs; however, it is much larger (0.072) for CAHs than for non-CAHs (0.040). An explanation for the larger, positive effect of
unemployment rate on CAH cost inefficiency may reside in the combination of cost-based reimbursement and the higher levels of uncompensated care that CAHs provide.
The coefficient of occupancy rate variable is negative and highly significant
(p-value<0.01) for both CAHs and non-CAHs; however, the coefficient is larger in absolute value for CAHs (4.92) than for non-CAHs (4.04). Therefore, the results indicate that an increase in occupancy rate leads to a decrease in cost inefficiency. This is consistent with Ferrier and Valdmanis (1996), who found that occupancy rate in rural hospitals, is strong, positively correlated with cost efficiency. The estimated coefficient of netwrk has the expected negative sign and is statistically significant value<0.10) for CAHs and positive and significant (p-value<0.01) for non-CAHs. The negative coefficient of netwrk variable indicates that CAHs that participate in a network with other hospitals tend to be more cost efficient. This supports the recommendation of Flex Program for CAHs to participate in networks with other hospitals.
Results presented in Table 3 also show that the estimated coefficient of Herfindahl-Hirschman Index (hhi) is negative and significant (p-value<0.05) for CAHs and insignificant for non-CAHs. The negative effect of hhi on CAH cost inefficiency may be contrary to what economic theory suggests. Economic theory predicts that if market competition is decreased (meaning that hhi is increased), hospitals may not be cost minimizers. In other words, if competition is increased (or hhi is decreased) hospitals will compete for patients by reducing costs. However, this may not be always the case. Rosko (1996) states that payment mechanism must be taken into account when evaluating the impact of competition on hospital performance. He suggests that, prior to 1983, in the context of cost based reimbursement, hospitals engaged in service-based competition. Robinson and Luft (1985) and Noether (1988) support this
hypothesis by suggesting that in more competitive markets hospitals employ more capital and equipment, produce more expensive medical care and incur higher costs than hospitals in monopolistic markets. Therefore, the negative coefficient of hhi, implying that as market
competition is decreased cost efficiency of CAHs increases, is consistent with the practice of service-based competition.
Conclusions
In this study, we attempted to answer to the following two questions: Are CAHs less cost efficient than other rural hospitals? and if they are, Is Medicare cost-based reimbursement the main cause of CAHs’ cost inefficiency? Mainly, we tried to analyze whether the policy changes that created CAHs caused an increase in the cost inefficiency of these hospitals or their cost inefficiency is brought about by other factors that are similar to all rural hospitals.
We estimated a mean efficiency of CAHs of 1.25 which gives an average cost inefficiency of 25%. On the other hand, the estimated mean efficiency of non-CAH rural hospitals was 1.176 which implies an average cost inefficiency of 17.6%.5 Thus, the estimated results indicate that CAHs are indeed more cost inefficient than non-CAH rural hospitals. However, the results do not indicate that Medicare cost-based reimbursement is the main cause of higher cost inefficiency of CAHs since we found an insignificant coefficient of the Medicare percent of discharges variable. There might be other causes that can explain the higher cost inefficiency of CAHs such as the larger number of Medicaid and uninsured patients and the higher levels of uncompensated care that CAHs provide. A variable that we did not consider because of the lack of data, but which Vitaliano and Toren (1994) found positively correlated with cost inefficiency of nursing homes is the excessive managerial personnel. Therefore, poor managerial performance might be another cause of increased cost inefficiency of CAHs.
An important policy implication of this study is that regulatory changes aimed at
reducing cost inefficiency of CAHs should focus on increasing occupancy rate in these hospitals.
5
Difference between mean efficiency of CAHs and that of non-CAHs was statistically significant at 0.01 level of significance (t-test=6.151).
One way in which occupancy rate can be increased is by reducing the number of beds of CAHs, perhaps at the initial levels provided under the BBA of 1997 (15 acute care beds, instead of 25 as it is required now). Another policy implication is that the requirement of Flex Program that CAHs should create networks with larger hospitals is an example of good policy since this leads to an increase in cost efficiency of CAHs.
Obviously, this study has some important limitations. One of the most important limitations resides in the strong distributional assumptions used with cross-sectional data. Schmidt and Sickles (1984) noted that maximum likelihood estimation of the stochastic frontier model and the subsequent separation of inefficiency from statistical noise, both require strong distributional assumptions on each error component when cross-sectional data are used. Furthermore, maximum likelihood estimation requires an assumption that inefficiency error component be independent of all explanatory variables. Following past literature, we also assumed exogenous input prices and exogenous outputs in the estimation of stochastic frontier cost model. Another limitation was that the study was limited to one year. It would be interesting to examine changes in inefficiency over time, perhaps by comparing the inefficiency of hospitals before and after the conversion to CAH status. But this might be the subject of future research.
Table 3. Parameter estimates for frontier cost model
CAH (n=688) Non‐CAH (n=873)
Variable Coefficient t‐ratio Coefficient t‐ratio
cons 6.3250 6.3336* 1.0984 1.0820 ln(admh) ‐0.9611 ‐2.6832* ‐0.3080 ‐0.4473 ln(ipdh) 0.5280 1.6883** 0.7346 1.1618 ln(vtot) ‐0.4334 ‐2.2519** ‐0.1116 ‐0.5434 ln(pk) 1.1989 7.9379* 0.4925 3.5627* ln(admh)-sq ‐0.1617 ‐1.9666** 0.5390 2.0137** ln(admh)*ln(ipdh) 0.1682 2.8226* ‐0.4773 ‐2.1814** ln(admh)*ln(vtot) 0.0810 1.8257** 0.0635 0.8483 ln(ipdh)-sq ‐0.0697 ‐1.1060 0.4330 2.2172** ln(ipdh)*ln(vtot) ‐0.0845 ‐2.6223* ‐0.0610 ‐0.9619 ln(vtot)-sq 0.0706 2.5823* 0.0349 1.0841 ln(pk)-sq 0.1002 10.3694* 0.0636 5.4774* ln(admh)*ln(pk) 0.0001 0.0045 ‐0.1659 ‐3.0101* ln(ipdh)*ln(pk) ‐0.0079 ‐0.2908 0.1895 3.7759* ln(vtot)*ln(pk) ‐0.0749 ‐4.5835* ‐0.0566 ‐2.9432* erpct 0.0006 0.7339 0.0024 3.3809* suroppct 0.0133 2.1197** 0.0067 2.1085** surippct 0.0028 2.2236** 0.0050 5.9433* jcaho 0.0315 1.0802 0.0275 1.2681 bdh 0.0158 4.9799* 0.0020 5.9514* Inefficiency Effects gov ‐0.3918 ‐2.3504** 0.1142 2.0519** fprofit 0.3589 2.0653** 0.0903 1.2812 mcrpct ‐0.0004 ‐0.1623 0.0091 3.8137* mcdpct 0.0095 2.0624** 0.0041 1.1255 unemployment 0.0719 3.0896* 0.0402 2.1186** occup ‐4.9168 ‐2.7994* ‐4.0445 ‐4.5432* netwrk ‐0.1110 ‐1.2969*** 0.3035 3.8480* hhi ‐0.2559 ‐2.0318** ‐0.0966 ‐1.2830 σ2 0.3857 3.6997* 0.1914 5.7359* γ 0.8858 29.5132* 0.7851 16.0466* *p<0.01, **p<0.05, ***p<0.10
References
Aigner, D., K. Lovell, and P. Schmidt (1977). Formulation and estimation of stochastic frontier: production model. Journal of Econometrics, 6: 21-37.
Battese, G.E. and G.S. Corra (1977). Estimation of production frontier model: with application to the pastoral zone of Eastern Australia. Australian Journal of Agricultural Economics, 21, 169-179.
Battese, G.E. and T.J. Coelli (1995). A model for technical inefficiency effects in a stochastic frontier production function for panel data. Empirical Economics, 20: 325-332. Capalbo, S. M., Tyler J. Kruzich, and Christine N. Heggem (2002). Strengthening a Fragile
Rural Health Care System: Critical Access Hospitals and Telemedicine. Choices Fall 2002: 26-29.
Coelli, T., D. Rao, C. O’Dommell, and G. Battese (2005). An introduction to efficiency and productivity analysis (2nd ed.). New York: Springer.
Dalton, K., R. Slifkin, S. Poley, and M. Fruhbeis (2003). Choosing to convert to critical access hospital status. Health Care Financing Review 25(1): 115-32.
Ferrier, G.D. and V. Valdmanis (1996). Rural hospital performance and its correlates. The Journal of Productivity Analysis, 7, 63-80.
Folland, S. and R. Hofler (2001). How reliable are hospital efficiency estimates? Exploiting the dual to homothetic production. Health Economics, 10, 683-698.
Gianfrancesco, F.D. (1990). The fairness of the PPS reimbursement methodology. Health Service Research 25, 1-23.
Hadley, J., S. Zuckerman, and L. Iezzony (1996). Financial pressure and competition: changes in hospital efficiency and cost-shifting behavior. Medical Care, 34(3): 205-219.
Jondrow, J., S.A.K. Lovell, I.S. Materov, and P. Schmidt (1982). On the estimation of technical inefficiency in the stochastic frontier production function model. Journal of
Econometrics, 23: 269-274.
Kumbhakar, S. and C. Lovell (2000). Stochastic frontier analysis. Cambridge, UK: Cambridge University Press.
McKay, N.L., M.E. Deily, F.H. Dorner (2002/2003). Ownership and changes in hospital inefficiency, 1986-1991. Inquiry. 39: 388-399.
McKay, N.L. and M.E. Deily (2008). Cost inefficiency and hospital health outcomes. Health Economics, 17, 833-848.
Meeusen, W. and J. van den Broeck (1977). Efficiency estimation from Cobb-Douglas
production functions with composed error. International Economic Review, 18: 435-444. Noether, M. (1988). Competition among hospitals. Journal of Health Economics, 7, 259-284. Ozcan, Y.A., R.D. Luke, C. Haksever (1992). Ownership and organizational performance: a
comparison of technical efficiency across hospital types. Medical Care, Vol. 30,No. 9, 781-794.
Rosko, M.D. (1996). Understanding variations in hospital costs: an economic perspective. Annals of Operations Research, 67, 1-21.
Rosko, M. (1999). Impact of internal and external environmental pressures on hospital inefficiency. Health Care Management Science, 2, 63-74.
Rosko, M. (2001). Cost efficiency of U.S. hospitals: a stochastic frontier approach. Health Economics, 10, 539-551.
Rosko, M. D. and R. L. Mutter (2008). Stochastic frontier analysis of hospital inefficiency: a review of empirical issues and an assessment of robustness. Med Care Res Rev 65(2): 131-66.
Schmidt, P. and R.C. Sickles (1984). Production frontiers and panel data. Journal of Business and Economic Studies 2: 299-326.
Sexton, T., A. M. Leiken, S. Sleeper (1989). The impact of prospective reimbursement on nursing home efficiency. Medical Care. 27 (2): 154-163.
Vitaliano, D., M. Toren (1994). Cost and efficiency in nursing homes: a stochastic frontier approach. J. Health Economics 13 (3) 281-300.
Vitaliano, D., M. Toren (1996). Hospital cost and efficiency in a regime of stringent regulation. Eastern Economic Journal, 22,161-173.
Wang, H.J. and P. Schmidt (2002). One-step and two-step estimation of the effects of exogenous variables on technical efficiency levels. Journal of Productivity Analysis, 18, 129-144. Zuckerman, S., J. Hadley, and L. Iezzony (1994). Measuring hospital efficiency with frontier