Review of the air quality
monitoring network in
London:
Ref: GLA 80090
April 2011
Review of air quality monitroing network in London
Air Quality Consultants Ltd
23 Coldharbour Road, Bristol BS6 7JT Tel: 0117 974 1086 12 Airedale Road, London SW12 8SF Tel: 0208 673 4313
Registered Office: 12 St Oswalds Road, Bristol, BS6 7HT
Document Control
Client Greater London Authority Principal Contact Simon Cousins
Report Prepared By: Stephen Moorcroft and Dr Ben Marner
Document Status and Review Schedule
Report No. Date Status Reviewed by
1235/1/F1 19 April 2011 Final Report Prof. Duncan Laxen
This report has been prepared by Air Quality Consultants Ltd on behalf of the Client, taking into account the agreed scope of works. Unless otherwise agreed, this document and all other Intellectual Property Rights remain the property of Air Quality Consultants Ltd.
In preparing this report, Air Quality Consultants Ltd has exercised all reasonable skill and care, taking into account the objectives and the agreed scope of works. Air Quality Consultants Ltd does not accept any liability in negligence for any matters arising outside of the agreed scope of works. The Company operates a formal Quality Management System, which is certified to ISO 9001:2008.
When issued in electronic format, Air Quality Consultants Ltd does not accept any responsibility for any unauthorised changes made by others.
When printed by Air Quality Consultants Ltd, this report will be on Evolve Office, 100% Recycled paper.
Review of air quality monitroing network in London
Contents
1 Introduction ...2
2 Purpose of the Monitoring Network ...3
3 Identification of the Most Valuable Monitoring Sites ...4
4 Identification of Gaps in the Network...14
5 Summary and Conclusions ...16
Glossary ...18
Tables...20
Figures...34
Review of air quality monitroing network in London
1
Introduction
1.1 Air Quality Consultants Ltd (AQC) has been commissioned by the Greater London Authority (GLA) to carry out a review of the automatic air quality monitoring network in London. Three principal objectives were identified for the study:
• To identify the principal roles of the monitoring network in London (both current and future); • To identify which sites provide the most useful data, taking into account geographical location,
site classification, and pollutants monitored; and
• To identify any gaps in the monitoring network which are critical to the delivery of the principal
roles.
1.2 Whilst this review focuses on nitrogen dioxide, PM10 and PM2.5, consideration has also been given
to ozone monitoring in the network due to the important role that this pollutant plays in NOx photochemistry. The role of the monitoring network with respect to the health effects of ozone exposure have not been considered, and are beyond the scope of this study.
1.3 This report only covers the automatic monitoring network, and makes no comment on the extensive passive nitrogen dioxide diffusion tube networks operated by some boroughs. It should also be noted that the report includes all sites which were listed as operational on 25th March 2011. Sites which closed before this date are excluded.
Approach
1.4 The approach taken to this review has involved several different activities:
• Discussions were held with network operators and users of the data at a strategic level. AQC
is grateful to the support provided by Dr Gary Fuller, Dr David Green, Dr Ben Barrett and Dr David Carslaw at King’s College London Environmental Research Group (KCL-ERG) for providing detailed information;
• Discussions were also held with a number of the London Boroughs, focussing on the Air
Quality Cluster Groups. AQC is grateful to Rob Gibson (West London AQCG), Kyri Eleftheriou-Vaus (Central London AQCG) and Ed Steadman (South London AQCG) for providing feedback;
• Information on the individual monitoring sites was downloaded from the Automatic Urban and
Rural Network (AURN), London Air Quality Network (LAQN) and Heathrow Airwatch websites. 1.5 Summary information about individual sites was derived from the relevant websites1. Information was taken from the LAQN in the first instance, and then supplemented with information from the
1
AURN – http://uk-air.defra.gov.uk/; LAQN - http://www.londonair.org.uk; Heathrow Airwatch - http://www.heathrowairwatch.org.uk/
Review of air quality monitroing network in London
other websites as necessary. Where the different websites assign a different name to the same monitoring station (which is a frequent occurrence), the station name used in this report is consistent with that recorded by the LAQN. Where there were discrepencies regarding the instruments used at a site, information from the AURN was used in preference. Measured concentrations and data capture rates were obtained using the Openair software. This approach was not able to extract information from the Heathrow Airwatch site, and whilst these sites are included in the analysis, the measured concentrations are not reported. Similarly, measured concentrations for Sutton Carshalton and Bexley Manor Road West are not reported as the information was not available via the LAQN Openair interface. All PM10 concentrations reported
are as obtained via Openair; the TEOM PM10 data have been adjusted using the Volatile
Correction Model and the BAM data have been adjusted following the approach set out in LAQM.TG(09)2.
2
Purpose of the Monitoring Network
2.1 The automatic air quality monitoring network in London is funded by a number of different organisations:
• Central Government (Defra), via sites that are fully-funded in the AURN;
• London Boroughs (a small number of these sites have been “affiliated” into the AURN, such
that the borough receives funding to support QA/QC and data ratification);
• BAA (for a number of sites in the vicinity of Heathrow Airport).
2.2 The majority of sites in the network are funded by the individual boroughs. TfL has also provided funding to directly provide or upgrade a small number of sites to assist with monitoring the effectiveness of the Low Emission Zone (LEZ).
2.3 Monitoring data collected from the London network are used to fulfil a number of purposes:
• To determine compliance with the objectives and limit values;
• To provide information to research workers in academia and consultancies;
• To provide information to developers to assist with the preparation of Environmental Impact
Assessments and/or air quality assessments;
• To identify trends in pollutant concentrations in order to assess the effectiveness of control
strategies;
• To evaluate the performance of models at both a local and London-wide scale;
2
Review & Assessment: Technical Guidance
( http://archive.defra.gov.uk/environment/quality/air/airquality/local/guidance/documents/tech-guidance-laqm-tg-09.pdf)
Review of air quality monitroing network in London
• To assist the boroughs in their LAQM duties; and
• To inform the development of future policies and strategies to improve air quality.
2.4 It is important to note that whilst the network plays a vital role in supporting a wide range of strategic assessments at the London-wide scale, it is largely dependant on organisation and funding at the individual borough level.
2.5 There is no evidence to suggest that the purpose of the monitoring network will change significantly in the future, although the requirements are viewed differently by different users. At the borough level, the focus is to provide information to councillors, members of the public, pressure groups, and to support the Local Air Quality Management process. The strategic interest lies with the GLA and with central Government and is served by the network of sites that form the AURN and LAQN.
2.6 It is also important to note that there is no obligation on individual boroughs to report monitoring data to any centralised network or website. Whilst this has potentially important implications for the stragtegic use of the monitoring data by GLA, issues related to data management and disemination are outside the scope of this contract.
3
Identification of the Most Valuable Monitoring Sites
3.1 The identification of those sites within the network that provide the most valuable data, in terms of fulfilling the purposes of the network as defined above, has been based upon:
• The use of the site for specific strategic-level assessments;
• The spatial distribution of different site types3 (e.g. kerbside, roadside, urban background)
across London:
• The extent to which the sites represent hotspots or general urban background concentrations
with regard to the critical objective, target or limit value;
• The extent to which the site represents relevant public exposure; • Whether the site typically achieves good data capture rates;
3
The assessment was carried out on a pollutant-by-pollutant basis, as the siting priorities are different for different pollutants.
Review of air quality monitroing network in London
• The equipment used for PM10 and PM2.5 monitoring4 (e.g. whether it is “reference equivalent”); • The continuity of the site; and
• Whether there are collocated pollutant measurements (e.g. PM10/PM2.5, NOx/O3 etc).
3.2 This assessment is necessarily focused on the value of the network to GLA at the strategic level. It is neither feasible, nor appropriate, to evaluate the importance of individual monitoring stations to individual boroughs within the scope of this project.
Overview of the Network
3.3 Figures 1 to 3 show the spatial distribution of the nitrogen dioxide, PM10 and PM2.5 monitoring sites
respectively, with each site categorised according to site type. Figures 4 and 5 also show the PM10 and PM2.5 sites, but exclude those locations where the measurement method used is not
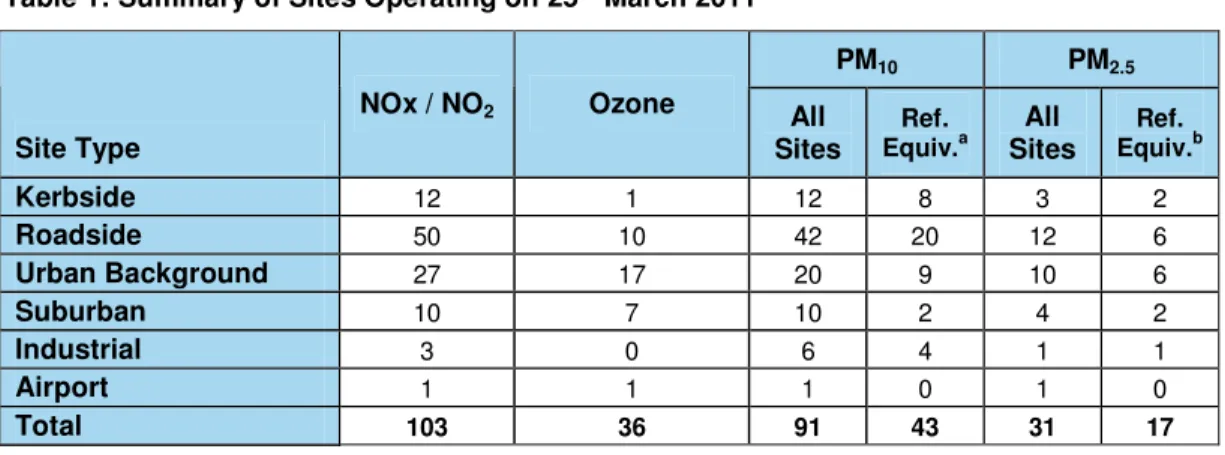
“reference equivalent”. Table 1 summarises Figures 1 to 5, showing the number of sites of each type measuring each pollutant. There are 103 nitrogendioxide sites, 91 PM10 sites, and 31 PM2.5
sites; when only “reference equivalent” sites are included for PM10 and PM2.5, the number of sites
falls to 43 and 17 respectively. Table 1 also shows that 60% of the nitrogendioxide monitoring sites are at roadside and kerbside locations, but only 47% of “reference equivalent” PM2.5 sites are
similarly categorised. Nitrogen Dioxide
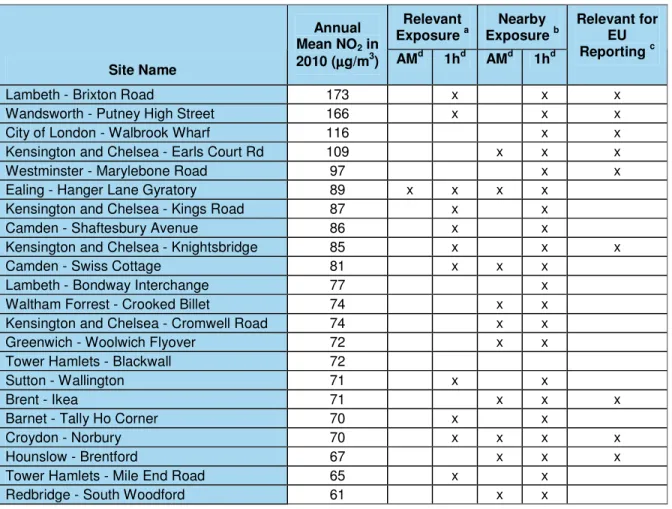
3.4 Figure 6 shows the recorded annual mean nitrogen dioxide concentration in 2010. Concentrations ranged from 173 µg/m3 at the kerbside site at Lambeth Brixton Road, to 21 µg/m3 at the suburban
Hounslow Cranford site. There were exceedences of the annual mean objective for nitrogen dioxide (40 µg/m3), recorded at a total of 50 sites5; 16 of these recorded an annual mean
concentration above 60 µg/m3 6. The concentrations at those sites with the highest levels (>60
µg/m3) are tabulated in Table 2.
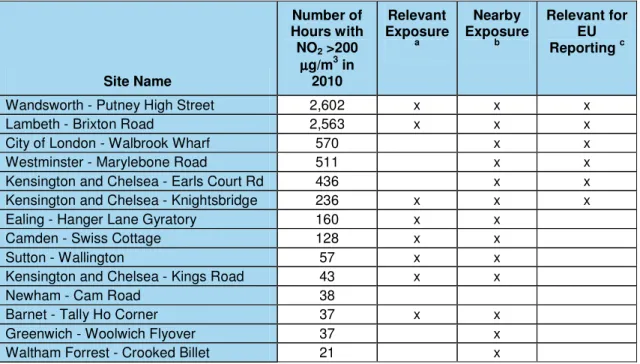
3.5 The 1-hour mean nitrogen dioxide objective (no more than 18 hours above 200 µg/m3) was
exceeded at 14 sites (Figure 7). The numbers of 1-hour mean exceedences are also set out in Table 3.
4
For strict comparison with the UK objectives and EU limit values, concentrations of PM10 and PM2.5 must be measured using a method that has been demonstrated to be equivalent to the European reference sampler. The concentrations measured by such samplers are termed “reference equivalent”. In the London network, PM10 instruments that are equivalent to the reference sampler include the FDMS, Partisol and BAM; for PM2.5, equivalent instruments include the FDMS and Partisol (NB the latter does not have formal equivalence status, but is included in the Defra AEI network).
5
Exceedences of the limit values which are reported by Defra to the European Commission, are restricted to those monitoring sites which form part of the AURN. Sites within the AURN must conform to the Data Quality Objectives and the siting criteria as set out in Annex 1 and Annex III of Directive 2008/50/EC
6
60 µg/m3 is the Margin of Tolerance not to be exceeded after 2010 if a Time Extension Notice for achieving the
Review of air quality monitroing network in London
PM10
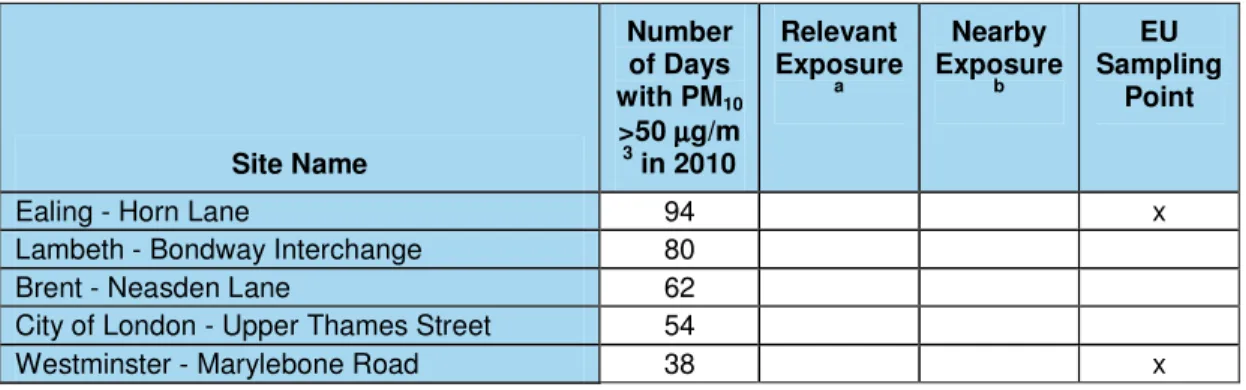
3.6 Figures 8 and 9 show the measured annual mean PM10 concentrations and the number of 24-hour
mean PM10 concentrations above 50 µg/m 3
during 2010. Annual mean PM10 concentrations
ranged from 43 µg/m3 at Lambeth Bondway Interchange (roadside) to 14 µg/m3 at Hillingdon
Harlington (urban background). The annual mean objective (40 µg/m3) was only exceeded5 at two
sites as shown in Table 4. The 24-hour mean objective (which allows no more than 35 exceedences of 50 µg/m3 as a 24-hour mean) was exceeded at five sites, as shown in Table 5.
PM2.5
3.7 Figure 10 summarises the annual mean PM2.5 concentrations during 2010. There were no
recorded exceedences of the 2015 limit value for PM2.5 (25 µg/m3).
Strategic Level Assessments
3.8 Data from the London network are used to support a number of assessments and research projects at the national and regional scales. These include:
3.9 Average Exposure Indicator Reference Sites: The national exposure reduction target for PM2.5
is based on the Average Exposure Indicator (AEI). The AEI is based on measurements at urban background locations in agglomerations throughout the UK, and is assessed as a three-year running mean. The AEI for the reference year (2010) is being determined from the mean concentration of the years 2009, 2010 and 2011. The exposure reduction target is relative to the 2010 AEI and is to be met by 2020 (the mean concentration of the years 2018, 2019 and 2020). Defra has identified eight sites in London which will contribute to the calculation of the UK’s 2010 AEI. Figure 11 shows the AEI sites in London.
3.10 LEZ Supersites: A number of monitoring sites have been established as “LEZ supersites” identified as those locations expected to experience the greatest changes as a result of the introduction of Phases 1 and 2 of the LEZ. One of the sites is wholly funded by TfL with additional equipment provided by TfL at two others. All of the sites have collocated Automated Traffic Counters and ANPR cameras. Figure 12 shows the LEZ supersites.
3.11 LEZ Trend Analysis Sites: These inlcude a number of long-running sites that are used to carry out trend analyses for the LEZ assessment. Figure 12 shows the LEZ rend analysis sites.
3.12 LEZ Background Sites: To assist with the analysis of the LEZ Supersites, a number of background sites have been identified by KCL-ERG. These are sites which are not subject to strong local sources and can thus be used as background controls. Figure 12 shows the LEZ background sites.
3.13 LAQN Index: The LAQN Index was established by KCL-ERG in 1996, and is based on annual mean concentrations at a selected number of long-term monitoring sites. The Index is used to
Review of air quality monitroing network in London
track long-term trends in pollutant concentrations, and is useful in evaluating the effectiveness of air quality management interventions on a regional scale. The Index is reported by both the Environment Agency and the GLA Group. Figure 13 shows the LAQN Index sites.
3.14 Oxidative Potential Measurements: An analysis of the oxidative potential of particulate matter collected at a number of selected monitoring stations across London by KCL-ERG has allowed a comparison between traffic-influenced and background sites to be carried out. The aim of this work is to identify which physical and chemical properties of particles are driving the health effects. Figure 14 shows the Oxidative potential measurements sites.
3.15 ClearfLo: The ClearfLo (Clean Air for London) Project is a NERC sponsored collaborative project that has been set up to investigate boundary layer pollution across London with the aim of improving the predictive capability for air quality. It is heavily reliant on pollutant measurements made at the Marylebone Road and London North Kensington monitoring sites. Table 6 shows that there are only two ClearfLO sites, and so these are not shown on a map.
3.16 AURN: As explained above, many of the sites are part of the UK monitoring network. Figure 15 shows the AURN sites (both fully funded and affiliated) in London.
3.17 Table 6 summarises the sites that are used for the strategic assesments described above.
Analysis of the Network
3.18 Tables 7 to 11 list the 110 sites which were operational on 25th March 2011 (as reported on the AURN, LAQN and Heathrow Airwatch websites);grouped according to site type (e.g. kerbside, roadside etc) using the conventional classification criteria. The tables also indicate how each site is funded. Each site has then been coded according to various criteria. The intention has not been to portray very detailed information about each site, but to provide an overview of the site characteristics and performance so as to aid identification of those sites which are the most valuable. The categories against which each site has been appraised are:
• “Strategic”
This summarises the data from Table 6, but focuses on those sites that have been identified as AEI Reference Sites for PM2.5, those which play an impotant role in the evaluation of the LEZ,
or those that are part of the AURN, as these are considered to be the most important.
• “NOx, Ozone, PM10 and PM2.5”
There is considerable benefit in having co-located pollutant measurements (e.g. to assist in the understanding of the atmospheric chemistry of nitrogen dioxide formation, and to assist with source apportionment). These columns indicate which pollutants are currently measured and at which site. For PM10 the following notation is used:
Review of air quality monitroing network in London
o Sites using “reference equivalent” samplers are indicated with an “x”7 o Sites using TEOM instruments are indicated by “T”8.
For PM2.5 the following notation is used:
o Sites using “reference equivalent” samplers, and Partisols are indicated with an “x” o Sites using TEOM instruments are indicated by “T”9
o Sites using BAM instruments are indicated by “B”10.
• “Duration”
Sites which have been operating continually for an extended period of time allow important analyses of pollutant trends to be undertaken. The following notation is used:
o Sites which have been operating for between 5 and 10 years are indicated by an “x”;
o Sites which have been operating for between 10 and 15 years are indicted by “xx”; and
o Sites which have been operating for more than 15 years are indicted by “xxx”. NB: due to the changes in instrumentation that have taken place at PM10 sites (as they were
upgraded from TEOM to FDMS instruments), it is difficult to interpret long-term trends, and the continuity of the site is of lesser importance. Site history for PM2.5 concentrations is not
recorded as the network is relatively new.
• “QA/QC”
Monitoring stations within the network are operated to three standards, “AURN”, “LAQN” or “Local”. The “Local” standard means that the data are not traceable to national standards. Whilst all of the data are expected to be robust, a greater reliability can be placed upon those sites that conform to the AURN or LAQN standards; these are indicated by an “x”.
• “Data Capture”
Data from any site will be of reduced importance if the data capture is low. An analysis of the data capture for NO2, PM10 and PM2.5 during 2009 and 2010 has been carried out, and the
following notation has been used:
7
This includes all FDMS, Partisol and BAM sites (KCL-ERG has confirmed that all of the PM10 BAMs in the network are unheated and are therefore reference equivalent).
8
For PM10, the TEOM data can be adjusted using the Volatile Correction Model. 9
TEOM PM2.5 data cannot be adjusted using the Volatile Correction Model and these measurements are necessarily of more limited use as they cannot be directly compared with the objectives or limit values.
10
Review of air quality monitroing network in London
o Sites where >= 75% of annual datasets recorded >=90% data capture are indicated by an “xx”;
o Sites where >= 75% of annual datasets recorded >=75% data capture are indicated by an “x”.
o Sites which have not been operating for a full calendar year (and the BAA sites for which data were not readily available) are marked as “n/a”.
• “Hotspot”
For the kerbside and roadside sites, an evaluation has been carried out of whether the site represents a particular hotspot for nitrogen dioxide or PM10. The following notation is used:
o Roadside and kerbside sites with annual mean NO2 in 2010 > 40 µg/m3 are indicated by an “x”;
o Roadside and kerbside sites with annual mean NO2 in 2010 >60 µg/m3, or more than 18 hours with NO2 >200 µg/m3, or more than 35 days with PM10 >50 µg/m3 in
2010 are indicated by “xx”.
o Sites which have not been operating for a full calendar year (and the BAA sites for which data were not readily available) are marked as “n/a”.
Industrial, airport, urban background, and suburban sites have not been included in this analysis.
• “Exposure”
For the kerbside and roadside sites, an evaluation has been carried out of whether the site is likely to represent relevant exposure. This analysis was carried out in two separate stages. For the sites listed in Tables 2 to 5 (i.e. those where annual mean nitrogen dioxide concentrations in 2010 were >60 µg/m3 and those where the 1-hour nitrogen dioxide, annual
mean PM10, or 24-hour mean PM10 objectives were exceeded11), each site was evaluated as to
whether there is relevant long-term or short-term exposure (as defined in LAQM.TG(09)) in the immediate vicinity, and at a similar distance from the road or other source.
11
Review of air quality monitroing network in London
It was also noted whether each of these sites conforms with the siting criteria set out in Annex III of the CAFE Directive12,13. The results from this analysis are shown in Tables 2 to 5. For
those sites not listed in Tables 2 to 5 (i.e. those where annual mean nitrogen dioxide concentrations in 2010 were <60 µg/m3 and where none of the other objectives listed above
were exceeded), a higher-level analysis was carried out from examination of the maps in order to determine whether they represent relevant exposure for the annual mean and/or 24-hour mean objectives/limit values. The results of this assessment are reported in Tables 7 and 8, using the following notation:
Shaded grid cells - For sites listed in Tables 2, 3, 4 and 5
o Sites with relevant exposure (in terms of the objective being exceeded) AND which are considered to meet the CAFE Directive siting criteria are indicated by an “xx”.
o Sites with relevant exposure (in terms of the objective being exceeded) OR which are considered to meet the CAFE Directive siting criteria are indicated by an “x”. Unshaded grid cells - For the remainder of sites
o Sites where it is judged very likely that there was relevant exposure are indicated by an “xx”;
o Sites where the judgement is less clear cut are indicted by an “x”; o Sites where it is judged that relevant exposure is unlikely are unmarked.
• “Model Verification”
Monitoring data from kerbside and roadside sites play an important role in evaluating the performance of dispersion models at both the regional and local scales. Each site was examined in terms of how straightforward it would be to predict concentrations from a model, taking into account the overall complexity of the surrounding road network and the availability of traffic data in the LAEI. The following notation is used:
o Sites where it is judged the data play a very useful role are indicated by an “xx”; o Sites where it is judged the data play a useful role are indicted by an “x”;
12
Directive 2008/50/EC of the European Parliament and of the Council of 21 May 2008 on ambient air quality and cleaner air for Europe. Exceedences of the limit values which are reported by Defra to the European Commission, are restricted to those monitoring sites which form part of the AURN. Sites within the AURN are selected by Defra and must conform to the Data Quality Objectives and the siting criteria as set out in Annex 1 and Annex III of Directive 2008/50/EC
13
Annex III of the CAFE Directive states that compliance with the limit values for the protection of human health shall not be assessed at locations where members of the public do not have access and there is no fixed habitation; on factory premises or at industrial installations to which all relelvant provisions concerning health and safety at work apply; and on the carriageway of roads and the central reservations of roads except where there is normally pedestrian acess to the central reservation. Furthermore, the Annex states that a sampling point must be sited in such a way that the air sampled is representative of air quality for a street segment no less than 100m in length and should be at least 25 m from the edge of major junctions.
Review of air quality monitroing network in London
o Sites were it is judged that the data are likely to be of limited use are unmarked.
• “Represents Background Levels”
For urban background and suburban sites, an evaluation has been carried out as to whether concentrations measured at the site are likely to be strongly influenced by local pollution sources. The London Atmospheric Emissions Inventory was used to determine whether any of the sites were: within 500 m of a listed industrial process or boiler which emits more than 1 tonne of NOx or PM10 per year14; within 100 m of any diesel railway line; within 200 m of any
road with more than 50,000 vehicles per day; or within 75 m of any road with more than 10,000 vehicles per day. The only criteria which identified any sites were those relating to road traffic. The following notation is used:
o Sites that represent background levels, i.e. are sufficiently distant from any local source, are indicated by an “x”;
o Sites that may be affected by nearby roads are unmarked, i.e. they are within the distance criteria set.
Numerical Score
3.19 In order to inform the overall site appraisal, each of the criteria described above has been assigned a score. These scores are ultimately based on professional judgement and take account of the perceived importance of each criterion. The scores assigned are:
Strategic “x” = 15.
Pollutants measured the scoring system takes account of the fact that PM monitoring with “reference equivalent” samplers is more valuable. It also takes account of the benefits arising from having co-located monitoring. Each individual pollutant measured receives one of the following scores:
o NO2 = 2
o PM10 (TEOM) = 1
o PM10 (reference equivalent) = 2 o PM2.5 (reference equivalent) = 2
o An additional score of 1 is given if two pollutants are measured (including ozone), 2 if three pollutants are measured and 3 if four pollutants are measured...
14
Emissions from Part A processes are only shown when above 10 tonnes per year and so this criterion was used for Part A processes
Review of air quality monitroing network in London
For example, if only NO2 and O3 are measured, the total score is 3. If
NO2, O3, PM10, and PM2.5 (both using “reference equivalent” methods) are
measured, the total score is 9. PM2.5 measured using a non “reference
equivalent” method is not scored. Duration “x” = 5; “xx” = 8; and “xxx”; = 10. QA/QC “x” = 5.
Data Capture “xx” = 4; “x” = 2.
Hotspot and Exposure wherever there is exposure (i.e. “xx” or “x” in the exposure column), an “xx” in the hotspot column is assigned 10, and an “x” in the hotspot column is assigned 5. Wherever there is no exposure, there is no score given to hotspots.
Model verification “x” = 3; “xx” = 5. Represents Background “x” = 10.
3.20 For each site, these scores are summed to give an overall site appraisal score as shown in Tables 7 to 11. Because the newest sites and the BAA sites received “n/a” for some of the criteria, the score is given as a range, with the lower value representing the calculated score, and the upper value representing the total value if the site scored the maximum possible for each “n/a” entry. 3.21 It should be recognised that the scoring system used is approximate and there is no basis for
stating, for example, that a site which scores 35 is more valuable than one which scores 34, however, a site which scores 38 is clearly more valuable than one scoring 10. It should also be recognised that the scoring system is different for the different site types.
3.22 The numerical appraisal scores have been used as the basis for assigning each site a category (A-C). For kerbside, roadside, urban background and suburban sites, a numerical assessment score <15 equates to Category C; an assessment score >=15 but <30 equates to Category B; and an assessment score >=30 equates to Category A. For industrial and airport sites, the total achievable score is lower and a numerical assessment score <8 equates to Category C; an assessment score >=8 but <15 equates to Category B; and an assessment score >=15 equates to Category A.
3.23 Overall, it is considered that the following descriptions can be applied to each site appraisal category:
o Category A: the data from these sites are considered to be critical to fulfilling the
identified purposes of the network
o Category B: the data from these sites are considered to play an important role in
Review of air quality monitroing network in London
o Category C: the data play a limited role in fulfilling the identified purposes of the
network.
Spatial Analysis
3.24 The analysis up until this stage has not taken into account whether the urban background and suburban sites fulfil an important role in terms of defining the spatial distribution of concentrations across London. Consideration of the spatial distribution may therefore justify amending a site, for example from Category C to Category B. Figure 16 shows the urban background and suburban nitrogen dioxide sites, overlaid onto the modelled concentration fields presented in the Mayor’s Air Quality Strategy. It is evident from an examination of the spatial distribution that loss of the site at Lambeth Streatham Green (classified as Category C) would leave an obvious “gap” in the network were it to be removed. However, on closer examination, the station is sited relatively near to two busy roads and as such is unlikely to represent general urban background conditions. It is thus considered appropriate for it to remain as a Category C site.
3.25 Figure 16 also shows that some of the Category A and B sites are located relatively close to each other. In particular, two sites within the City of London (Senator House and Sir John Cass School), two sites in Wandsworth (Putney and Town Hall), two sites in northern Bexley (Belvedere and Belvedere West), two sites near the Tower Hamlets/Newham border (Poplar and Wren Close), and several sites in the vicinity of Heathrow Airport. Despite their spatial proximity, each of these sites is considered valuable in its own right, and it is not considered appropriate to re-categorise them. It is thus concluded that there are no urban background or suburban nitrogen dioxide monitoring sites that require re-categorisation based on their spatial distribution.
3.26 Figure 17 shows the urban background and surburban PM10 sites. It is concluded that loss of the
Category B site at City of London Sir John Cass School would leave a “gap” in the network if it were removed. In the context of central London, the siting of this monitor provides valuable information on local background levels. This site has therefore been re-categorised as a Category A site. As with the NO2 sites, it is noted that some of these monitors are relatively close to each
other - in particular, the Wandsworth Putney and Richmond Barnes Wetlands sites, and two of the Bexley sites (Belvedere and Belvedere West). However, each of these sites is considered valuable in its own right, and it is not considered appropriate to re-categorise them.
3.27 All eight “reference equivalent” urban background and suburban PM2.5 sites are already Category
A sites and so this analysis has not been carried out for PM2.5. Similarly, because the spatial
distribution of kerbside, roadside, and industrial sites is determined by specific local factors, an analysis such as this is not appropriate for these sites.
Review of air quality monitroing network in London
Overall Site Appraisal
3.28 A summary of the categorised sites is shown in Table 12 and in Figures 18, 19 and 20. The majority of sites have been classified as Category A, with a significant number classified as Category B; only a small number classified as Category C.
4
Identification of Gaps in the Network
Urban Background and Suburban Sites
Nitrogen Dioxide
4.1 Figure 21 shows the distribution of urban background and suburban nitrogendioxide sites across London overlaid on the modelled concentrations in order to provide a frame of reference. The coverage is good and there is no overriding need for any additional sites. There are, however, no sites measuring nitrogendioxide concentrations at an urban background location in the western half of the City of Westminster, which is an area where modelled concentrations are particularly high. It may thus be beneficial to have an additional site in the area circled in black on Figure 21. It may also be beneficial to have an additional site immediately to the southeast of the central London, within the area identified that encompasses parts of the London Boroughs of Lambeth, Southwark and Lewisham, as well as a site within the larger circled area that largely encompasses the London Borough of Bromley.
PM10
4.2 Figure 22 shows the urban background and suburban PM10 sites overlaid on the modelled PM10
concentrations in order to provide a frame of reference. There is good coverage, with no overriding nead for additional sites. There would, however, be a benefit to having an additional site in the western half of the City of Westminster, within the area identified in Figure 22.
PM2.5
4.3 Figure 23 shows the urban background and suburban “reference equivalent” PM2.5 sites, overlaid
on the modelled PM10 concentrations
15
in order to provide a frame of reference; these are all Category A sites, and have been selected by Defra as AEI reference sites for the London agglomeration. It can be seen from Figure 23 that areas in south and northeast London are poorly represented by monitoring.
15
The Mayor’s Air Quality Strategy does not include a map of modelled PM2.5 concentraitons but the spatial distribution is expected to be the same as for PM10.
Review of air quality monitroing network in London
4.4 An analysis of the number of monitoring sites required to provide a robust AEI was carried out by AQC on behalf of Defra16. The analysis was necessarily confined to PM
10 (as there were few
operational PM2.5 sites at the time the report was completed); the analysis concluded that a
minimum of 8 sites woud be required for London, with only marginal improvement in the deviation from the overall average for between 10-15 sites. However, a subsequent report17 noted that the
inclusion of additional sites above the minimum would be advantageous:
• There is the potential for sites to change in nature, or even close;
• It is important to deploy monitoring sites that are as close as possible to, and are
representative of, the population area that is being represented. There are also issues of public perception if population exposure is determined by monitoring sites that are remote. 4.5 It is concluded that it would be beneficial to have two additional urban background/suburban sites
within the areas identified in Figure 23. However, it should be recognised that if additional sites were to be included at this stage they could not be incorporated into the Defra AEI reference sites, as they would not have been operational over the period 2009-2011. The information would nevertheless support any future PM2.5 obligations on the Mayor.
Kerbside and Roadside Sites
Nitrogen Dioxide
4.6 Figure 24 shows the kerbside and roadside nitrogendioxide sites. A high-level analysis is to identify potential gaps is necessarily limited for kerbside and roadside sites, since local conditions are very spatially variable. With this caveat in mind, Figure 24 suggests that additional sites within the areas identified would be beneficial. It is recognised that one of the areas where additional sites would be beneficial already includes one site (Lambeth Bondway Interchange), but this Category C site is positioned such that it is of limited value as a roadside monitor18.
PM10
4.7 Figure 25 shows the roadside and kerbside PM10 sites. As stated above, a high-level analysis is of
limited use due to the degree of spatial variability. However, it would be beneficial to have additional sites within the areas identifed in the Figure. It is noted that this could potentially be achieved in one of the areas by upgrading the Camden Euston Road site to measure PM10, as well
as the currently measured nitrogen dioxide.
16
Options for an Exposure-Reduction Approach to Air Quality Management in the UK and the EU for Non-Threshold Pollutants. Air Quality Consultants, 2005.
17
Options for an Exposure-Reduction Approach to Air Quality Management in the UK. Air Quality Consultants, 2006. 18
Review of air quality monitroing network in London
PM2.5
4.8 Figure 26 shows the roadside and kerbside “reference equivalent” PM2.5 sites. It is considered
unlikely that the PM2.5 limit value will be exceeded even at roadside and kerbside sites, and there
is thus no justification for a dense network of PM2.5 monitors. However, it is noted that there are
no sites in central London, where predicted concentrations are the highest, and it would be beneficial to have an additional site within the area identified in the Figure.
Other Issues
4.9 Whilst this report focuses on monitoring stations, it is also important to consider other information that is often required to support data analysis and interpretation. In particular, the assessment of emissions from road traffic is often hampered by the lack of reliable information on traffic flows and composition. The inclusion of additional Automatic Traffic Counters and ANPR cameras at key road links alongside the monitoring sites would be highly beneficial.
5
Summary and Conclusions
5.1 A review of the automatic nitrogen dioxide, PM10 and PM2.5 monitoring network in London has been
carried out. The principal objectives of the study were:
• To identify the principal roles of the monitoring network in London (both current and future); • To identify which sites provide the most useful data; and
• To identify any gaps in the monitoring network which are critical to the delivery of the principal
roles.
5.2 The principal roles of the network are to: determine compliance with the objectives and limit values; provide information to research workers in academia and consultancies; assist with the preparation of Environmental Impact Assessments and/or air quality assessments; identify trends in pollutant concentrations in order to assess the effectiveness of control strategies; evaluate the performance of models at both a local and London-wide scale; assist the boroughs in their LAQM duties; and inform the development of future policies and strategies to improve air quality. It is important to note that whilst the network plays a vital role in supporting a wide range of strategic assessments at the London-wide scale, it is largely dependant on organisation and funding at the individual borough level.
5.3 The sites of greatest value to the network have been identified. This has taken account of a range of different factors and uses a semi-quantitative scoring system developed for this project. Sites have been categorised as Category A (critical to the network), Category B (important to the network), or Category C (playing a limited role in the network). A summary of the categorised sites is provided in Table 12 and shown in Figures 18, 19 and 20. The majority of sites have been
Review of air quality monitroing network in London
classified as Category A, with a significant number classified as Category B; only a small number of sites are classified as Category C.
5.4 It is considered that there is relatively good coverage in the network for all pollutants, but a number of locations where additional monitoring would be beneficial have been identified.
Review of air quality monitroing network in London
Glossary and Abbreviations
AEI Average Exposure IndicatorANPR Automatic Number Plate Recognition AURN Automatic Urban and Rural Network AQCG Air Quality Cluster Group
BAA British Airports Authority BAM Beta Attenuation Monitor CAFE Clean Air for Europe ClearfLO Clean Air for London
KCL-ERG Kings College London Environmental Research Group FDMS Filter Dynamics Measurement System
Kerbside Sites with sample inlets within 1m of the kerb of a busy road. Sampling heights are within 2-3m of the ground.
LAQM Local Air Quality Management LAQN London Air Quality Network LEZ Low Emission Zone
NOx Nitrogen Oxides (includes nitrogen dioxide and nitric oxide)
O3 Ozone
Openair Open-source tools for air pollution data analysis PM Particulate Matter
PM10 Airborne Particulate matter less than 10 micrometers aerodynamic
diameter.
PM2.5 Airborne particulate matter less than 2.5 micrometers in aerodynamic
diameter
ReferenceMethod Standard method for measuring concentrations on PM10 and PM2.5 for comparison with the EU limit values, as defined in EN12341 and EN14907 respectively.
Review of air quality monitroing network in London
Reference Equivalent Analysers that have been demonstrated to be equivalent to the Reference Method, based on the Guidance for the Demonstartion of Equivalence. Roadside Sites with sample inlets between 1m and 5m of the kerbside. Sampling
heights are within 2-3m of the ground.
Suburban Sites typical of residential areas on the outskirts of a town or city. TEOM Tapered Element Oscillating Microbalance
Urban Background Urban locations away from major sources and broadly representative of town/city-wide background concentrations, e.g. urban residential areas. VCM Volatile Correction Model
Review of air quality monitroing network in London
Tables
Table 1: Summary of Sites Operating on 25th March 2011
PM10 PM2.5
Site Type
NOx / NO2 Ozone All
Sites Ref. Equiv.a All Sites Ref. Equiv.b Kerbside 12 1 12 8 3 2 Roadside 50 10 42 20 12 6 Urban Background 27 17 20 9 10 6 Suburban 10 7 10 2 4 2 Industrial 3 0 6 4 1 1 Airport 1 1 1 0 1 0 Total 103 36 91 43 31 17 a
i.e. (unheated) BAMs, FDMS, and Partisol samplers. b
Review of air quality monitroing network in London
Table 2: Highest Measured Annual Mean NO2 Concentrations in 2010
Relevant Exposure a Nearby Exposure b Site Name Annual Mean NO2 in 2010 (µµµµg/m3) AMd 1hd AMd 1hd Relevant for EU Reporting c
Lambeth - Brixton Road 173 x x x
Wandsworth - Putney High Street 166 x x x
City of London - Walbrook Wharf 116 x x
Kensington and Chelsea - Earls Court Rd 109 x x x
Westminster - Marylebone Road 97 x x
Ealing - Hanger Lane Gyratory 89 x x x x Kensington and Chelsea - Kings Road 87 x x
Camden - Shaftesbury Avenue 86 x x
Kensington and Chelsea - Knightsbridge 85 x x x
Camden - Swiss Cottage 81 x x x
Lambeth - Bondway Interchange 77 x
Waltham Forrest - Crooked Billet 74 x x Kensington and Chelsea - Cromwell Road 74 x x
Greenwich - Woolwich Flyover 72 x x
Tower Hamlets - Blackwall 72
Sutton - Wallington 71 x x
Brent - Ikea 71 x x x
Barnet - Tally Ho Corner 70 x x
Croydon - Norbury 70 x x x x
Hounslow - Brentford 67 x x x
Tower Hamlets - Mile End Road 65 x x
Redbridge - South Woodford 61 x x
a
i.e. there is relevant exposure (as defined in LAQM.TG(09)) in the immediate vicinity and at a similar distance from the road (or source).
b
i.e. there is relevant exposure (as defined in LAQM.TG(09))nearby, including if this is slightly further from road (or source).
c
i.e. relevant in terms of the criteria in Annex III of the CAFE Directive (2008), making a subjective decision about what constitutes a “major” junction.
d
AM = locations with relevant exposure in terms of the annual mean objective; 1h includes locations relevant exposure in terms of the 1-hour mean objective.
Review of air quality monitroing network in London
Table 3: Sites Measuring Exceedences of the 1-hour Mean NO2 Objective in 2010
Site Name Number of Hours with NO2 >200 µ µµ µg/m3 in 2010 Relevant Exposure a Nearby Exposure b Relevant for EU Reporting c
Wandsworth - Putney High Street 2,602 x x x
Lambeth - Brixton Road 2,563 x x x
City of London - Walbrook Wharf 570 x x
Westminster - Marylebone Road 511 x x
Kensington and Chelsea - Earls Court Rd 436 x x Kensington and Chelsea - Knightsbridge 236 x x x Ealing - Hanger Lane Gyratory 160 x x
Camden - Swiss Cottage 128 x x
Sutton - Wallington 57 x x
Kensington and Chelsea - Kings Road 43 x x
Newham - Cam Road 38
Barnet - Tally Ho Corner 37 x x
Greenwich - Woolwich Flyover 37 x
Waltham Forrest - Crooked Billet 21 x
a
i.e. there is relevant exposure (as defined in LAQM.TG(09)) in terms of the 1-hour objective in the immediate vicinity and at a similar distance from the road (or source).
b
i.e. there is relevant exposure (as defined in LAQM.TG(09)) in terms of the 1-hour objective nearby, including if this is slightly further from road (or source).
c
i.e. relevant in terms of the criteria in Annex III of the CAFE Directive (2008). Making a subjective decision about what constitutes a “major” junction.
Table 4: Sites Measuring Exceedences of the Annual Mean PM10 Objective in 2010
Site Name Annual Mean PM10 in 2010 (µµµµg/m3) Relevant Exposure a Nearby Exposure b EU Sampling Point c
Lambeth - Bondway Interchange 43
Ealing - Horn Lane 41 x
a
i.e. there is relevant exposure (as defined in LAQM.TG(09)) in terms of the 24-hour objective in the immediate vicinity and at a similar distance from the road (or source).
b
i.e. there is relevant exposure (as defined in LAQM.TG(09)) in terms of the 24-hour objective nearby, including if this is slightly further from road (or source).
c
i.e. relevant in terms of the criteria in Annex III of the CAFE Directive (2008). Making a subjective decision about what constitutes a “major” junction.
Review of air quality monitroing network in London
Table 5: Sites Measuring Exceedences of the 24-hour Mean PM10 Objective in 2010
Site Name Number of Days with PM10 >50 µµµµg/m 3 in 2010 Relevant Exposure a Nearby Exposure b EU Sampling Point
Ealing - Horn Lane 94 x
Lambeth - Bondway Interchange 80 Brent - Neasden Lane 62 City of London - Upper Thames Street 54
Westminster - Marylebone Road 38 x
a
i.e. there is relevant exposure (as defined in LAQM.TG(09)) in terms of the 24-hour objective in the immediate vicinity and at a similar distance from the road (or source).
b
i.e. there is relevant exposure (as defined in LAQM.TG(09)) in terms of the 24-hour objective nearby, including if this is slightly further from road (or source).
c
i.e. relevant in terms of the criteria in Annex III of the CAFE Directive (2008). Making a subjective decision about what constitutes a “major” junction.
Review of air quality monitroing network in London
Table 6: Sites Used for Strategic Level Assessments
A E I P M2 .5 R e fe re n c e L E Z S u p e rs it e L E Z B a c k g ro u n d c o n tr o ls L A Q N In d e x L E Z T re n d A n a ly s is C le a rF lo O x id a ti v e P o te n ti a l A U R N Bexley - Belvedere x x
Bexley - Slade Green x x x x
Bexley - Thamesmead x
Brent - Ikea x
Brent - Kingsbury x
Camden - Bloomsbury x x x x
Camden - Shaftesbury Avenue x x
Camden - Swiss Cottage x x x
City of London - Senator House x
Croydon - Purley Way x x
Croydon - Thornton Heath x
Ealing - Acton Town Hall x x
Ealing - Ealing Town Hall x x
Ealing - Southall x
Greenwich - Eltham x x x x x
Greenwich - Westhorne Avenue x Greenwich - Woolwich Flyover x Greenwich and Bexley - Falconwood x
Hackney - Clapton x
Hackney - Old Street x
Haringey - Haringey Town Hall x x x x
Haringey - Priory Park x x x
Harrow - Stanmore x x
Hillingdon - Harlington x x
Hillingdon - Sipson Road x
Kensington and Chelsea - Cromwell Road x x x Kensington and Chelsea - North Ken x x x x x x
Lewisham - New Cross x
Newham - Wren Close x
Richmond - Barnes Wetlands x
Richmond - Castlenau x
Richmond - National Physics Laboratory x x x
Sutton - Carshalton x x
Southwark - A2 Old Kent Road x
Tower Hamlets - Blackwall x
Tower Hamlets - Mile End Road x x x
Tower Hamlets - Poplar x x
Waltham Forrest - Dawlins Road x
Wandsworth - Town Hall x
Westminster - Horseferry Road x x x Westminster - Marylebone Road x x x x x
Review of air quality monitroing network in London
Table 7: Description of Kerbside Sites a
Site Name F u n d in g S tr a te g ic N O x O z o n e P M1 0 P M2 .5 D u ra ti o n Q A /Q C D a ta C a p tu re h o ts p o t E x p o s u re M o d e l V e ri fi c a ti o n N u m e ri c a l S c o re C a te g o ry
Barking and Dagenham - North Street LA x x x xx x xx xx 24 B
Barnet - Tally Ho Corner LA x T xx x xx xx x xx 36 A
Camden - Swiss Cottage LA x x x x xx x xx x x 49 A
Croydon - Norbury LA x xx x xx xx x xx 34 A
Kensington and Chelsea - Earls Court Rd LA x x x x xx xx x xx 34 A
Lambeth - Brixton Road LA x x x x xx xx xx 27 B
Redbridge - Fullwell Cross LA x x B xx x xx x x 27 B
Sutton - Wallington LA x T x x xx xx x xx 33 A
Sutton - Worcester Park LA x x x x xx xx 20 B
Waltham Forrest - Crooked Billet LA x T x xx xx 13 C
Wandsworth - Putney High Street LA x T x xx xx xx 24 B
Westminster - Marylebone Road AURN x x x x x xx x xx xx x xx 56 A
Westminster - Oxford Street LA x x n/a n/a xx 12/26 B/C
a
Review of air quality monitroing network in London
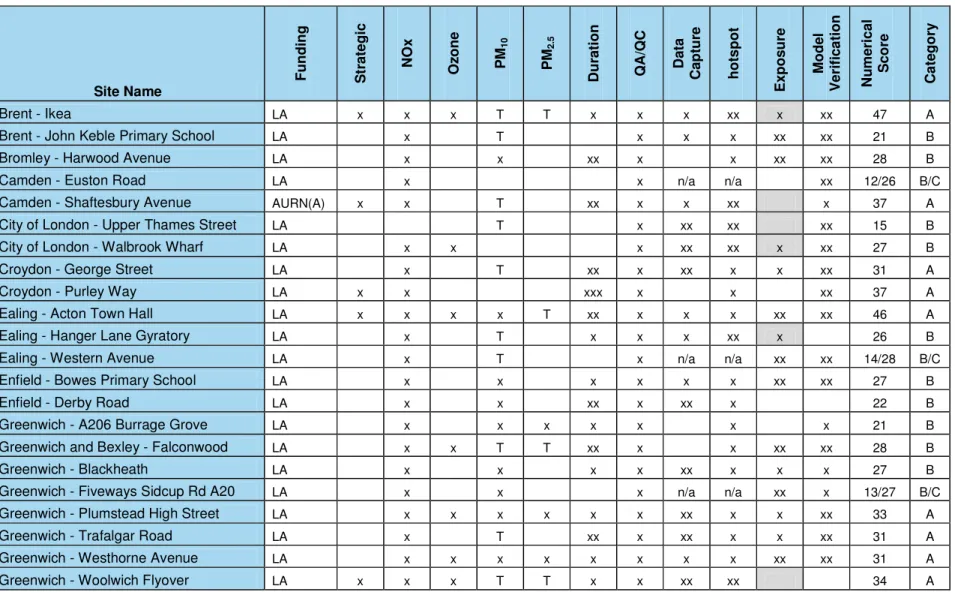
Table 8: Description of Roadside Sites a
Site Name F u n d in g S tr a te g ic N O x O z o n e P M1 0 P M2 .5 D u ra ti o n Q A /Q C D a ta C a p tu re h o ts p o t E x p o s u re M o d e l V e ri fi c a ti o n N u m e ri c a l S c o re C a te g o ry Brent - Ikea LA x x x T T x x x xx x xx 47 A
Brent - John Keble Primary School LA x T x x x xx xx 21 B
Bromley - Harwood Avenue LA x x xx x x xx xx 28 B
Camden - Euston Road LA x x n/a n/a xx 12/26 B/C
Camden - Shaftesbury Avenue AURN(A) x x T xx x x xx x 37 A
City of London - Upper Thames Street LA T x xx xx xx 15 B
City of London - Walbrook Wharf LA x x x xx xx x xx 27 B
Croydon - George Street LA x T xx x xx x x xx 31 A
Croydon - Purley Way LA x x xxx x x xx 37 A
Ealing - Acton Town Hall LA x x x x T xx x x x xx xx 46 A
Ealing - Hanger Lane Gyratory LA x T x x x xx x 26 B
Ealing - Western Avenue LA x T x n/a n/a xx xx 14/28 B/C
Enfield - Bowes Primary School LA x x x x x x xx xx 27 B
Enfield - Derby Road LA x x xx x xx x 22 B
Greenwich - A206 Burrage Grove LA x x x x x x x 21 B
Greenwich and Bexley - Falconwood LA x x T T xx x x xx xx 28 B
Greenwich - Blackheath LA x x x x xx x x x 27 B
Greenwich - Fiveways Sidcup Rd A20 LA x x x n/a n/a xx x 13/27 B/C
Greenwich - Plumstead High Street LA x x x x x x xx x x xx 33 A
Greenwich - Trafalgar Road LA x T xx x xx x x xx 31 A
Greenwich - Westhorne Avenue LA x x x x x x x x xx xx 31 A
Review of air quality monitroing network in London Site Name F u n d in g S tr a te g ic N O x O z o n e P M1 0 P M2 .5 D u ra ti o n Q A /Q C D a ta C a p tu re h o ts p o t E x p o s u re M o d e l V e ri fi c a ti o n N u m e ri c a l S c o re C a te g o ry
Hackney - Old Street LA x x x T T xx x xx x x 42 A
Haringey - Haringey Town Hall AURN(A) x x x x xxx x x x xx 45 A
Harrow - Pinner Road LA x T x x xx x xx xx 28 B
Havering - Rainham LA x xxx x xx 22 B
Havering - Romford LA x x xx x x xx 25 B
Hillingdon - Hillingdon Hospital LA x T x x xx xx 23 B
Hillingdon - Oxford Avenue LA x T x x xx x xx xx 28 B
Hillingdon - South Ruislip LA x T xxx x xx x xx xx 33 A
Hillingdon Hayes BAA x x x n/a n/a xx xx 15/29 B
Hounslow - Brentford LA x T x x xx x 24 B
Hounslow - Chiswick High Road LA x x xx x x n/a xx xx 25/35 A/B
Hounslow - Feltham LA x T x x xx 14 C
Hounslow - Heston Road LA x T x x x x x 19 B
Islington - Holloway Road LA x T xx x xx x xx x 29 B
Kensington and Chelsea - Cromwell
Road AURN x x x x xx x xx xx 41 A
Kensington and Chelsea - Kings Road LA x xx x xx xx x xx 34 A
Kensington and Chelsea - Knightsbridge LA x xx x x xx xx xx 32 A
Lambeth - Bondway Interchange LA x x x x xx 12 C
Lewisham - New Cross LA x T x x xx x xx 23 B
Merton - Morden Civic Centre LA x x x x x 12 C
Newham - Cam Road LA x x T xx x x xx xx 25 B
Redbridge - Gardner Close LA x x B xx x x x xx 28 B
Redbridge - South Woodford LA x x x x x xx xx 22 B
Richmond - Castlenau LA x T xx x xx x xx 26 B
Review of air quality monitroing network in London Site Name F u n d in g S tr a te g ic N O x O z o n e P M1 0 P M2 .5 D u ra ti o n Q A /Q C D a ta C a p tu re h o ts p o t E x p o s u re M o d e l V e ri fi c a ti o n N u m e ri c a l S c o re C a te g o ry
Tower Hamlets - Blackwall LA x x x x x x xx xx x 36 A
Tower Hamlets - Mile End Road AURN(A) x x xxx x xx xx xx 41 A
Waltham Forrest - Leyton LA x x x x x 12 C
Wandsworth - Putney Façade LA x x n/a n/a xx 12/26 B/C
a
For an Explanation of this Table, see paragraph 3.18
Table 9: Description of Urban Background Sites a
Site Name F u n d in g S tr a te g ic N O x O z o n e P M1 0 P M2 .5 D u ra ti o n Q A /Q C D a ta C a p tu re R e p re s e n ts B a c k g ro u n d L e v e ls N u m e ri c a l S c o re C a te g o ry Barnet - Finchley LA x T xx x xx x 31 A
Belvedere West LA x x T T x n/a x 20/24 B
Camden - Bloomsbury AURN x x x x x xxx x x 41 A
City of London - Senator House LA x x x x x x 30 A
City of London - Sir John Cass School LA x x x x xx 19 B
Ealing - Ealing Town Hall LA x x x xxx x x 35 A
Ealing - Southall LA x x T x x xx x 43 A
Hackney - Clapton LA x x T xxx x xx 22 B
Haringey - Priory Park AURN(A) x x x x xxx x xx x 50 A
Harrow - Stanmore AURN(A) x x T x xx x x x 47 A
Heathrow Greengates BAA x T T x x n/a x 24/28 B
Review of air quality monitroing network in London Site Name F u n d in g S tr a te g ic N O x O z o n e P M1 0 P M2 .5 D u ra ti o n Q A /Q C D a ta C a p tu re R e p re s e n ts B a c k g ro u n d L e v e ls N u m e ri c a l S c o re C a te g o ry
Hillingdon - Sipson BAA x x x n/a 8/12 C
Hounslow - Hatton Cross LA x T x x x 16 B
Hounslow Oaks Road BAA x x T T x x n/a x 25/29 B
Islington - Arsenal LA x T x xx 13 C
Kensington and Chelsea - North Ken AURN(A) x x x x x xxx x xx x 53 A
Lambeth - Streatham Green LA x x 5 C
Lewisham - Catford LA x x xx x xx 20 B
Newham - Wren Close LA x x x T x x x 32 A
Redbridge - Perth Terrace LA x x x xx x xx x 33 A
Richmond - National Physics Laboratory AURN(A) x x x x xx x x x 46 A
Tower Hamlets - Poplar LA x x x T xxx x xx x 49 A
Waltham Forrest - Dawlins Road LA x x T xx x xx x 46 A
Wandsworth - Putney LA x x x n/a x 20/24 B
Wandsworth - Town Hall LA x x xxx x xx 22 B
Westminster - Horseferry Road AURN x x x x x x x x 44 A
a
Review of air quality monitroing network in London
Table 10: Description of Suburban Sites a
Site Name F u n d in g S tr a te g ic N O x O z o n e P M1 0 P M2 .5 D u ra ti o n Q A /Q C D a ta C a p tu re R e p re s e n ts B a c k g ro u n d L e v e ls N u m e ri c a l S c o re C a te g o ry
Barking and Dagenham - Rush Green LA x xx x xx x 29 B
Barking and Dagenham - Scrattons Farm LA x T xx x xx x 31 A
Bexley - Belvedere LA x x T T xx x x x 44 A
Bexley - Slade Green AURN(A) x x x T x xxx x xx x 52 A
Bexley - Thamesmead LA x T T xx x xx x 43 A
Brent - Kingsbury LA x x T xxx x x x 32 A
Croydon - Thornton Heath LA x x T xx x x x 42 A
Greenwich - Eltham AURN(A) x x x x x xxx x x 41 A
Hillingdon - Sipson Road AURN(A) x x x T xx x 33 A
Hounslow - Cranford LA x x x xx x x 29 B
Richmond - Barnes Wetlands LA x x T xx x xx x 46 A
Sutton - Carshalton LA X x x xxx x xx 37 A
a
Review of air quality monitroing network in London
Table 11: Description of Industrial and Airport Sites a
Site Name F u n d in g S tr a te g ic N O x O z o n e P M1 0 P M2 .5 D u ra ti o n Q A /Q C D a ta C a p tu re N u m e ri c a l S c o re C a te g o ry Industrial Sites
Bexley - Manor Road East Gravimetric LA x x n/a 7/11 B/C
Bexley - Manor Road West Gravimetric LA x xx x n/a b 15/19 A
Brent - Neasden Lane LA x T x x 14 B
Ealing - Horn Lane LA x T x x x 16 A
Greenwich - Millennium Village LA x x x x x xx 22 A
Lewisham - Mercury Way LA x x 7 C
Airport Site
Heathrow LHR 2 BAA x x T T xxx x n/a 20/24 A
a
For an Explanation of this Table, see paragraph 3.18 b
Review of air quality monitroing network in London
Table 12: Sites Appraisal
Category A Sites Category B Sites Category C Sites
Kerbside Sites
Barnet - Tally Ho Corner Barking and Dagenham - North Street Waltham Forrest - Crooked Billet Camden - Swiss Cottage Lambeth - Brixton Road
Croydon - Norbury Redbridge - Fullwell Cross Kensington and Chelsea - Earls Court
Rd Sutton - Worcester Park
Sutton - Wallington Wandsworth - Putney High Street Westminster - Marylebone Road Westminster - Oxford Street a
Roadside Sites
Brent - Ikea Brent - John Keble Primary School Hounslow - Feltham
Camden - Shaftesbury Avenue Bromley - Harwood Avenue Lambeth - Bondway Interchange Croydon - George Street Camden - Euston Road a Merton - Morden Civic Centre Croydon - Purley Way City of London - Upper Thames Street Waltham Forrest – Leyton Ealing - Acton Town Hall City of London - Walbrook Wharf
Greenwich - Plumstead High Street Ealing - Hanger Lane Gyratory Greenwich - Trafalgar Road Ealing - Western Avenue a Greenwich - Westhorne Avenue Enfield - Bowes Primary School Greenwich - Woolwich Flyover Enfield - Derby Road
Hackney - Old Street Greenwich - A206 Burrage Grove Haringey - Haringey Town Hall Greenwich - Blackheath
Hillingdon - South Ruislip Greenwich - Fiveways Sidcup Rd A20 a Hounslow - Chiswick High Road a Greenwich and Bexley - Falconwood Kensington and Chelsea - Cromwell
Road Harrow - Pinner Road
Kensington and Chelsea - Kings Road Havering - Rainham Kensington and Chelsea -
Knightsbridge Havering - Romford
Southwark - A2 Old Kent Road Hillingdon - Hillingdon Hospital Tower Hamlets - Blackwall Hillingdon - Oxford Avenue Tower Hamlets - Mile End Road Hillingdon Hayes
Hounslow - Brentford Hounslow - Heston Road Islington - Holloway Road Lewisham - New Cross Newham - Cam Road Redbridge - Gardner Close Redbridge - South woodford Richmond - Castlenau Wandsworth - Putney Façade a
Urban Background Sites
Barnet - Finchley Belvedere West Hillingdon - Sipson Camden - Bloomsbury Hackney - Clapton Islington - Arsenal City of London - Senator House Heathrow Greengates
City of London - Sir John Cass School Hounslow - Hatton Cross Ealing - Ealing Town Hall Hounslow Oaks Road Ealing - Southall Lambeth - Streatham Green